Mesh View
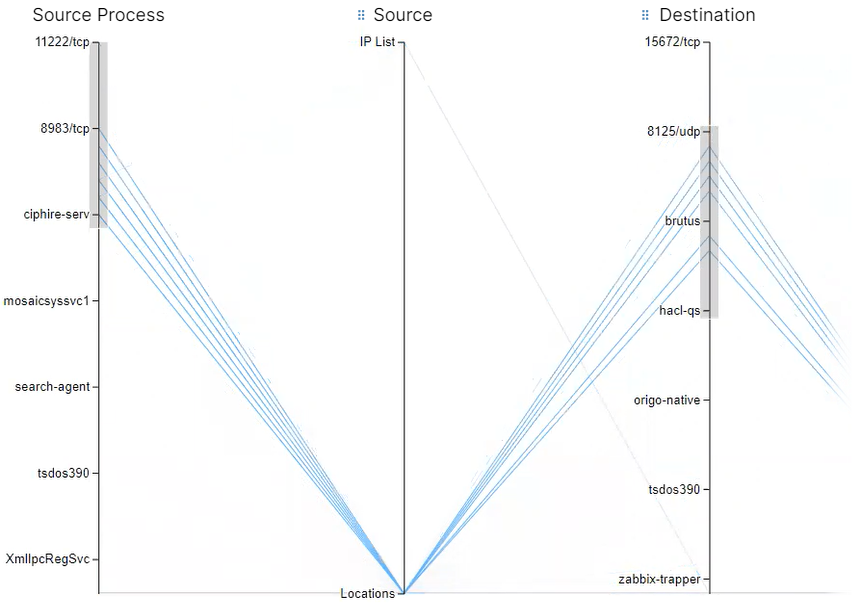
The Mesh view displays traffic flows as a vertical list of Destinations, Sources, and the port being used in the flows.
About the Mesh
You can click any item in the results to focus on specific flows. You can also sort the results to view results based on port number or number of traffic flows. From the Mesh view, you can drill down to filter, brush to filter, and then go to the Table view to write rules.
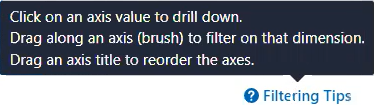
If you need prompting on how to filter the data in your Mesh view, click the Filtering Tips link in the bottom-right corner of the page for a pop-up tooltip.
The Mesh view always displays traffic flows based on the Reported view. You cannot switch to the Draft view for the Mesh. The View menu only appears when you are in the Illumination Plus Table and Map views.
Mesh View Limitation
In this release, you cannot filter in Mesh view to view only allowed or blocked traffic. The Mesh view does not allow you to toggle your data between the Reported view and the Draft view. The Mesh view only displays reported view data.
Customize the Mesh View Display
The Group by field that you use with the Map view is also used in the Mesh view. You will see your top group based on your selection and you can drill down through the groupings. The hierarchy of the parallel coordinates in the mesh is based on your selected grouping.
You can reorder the axis columns in the Mesh view by clicking an axis heading and dragging it left or right. You might want to reorder the Mesh axis columns to change the Mesh display; for example, you might drag the axis you are most interested in to the center of the mesh and less important data to the sides of the mesh.
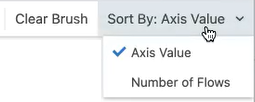
You can sort the Mesh data by the axis value which displays the ports numerically low (at the top) to high (at the bottom); for example, port 22 at the top and 10051 at the bottom of the axis. Along the axes, the app groups are in alphabetical order.
You can also sort by number of flows. Each axis is sorted based on which group has the most traffic. The page displays the “tick” with the most flows at the top of the axis.
You can use the brush feature to select along the top of an axis to select and filter by the highest ports.
Navigate the Mesh View Data
In the Mesh view, you can step down each vertical axis along the axis ticks to view specific connections between that tick and the data in other axes. Stepping through the axes ticks is reflected in the breadcrumbs above the Mesh to pinpoint your location as you view the data.
To brush the axes lines and filter Mesh data:
Hover over an axis line, so that the black line changes color to orange.
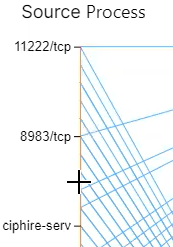
Click and drag down an axis line to apply a "brush" and select portions of the data.
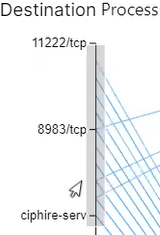
Using the brush feature on multiple axes, you can select areas that have connections to highlight certain flows.
When done filtering Mesh data, click Clear Brush in the top-right menu bar to reset the Mesh.