Servers and Endpoints Dashboard
The Servers and Endpoints Dashboard display summary statistics and status information for Server VENs and Endpoint VENs.
Note
One of the following global user roles are required to use the Ransomware Protection Dashboard:
Global Org Owner
Global Administrator
Working with the Servers and Endpoints Dashboard
To access the Servers and Endpoints Dashboard, click Dashboard > Servers and Endpoints Dashboard in the left navigation.
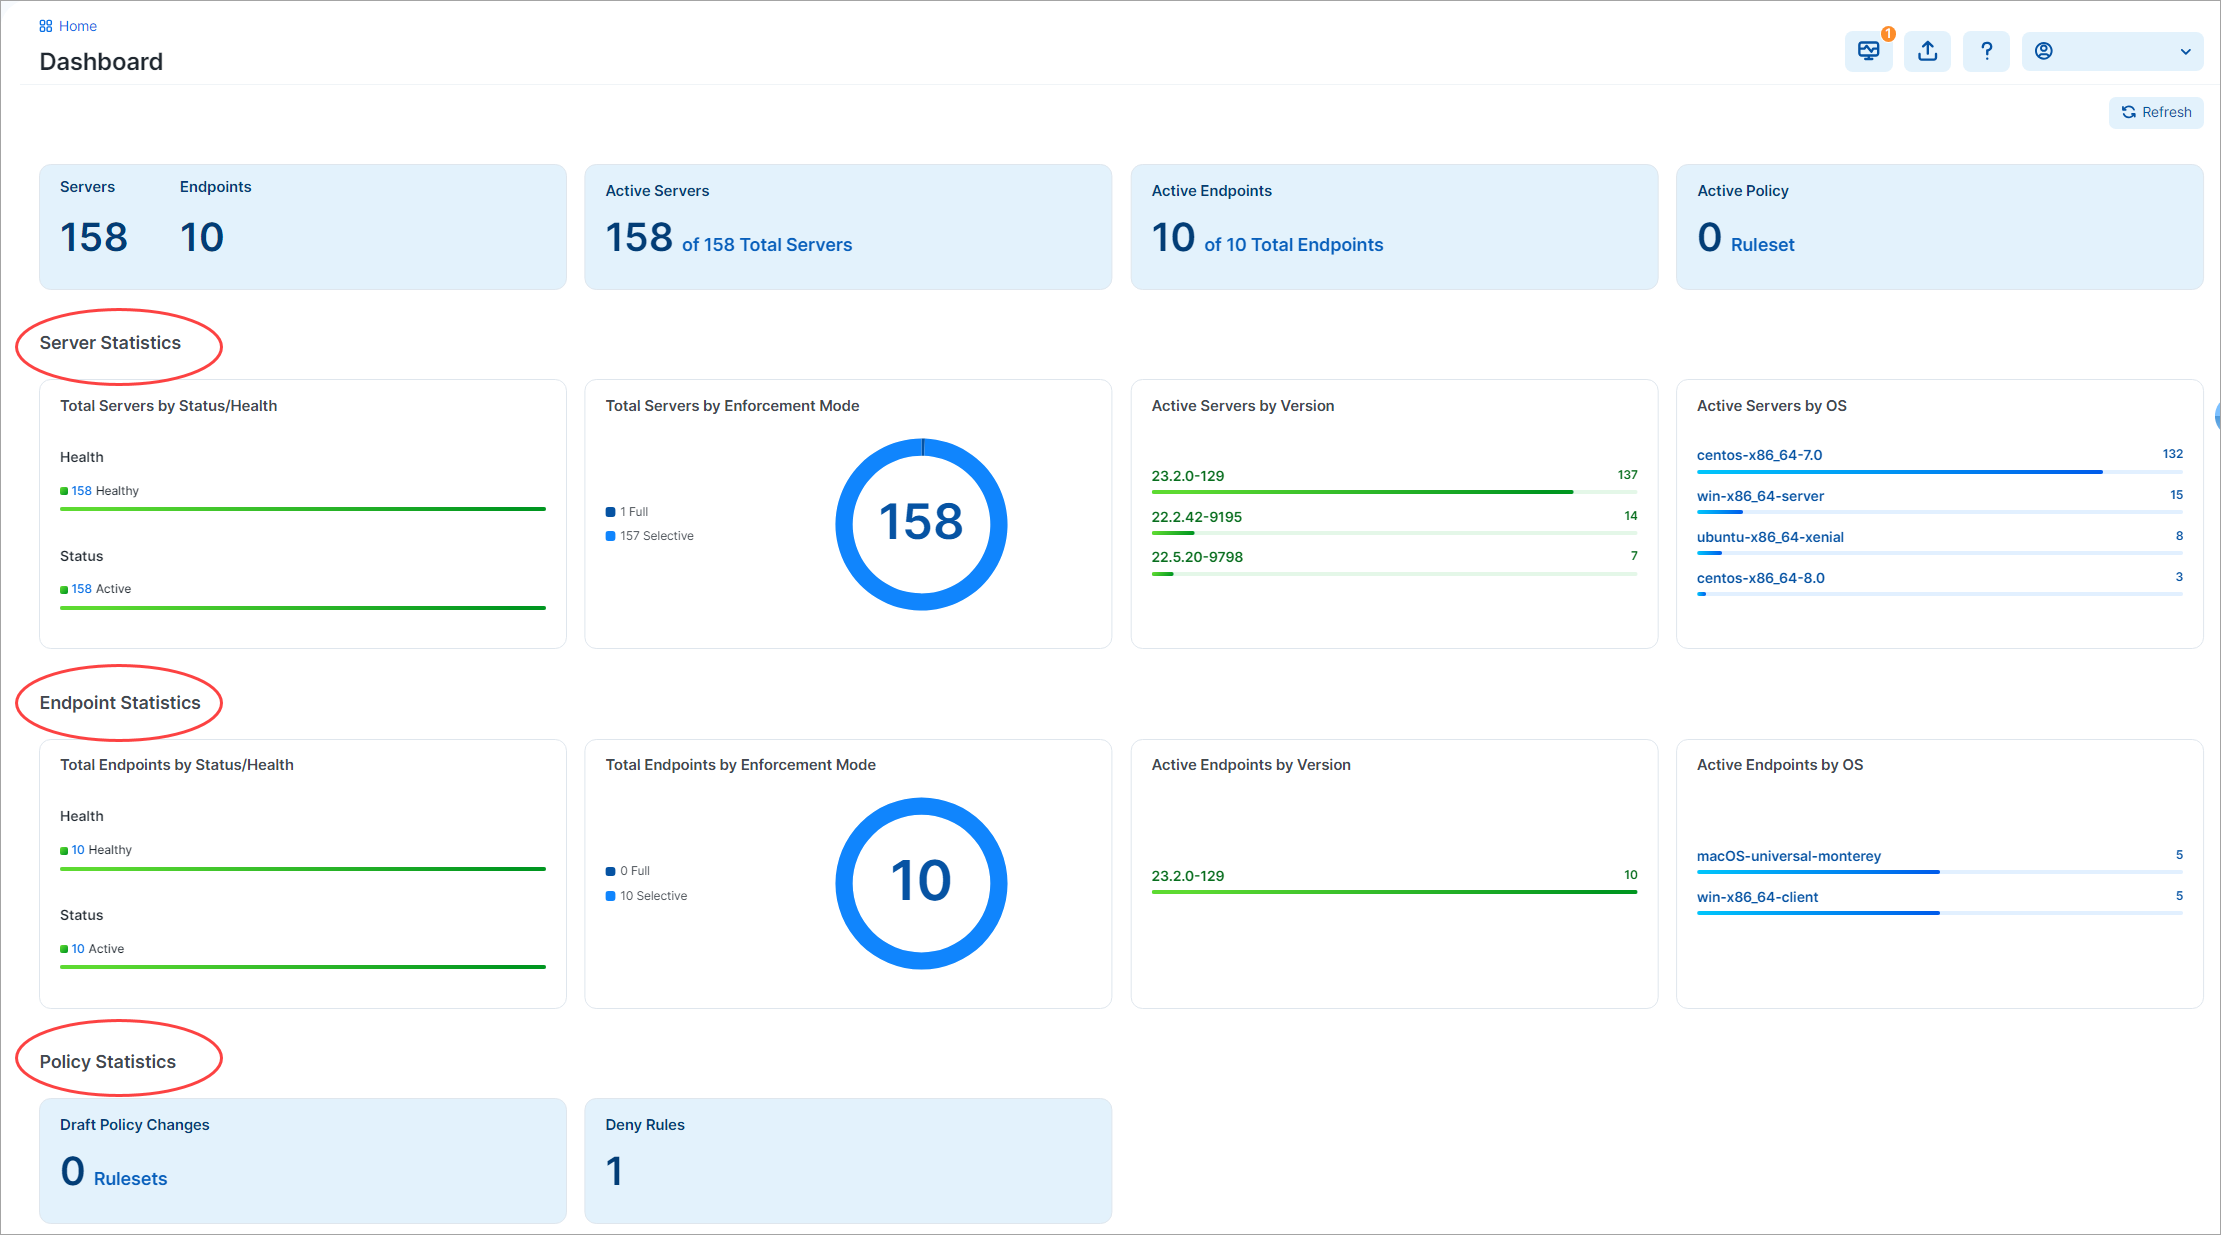
Servers and Endpoints Statistics
The Servers and Endpoints Dashboard uses an API to aggregate various data from the system and helps you focus on the data you are interested in.
The Server Statistics and Endpoint Statistics sections of the Dashboard present several widgets summarizing statistics and status. You can click hyperlinks on widgets to redirect to relevant areas of the product, often with the appropriate filters applied to the target resource.
In the lower sections, the VEN Statistics part of the Servers and Endpoints Dashboard includes the following widgets:
Policy Statistics
The Policy Statistics section includes widgets detailing the following:
The number of Draft Policy Changes. Clicking the widget redirects to the Draft Changes page, filtered by rulesets.
The number of Deny Rules. Clicking the widget redirects to the Deny Rules page.
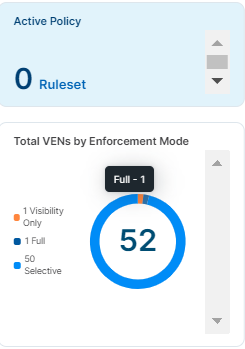
Total VENs by Enforcement Mode
VEN stats by enforcement mode: full, visibility only, idle, and selective enforcement.
Shortcuts for Working with the Servers and Endpoints Dashboard
Use these new shortcuts to the Workloads page from in the Servers and Endpoints Dashboard dashboard.
Go to Active Policy-> Total VENs by Enforcement Mode and click anywhere on the pie chart where you want to see the detailed information, such as on the Full segment (in dark blue):
Right-click on the selected segment.
Several options will be available.
Choose "Open link in new window":
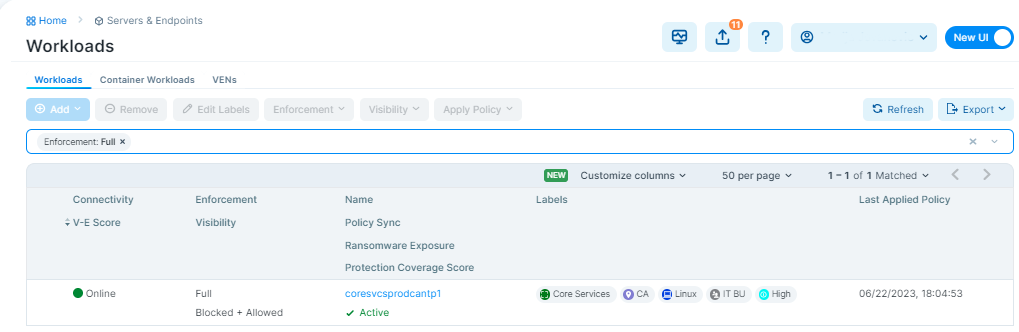
The Workloads page with the one workload in full enforcement mode is displayed..
Active VENs by Version
VEN stats by versions (number of VENs per version)
Active VENs by OS
VEN stats by currently employed versions (number of VENs per OS)