Reports
The PCE allows you to generate, download, and manage several types of recurring reports:
Executive Summary
App Group Summary
Traffic Export
Rule Hit Count
Reporting in the PCE
The PCE UI menu includes a Reports option. Generated reports appear on the Downloads tab.
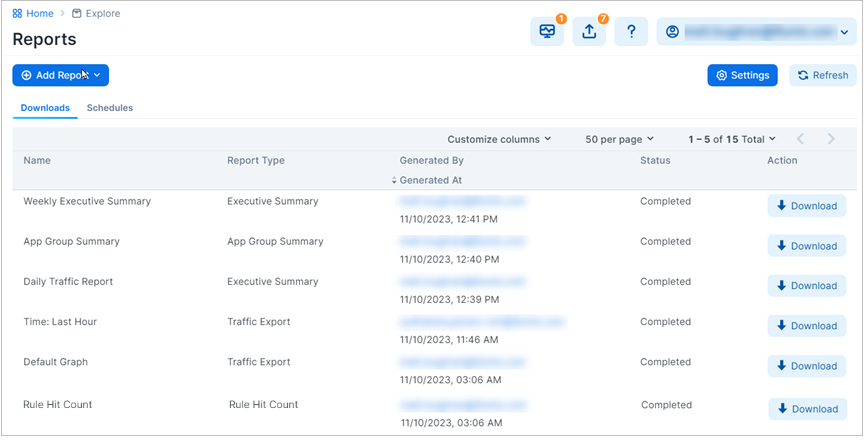
Reports are created in either PDF or CSV format, depending on the report type. You can download reports and share them with people in your organization who don’t have access to the PCE UI or PCE REST API.
While the data in the reports is not customizable, you can configure the time range of the data that the reports are generated from and the frequency at which they are run.
Recurring reports are run on the following schedule:
Daily: Midnight each day
Weekly: At midnight on the first Saturday after the report was added, then weekly at Saturday midnight
Monthly: Midnight on the last day of month after the report was added, then monthly on the last day at midnight
Quarterly: At the start of the next quarter after the report was added, then every three months thereafter. For Example, if the report was added in November, the first report is generated December 31st including data from October 1st - December 31st. The next report is generated March 31st including data from January 1st - March 31st.
The PCE only retains reports for a maximum of 7 days, but there is no limit to the number of reports you can create. Generated reports include data for provisioned security policy, managed and unmanaged workloads, and provisioned policy objects. Reports do not include changes you have made to your environment but haven't provisioned.
Executive Summary Reports
Executive Summary reports are high-level by design. They provide information to decision makers, such as an organization’s CIO or VP if IT, about the overall deployment of Illumio within the organization’s computing environment. These reports are intended to provide more business-oriented information than tactical data.
Executive Summary reports give the decision makers a snapshot into how Illumio policy enforcement is progressing and can display the return on investment (ROI) for purchasing and deploying Illumio software.
Executive Summary reports answer the following questions for decision makers:
How are we progressing in deploying security policy into our environment?
How many of our workloads are being managed by Illumio (VENs are installed on the hosts but they aren’t in enforcement mode)?
How quickly is enforcement progressing over time (the number of workloads that have moved into the enforcement mode over the report’s specified time range)?
What potentially dangerous traffic is Illumio blocking that wouldn’t have been blocked without Illumio Core, resulting in a security risk.
What sort of vulnerabilities do our workloads have? Vulnerability information is provided as a V-E score that is the sum of all app groups.
Important
To include app group and workload vulnerability data in the Executive Summary report, you must have purchased a license for the Vulnerability Map feature. The Vulnerability Map is a separately licensed feature of Illumio Core. The licensing is based on the number of workloads. The license is required to import Qualys report data into the Illumio PCE. For information about obtaining the Illumio Core Vulnerability Map license, contact Illumio Customer Support.
For more information about Vulnerability Maps, see Vulnerability Map.
Tips for Reading Executive Summary Reports
Executive Summary reports provide high-level information for decision makers. They are meant to show trends and patterns in your roll out of Illumio Core into your data center environment.
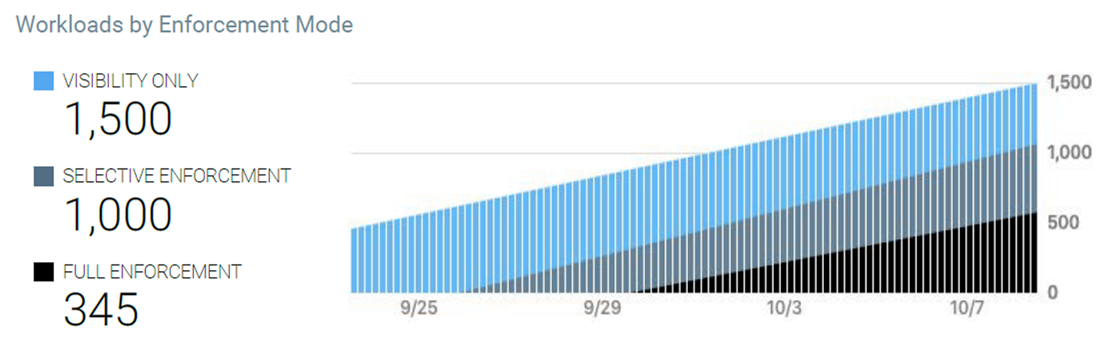
For example, an executive who has approved deploying Illumio Core might want to know how many of their workloads are being managed (enforced) by Illumio policy. The Workloads by Enforcement Mode graph shows the trend for how quickly enforcement is progressing over time and the percentage of workloads in deployment versus enforcement.
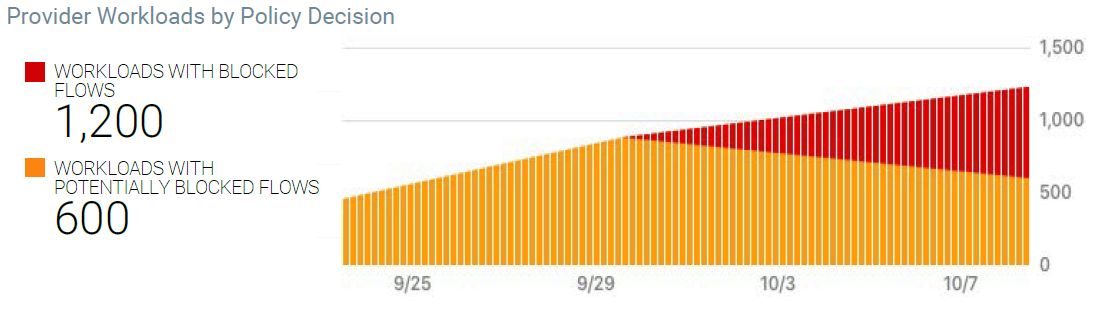
The Source Workloads by Policy Decision graph can help confirm when the rules you have created for your data center look viable and you can start enforcing policy on your workloads. This example graph shows a trend you want to see; and visually represents how you initially had workloads deployed but not in enforcement.
App Group Summary Report
Illumio Core contains many features designed for application owners; such as the App Group Map and role-based access (RBAC) for applications owners. For more information, see App Groups in this guide and "Role-based Access for Application Owners" in the PCE Administration Guide, respectively.
App Group Summary reports are designed for application owners (for example, members of your business applications group like your Oracle or ServiceNow app admins) or other people in your organization who need to understand the security of you applications, such as IT security auditors (for example, auditors of PCI or HIPA systems).
You create App Group Summary reports by application; meaning, each report provides data for only one application defined by a set of labels. Whether you choose 2 labels (application and environment) or 3 labels (application, environment, and location) for a report depends on how you have configured the PCE to define app groups. For more information, see Configure App Groups.
Using the App Group Summary report, application owners or IT security auditors can accomplish the following goals:
Examine which inbound and outbound services interact with a specific application. Having a clear picture of all traffic into and out of an application is important for accessing the security posture of the application.
Understand whether connections are normal for an application and monitor the application’s health and status over time. For example, you can create a weekly report to monitor the state of an application over time and detect any changes in inbound or outbound network services.
Fulfill compliance auditing requirements. For example, you can run a report every 30 days and review the report to ensure the application connection status matches with the application’s baseline.
Establish a connection baseline for an application and use that baseline to create security policy (rules or selective enforcement rules) for the application. See “Rules” and “Rule Writing” in the Security Policy Guide for information.
After creating security policy (rules) for an application in the PCE, see the impact of the Illumio security policy on the application.
Traffic Export Report
You can run a previously saved Traffic filter and export the results to a CSV file on a recurring schedule.
Note
If you edit the filter, subsequent recurrences of the Traffic Export continue to use the original version of the filter.
Rule Hit Count Report
The Rule Hit Count Report provides the following:
Policy Compliance: Generate a Rule Hit Count Report to provide evidence that security controls are in place and working effectively, demonstrating compliance to auditors.
Redundancy Removal: Identify unused or less-used rules so you can remove or modify them to reduce redundancy and clutter in your implementation.
Troubleshooting: When network issues arise, identify the rules that were in effect during the relevant traffic flow, allowing you to resolve problems faster and more efficiently.
For more information, see the topics Work with Reports in the PCE in this guide and "Rulesets and Rules" in the REST API Developer Guide.
PCE Version:
SaaS: 24.2.0 or later
On-prem 23.5.10 or later
VEN Version: 23.2.30 or later
Support for up to 25k VENs.
Support for up to 75k total rules.
The VEN can report a maximum of 100 rule IDs for each reported flow entry. If there are more than 100 rule ID matches for a flow, the rule IDs are truncated.
No support for Superclusters.
Only active rules are counted.
Essential rules (rules necessary for the Illumio platform to function) are not counted.
The report includes each rule's hypertext reference attribute (HREF). The HREF maps directly to a rule in the PCE UI, but clicking the HREF does not redirect you to the specific rule. It merely loads the JSON object of the rule.
VENs report to the PCE the hit count of all the overlapping rules for a flow.
VEN enablement for this feature makes use of label scopes similar to firewall co-existence and SecureConnect.
Rule count data is retained for 90 days, after which the oldest data is dropped.
Last Hit timestamps are retained for the life of the PCE.
The report includes the active rule IDs within the rule sets you specified when you configured the report, plus all the deny rules.
Hit Count values reflect the total number of hits recorded during the configured time range.
Due to PCE policy optimization, some rules that weren't written to overlap my end up overlapping. For example:
Given two flows:
A → B on TCP/443
A → C on TCP/443
Although the flow from A → B on TCP/443 never overlaps with the flow from A → C, due to policy optimization, the rule counter for both rules may increment.
STEP 1: Enable Rule Hit Count
The PCE and VENs require enablement through the Illumio REST API. For details, see "Enable Rule Hit Count" in the REST API Developer Guide.
STEP 2: Create Rule Names in the PCE
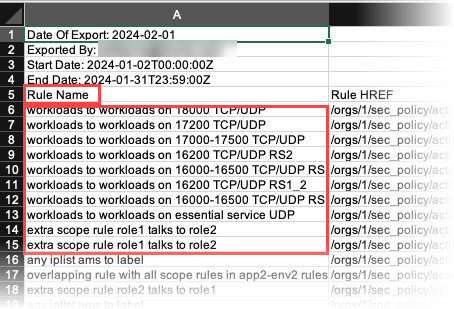
To ensure that there are names in the Rule Name column, you need to add a Note through the PCE UI for each rule that will be captured in the report. The Rule Hit Count Report populates the Rule Name column by pulling the Note contents from the specified rules.
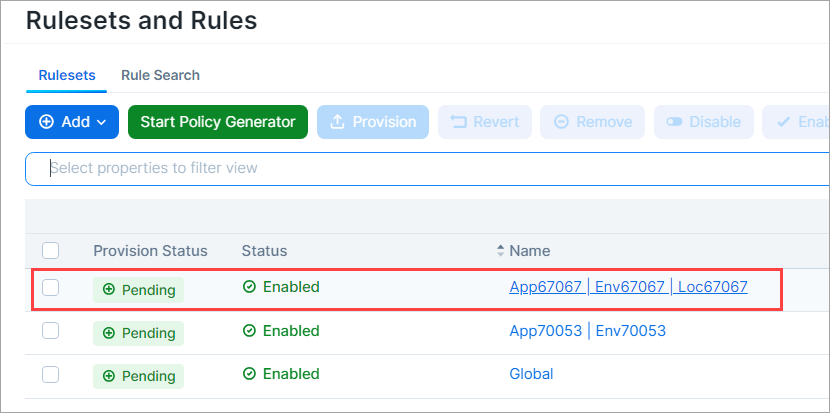
Go to Policy > Rulesets & Rules.
Click a ruleset to open its details page.
To provide a name that the Rule Hit Count Report can use, add a note to a rule.
Click the three vertical dots adjacent to the rule, and then click Add Note.
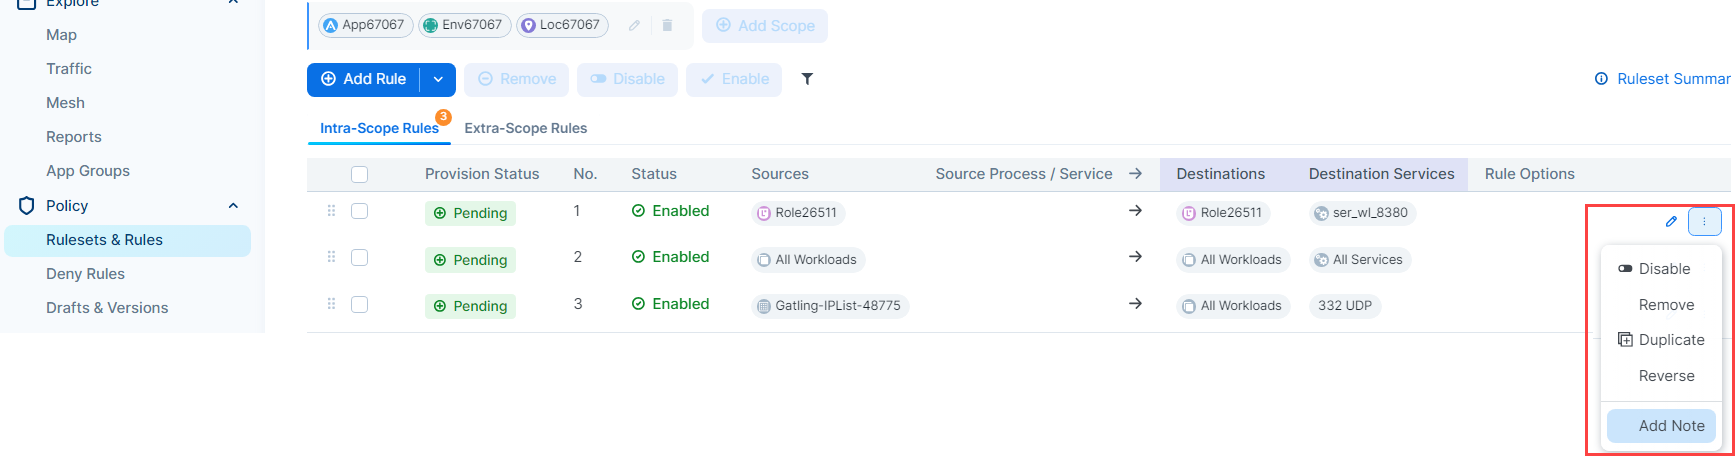
Enter a name for the rule. The name you enter appears in the Rule Name column when you generate the Rule Hit Count Report.
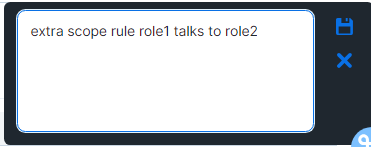
Click the Save icon in the upper right corner. A word bubble icon
 appears next to the pencil icon.
STEP 3: Generate the Rule Hit Count Report
See Add a Report.
The following example scenarios help explain how rule hit counts are calculated and reported.
Scenario 1
Flow: Workload A → Workload B on TCP/443 (reported by both sides)
Enforcement Mode: n/a
Rules | Count | Comments |
|---|---|---|
Workload A → Workload B on TCP/443 | 2 | Both workloads reported the flow and this rule is executed by both of them. |
Workload A → Any IP List | 1 | Only workload A executes this rule. |
Some IP List Covering A → B | 1 | Only workload B executes this rule. |
Scenario 2
Flow: Workload A → Workload B on TCP/443 through a network enforcement point that blocks A → B (so only reported by A)
Enforcement Mode: n/a
Rules | Count | Comments |
|---|---|---|
Workload A → Workload B on TCP/443 | 1 | Because A has a VEN on it and it allowed the flow and B hasn't reported it. |
Workload A → Any IP List | 1 | Because A has a VEN on it and it allowed the flow. |
Some IP List Covering A → B | 0 | Because A has a VEN on it and it allowed the flow. |
Scenario 3
Flow: Workload A → Workload B on TCP/445
Case 1 Enforcement:
Workload A Enforcement Mode - Visibility and TCP/445 is not allowed outbound
Workload B Enforcement Mode - Full
Rules | Count |
|---|---|
Allow Any (0.0.0.0/0) → Workload B on all services | 1 |
Case 2 Enforcement:
Workload A Enforcement Mode - Full and TCP/445 is not allowed outbound
Workload B Enforcement Mode -Full
Rules | Count |
|---|---|
Allow Any (0.0.0.0/0) → Workload B on all services | 0 |
Case 3 Enforcement:
Workload A Enforcement Mode - Selective
Workload B Enforcement Mode -Full
Rules | Count |
|---|---|
TCP/445 is blocked outbound on A via boundary | 1 |
Allow Any → Workload B on all services | 0 |
Scenario 4
Flow: Workload (Endpoint) C → Workload (Server) B on TCP/443
Endpoint A - Label:Loc1 (IP address: 10.3.2.4/24 → subnet = 10.3.2.0/24 == 10.3.2.0 → 10.3.2.255)
Server B - Label:App1
Endpoint C - Label:Loc2 (IP address: 10.3.2.7/24 → subnet = 10.3.2.0/24 == 10.3.2.0 → 10.3.2.255)
Behavior:
Endpoint C will drop the flow if it's in Enforcement Mode (because there's no rule allowing outbound)
Server B will accept a flow from either Endpoint A or Endpoint C if the flow makes it to server B
Case 1 Enforcement:
Endpoint C Enforcement Mode - Full
Rules | Count | Comments |
|---|---|---|
Loc1 | Endpoints (Use WL subnets) → App1 | 0 | Endpoint C will drop the flow because there is no outbound rule. |
Case 2 Enforcement:
Endpoint C Enforcement Mode - Selective
Rules | Count | Comments |
|---|---|---|
Loc1 | Endpoints (Use WL subnets) → App1 | 1 | Endpoint C will allow the flow because there is no boundary. Server B will allow the flow because Endpoint C is in the same subnet as Endpoint A. The report indicates that the Loc1 rule was hit, but the flow is coming from a Loc2 Endpoint. |
Scenario 5 (PCE rule optimization)
Flow: Workload A → Workload B on TCP/443
If the address of workload B and workload C overlap, then PCE rule optimization could merge the following rules resulting in the second rule also being incremented.
Rules | Count | Comments | |
|---|---|---|---|
Workload A → Workload B on TCP/443 | 2 | Both workloads report the flow. | 2 |
Workload A → Workload C on TCP/443 | 2 | The reported flow could potentially contain this rule ID as well because of PCE rule optimization. |