Illumio Flow Data Workbook
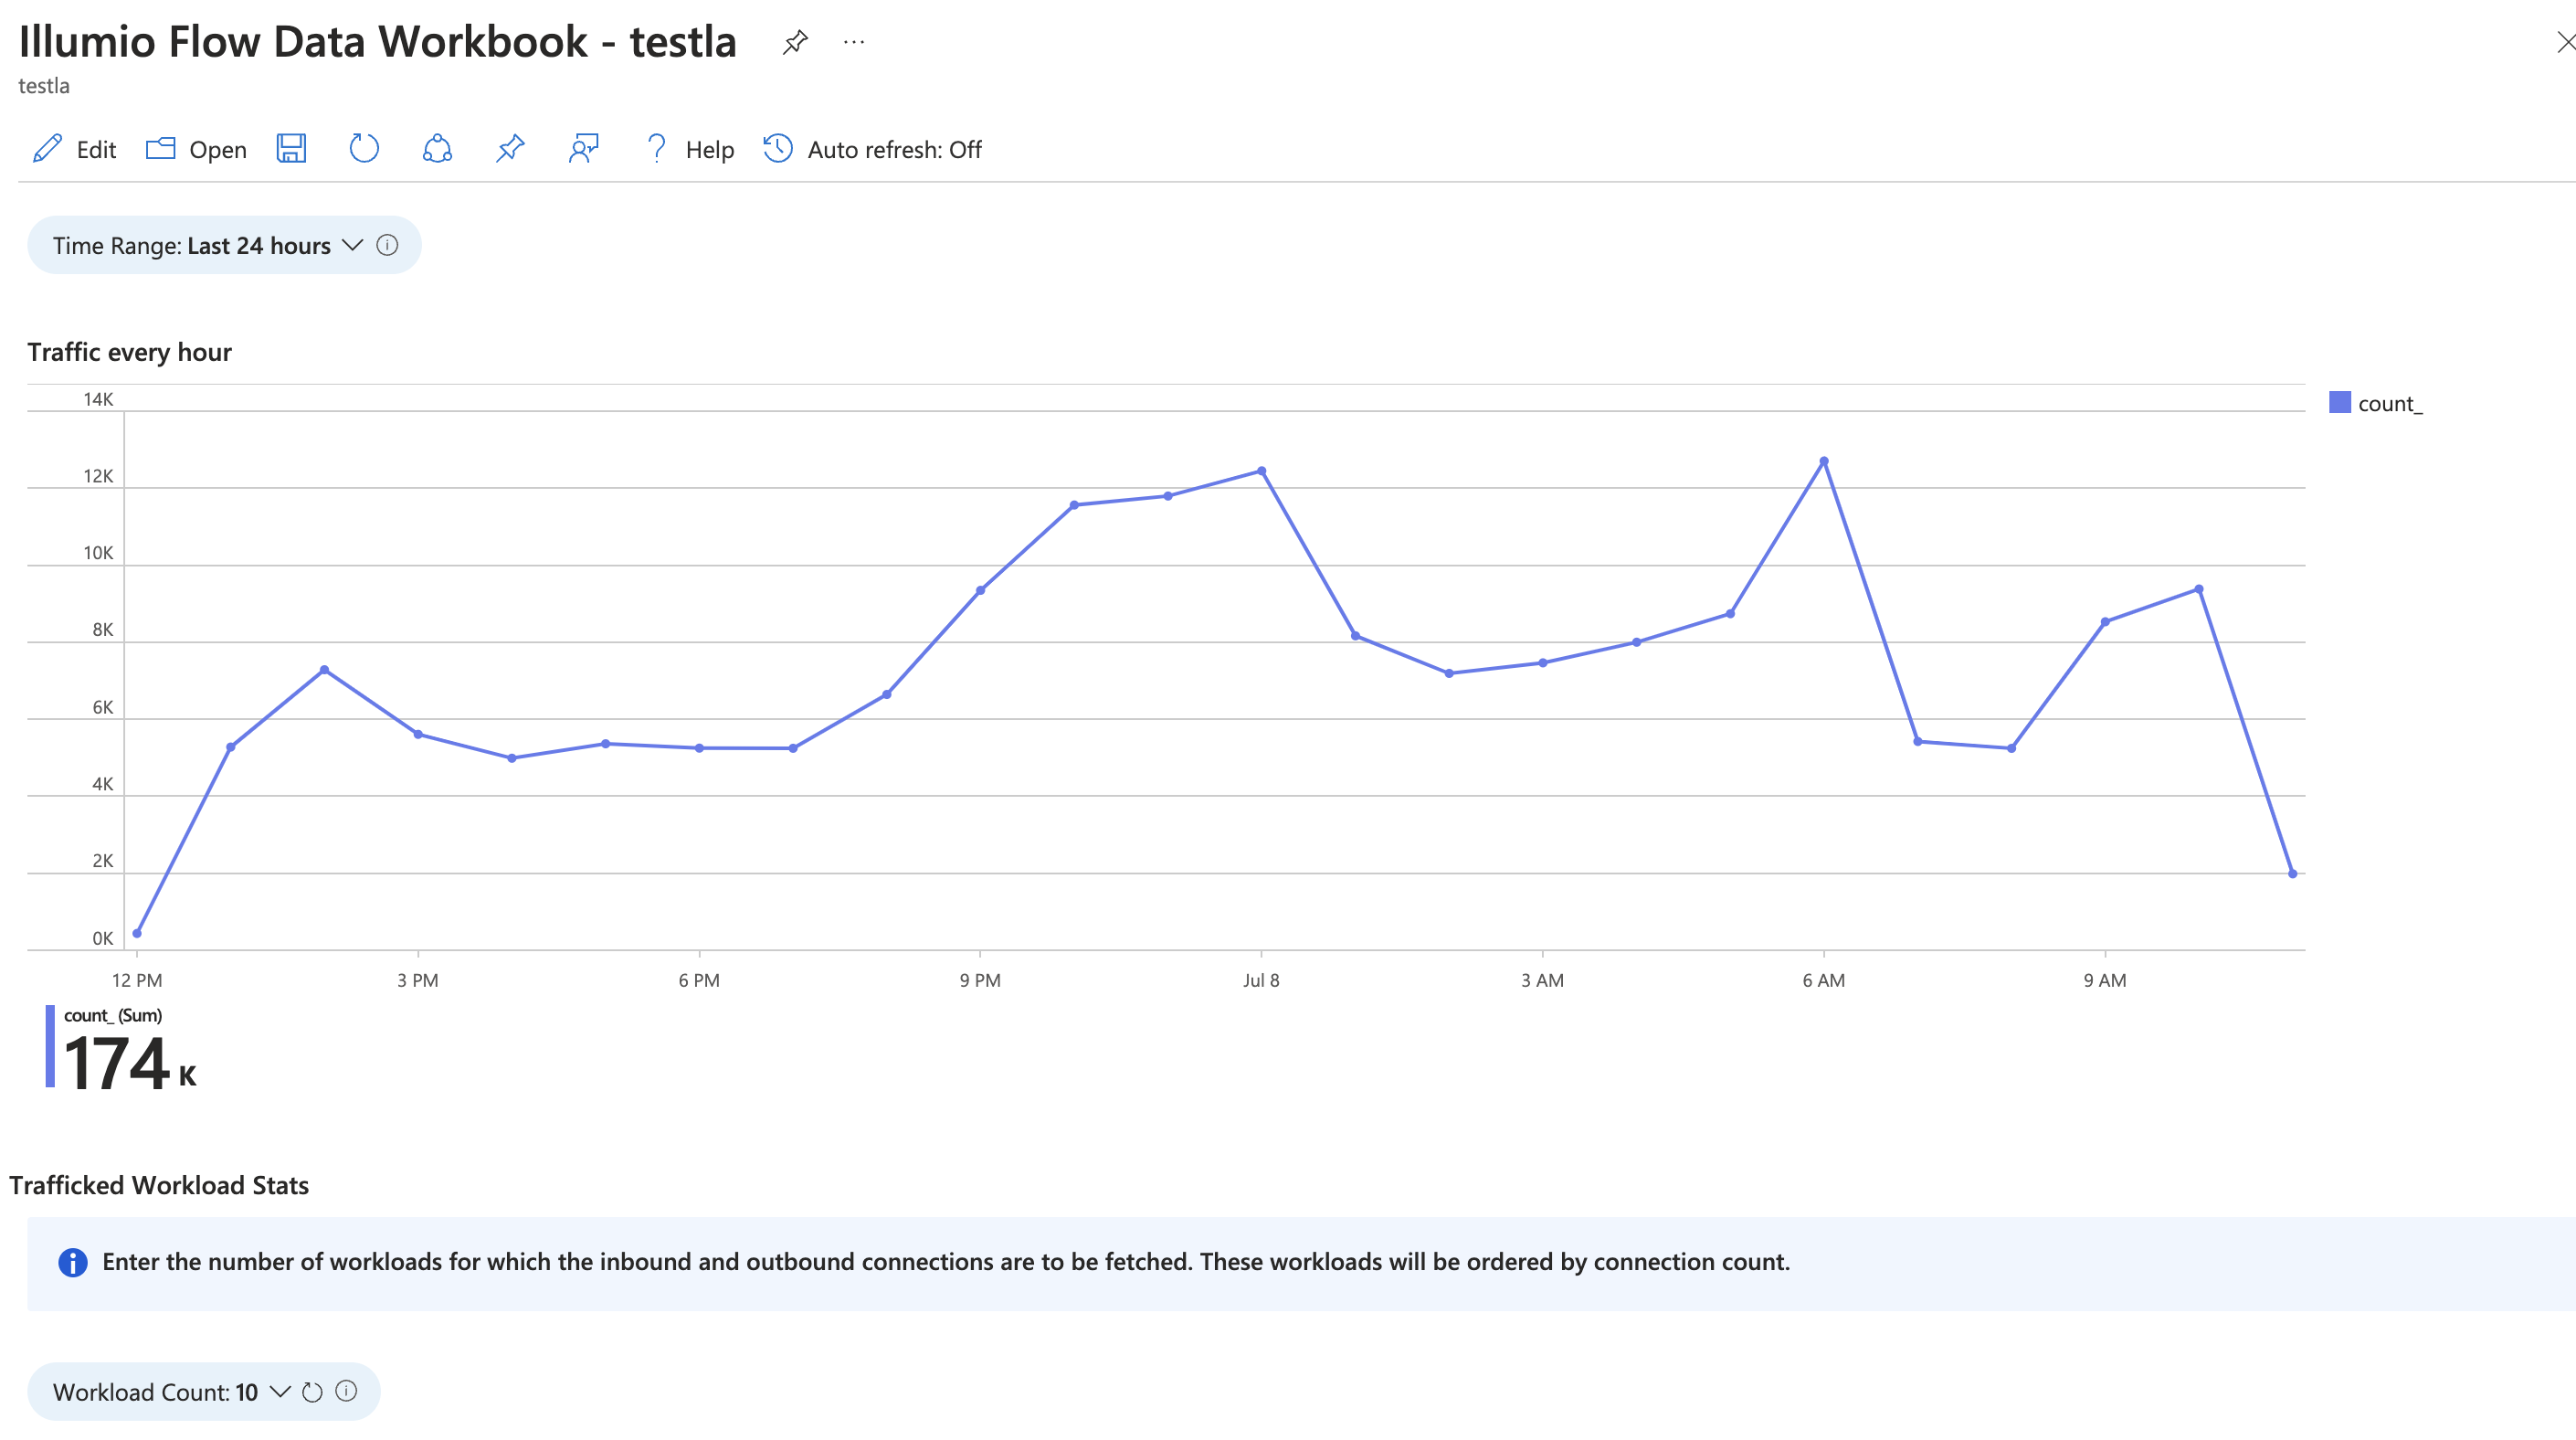
From the Time Range drop-down, select the time range for which you want to fetch the flows.
The Traffic every hour widget shows the trend of the number of connections and traffic every hour.
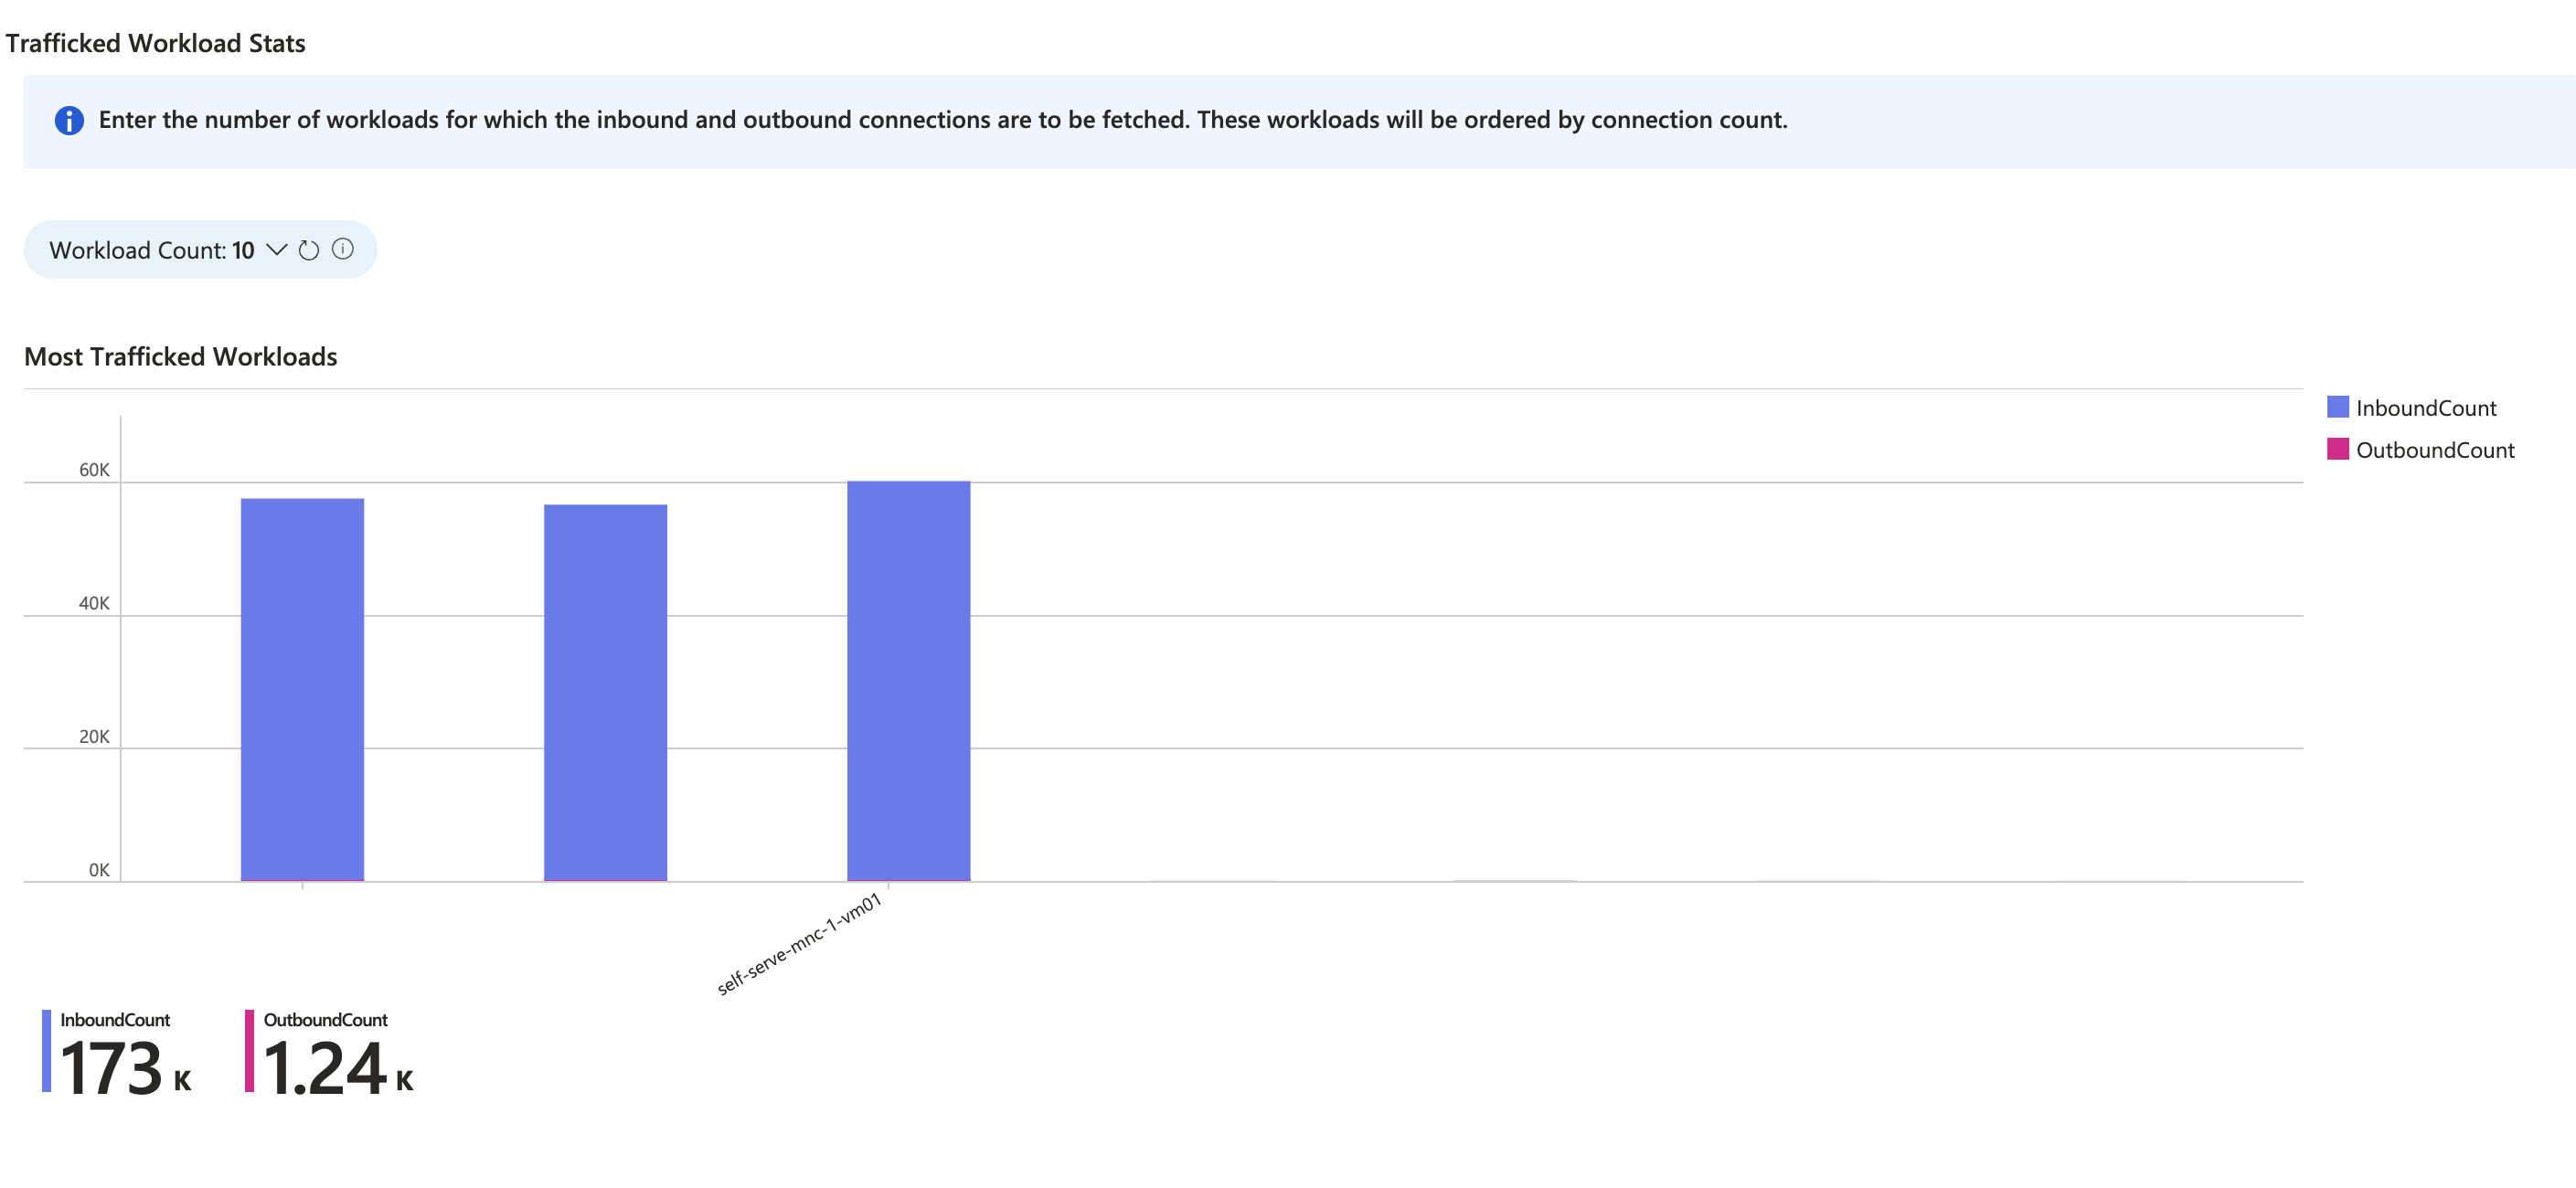
Trafficked Workload Stats: Enter the number of workloads for which the inbound and outbound connections are to be fetched. These workloads are ordered by the connection count.
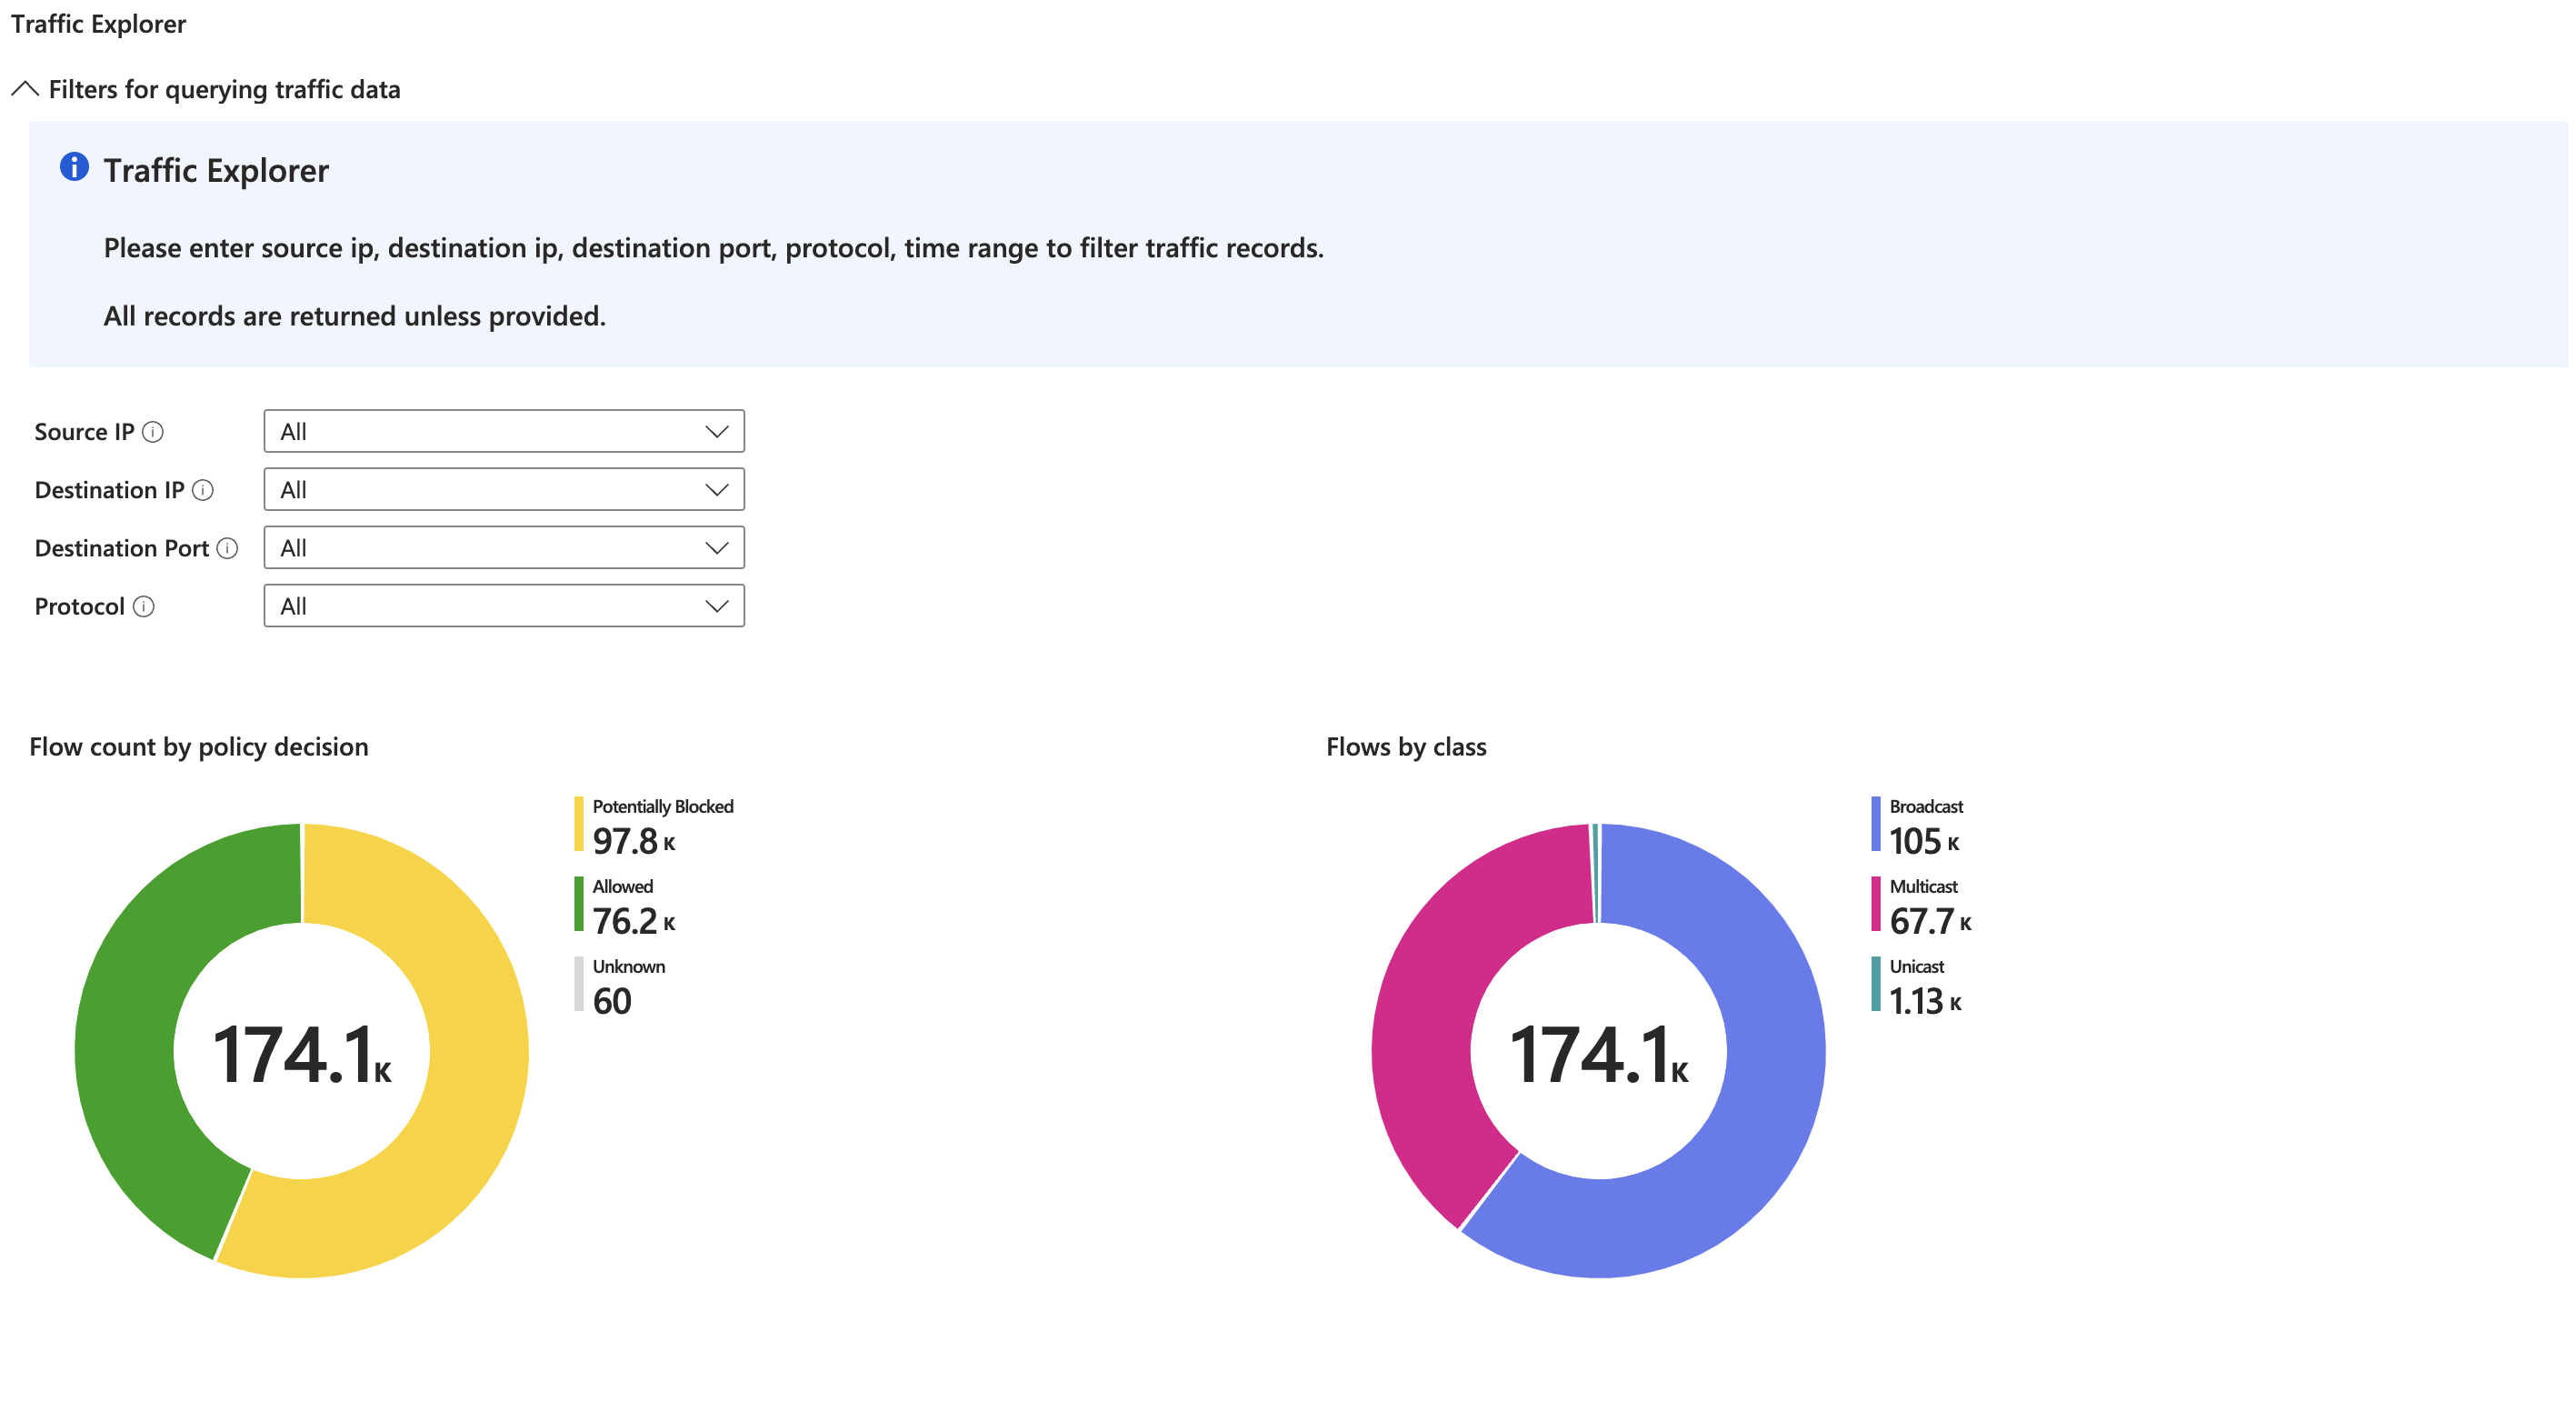
Traffic Explorer: This widget allows you to specify the Source IP, Destination IP, Destination Port, and Protocol. If you do not provide any inputs, by default all rows of traffic are fetched. However, if you do input values, the traffic that is fetched depends upon your input.
If you specify the Destination Port as 5353 and the protocol as 17, then the traffic rows that correspond to those values will be returned.
If you specify the Source IP as 10.6.0.2 and the Destination Port as 20000, then the traffic rows that correspond to this filter will be returned.
Flow Count by Policy Decision: This widget specifies the flow count by policy decision.
Flows by Class: This widget specifies the flow count by class, which is multicast, broadcast, or unicast.
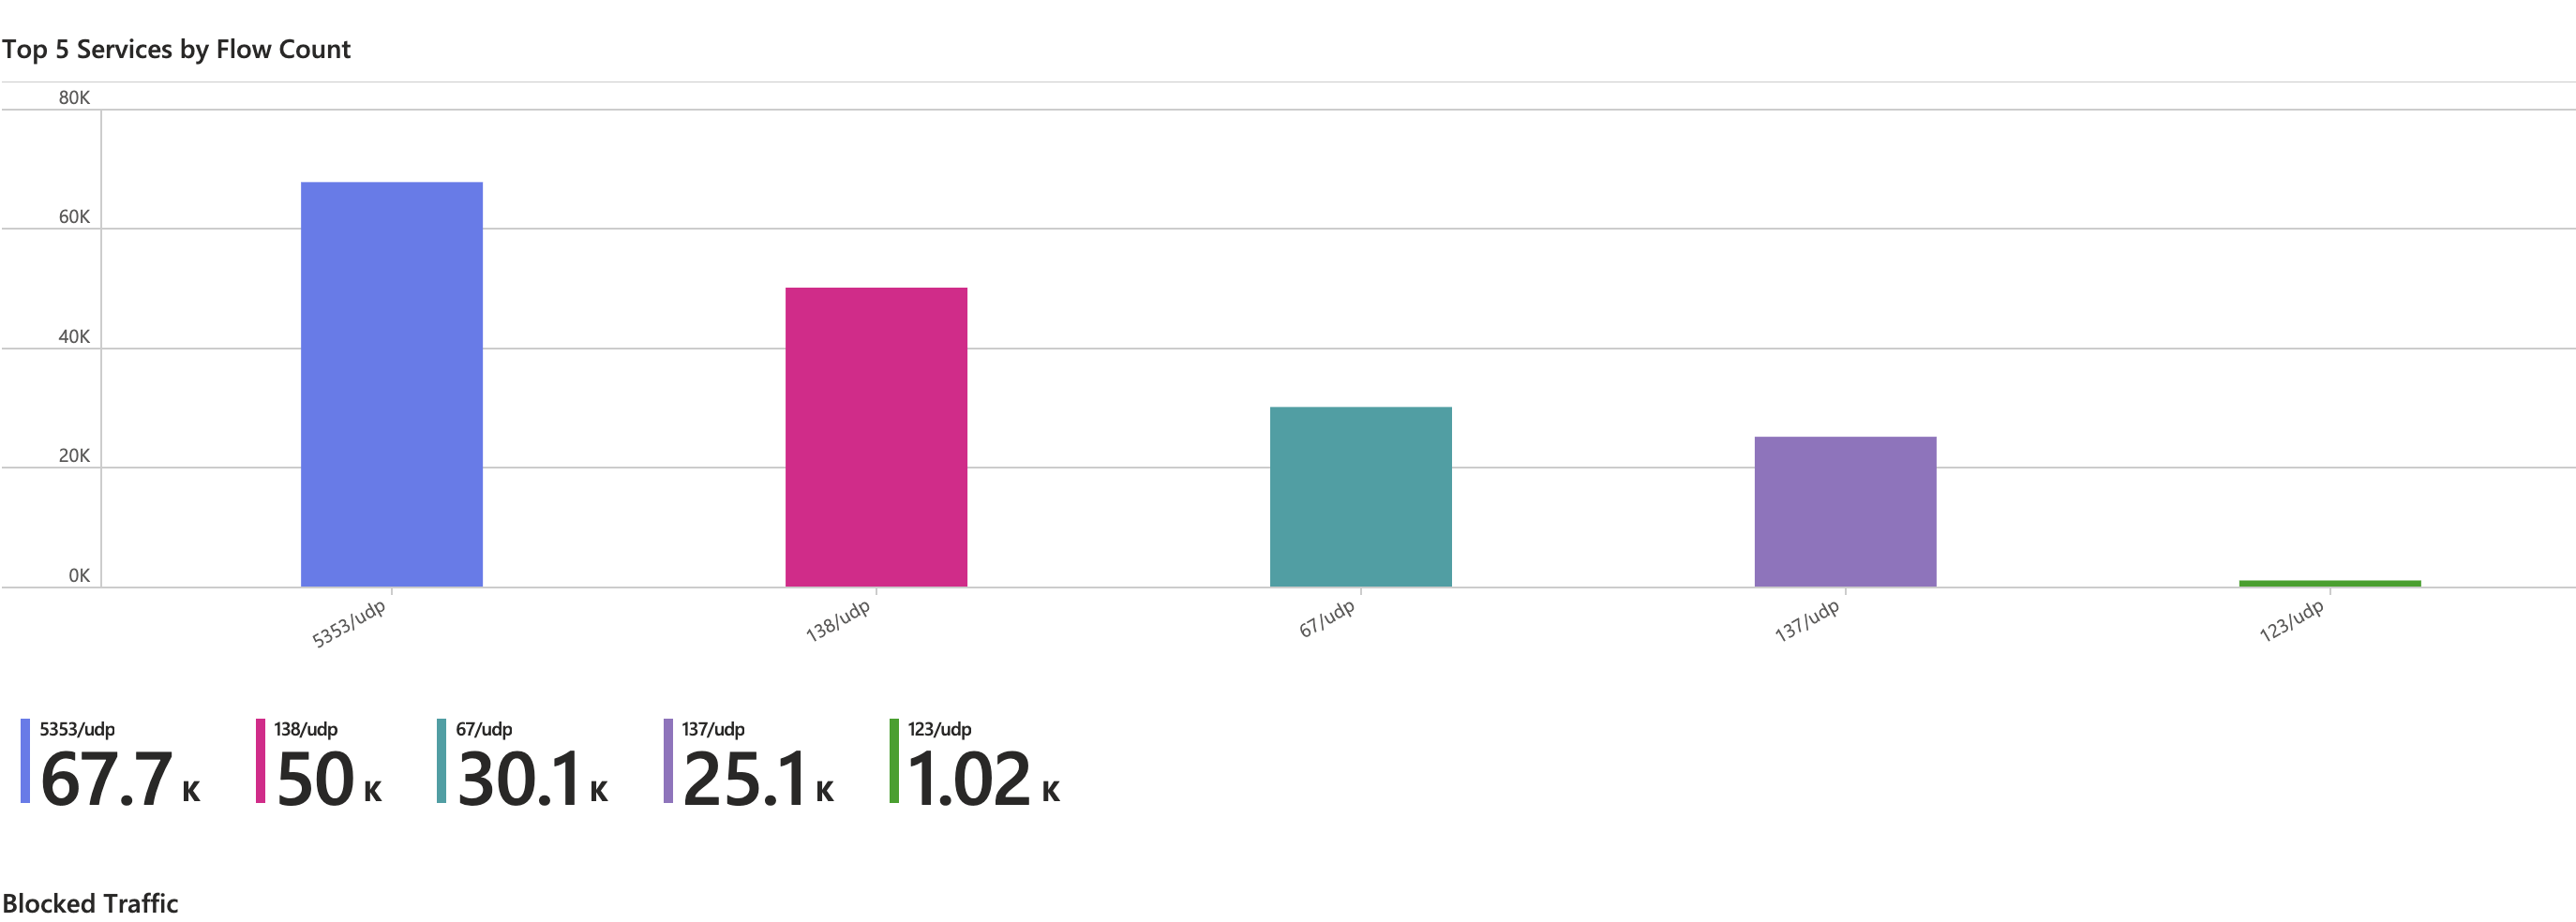
Top 5 Ports by Flow Count: This widget shows the top 5 ports by flow count.
Blocked Traffic: This table presents blocked traffic.
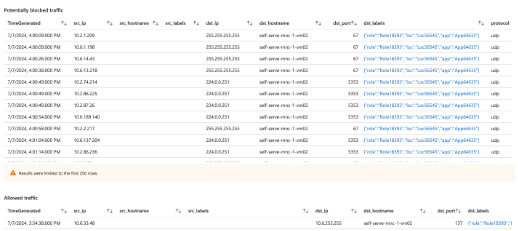
Allowed Traffic: This table presents allowed traffic.
Potentially Blocked Traffic: This table presents potentially blocked traffic.
Illumio Flow Data Workbook
Trafficked Workload Stats
Traffic Explorer
Top 5 Services by Flow Count
Traffic Stats