Usage Details
Drill into details of your usage by clicking the “Usage Details” button below the Summary.
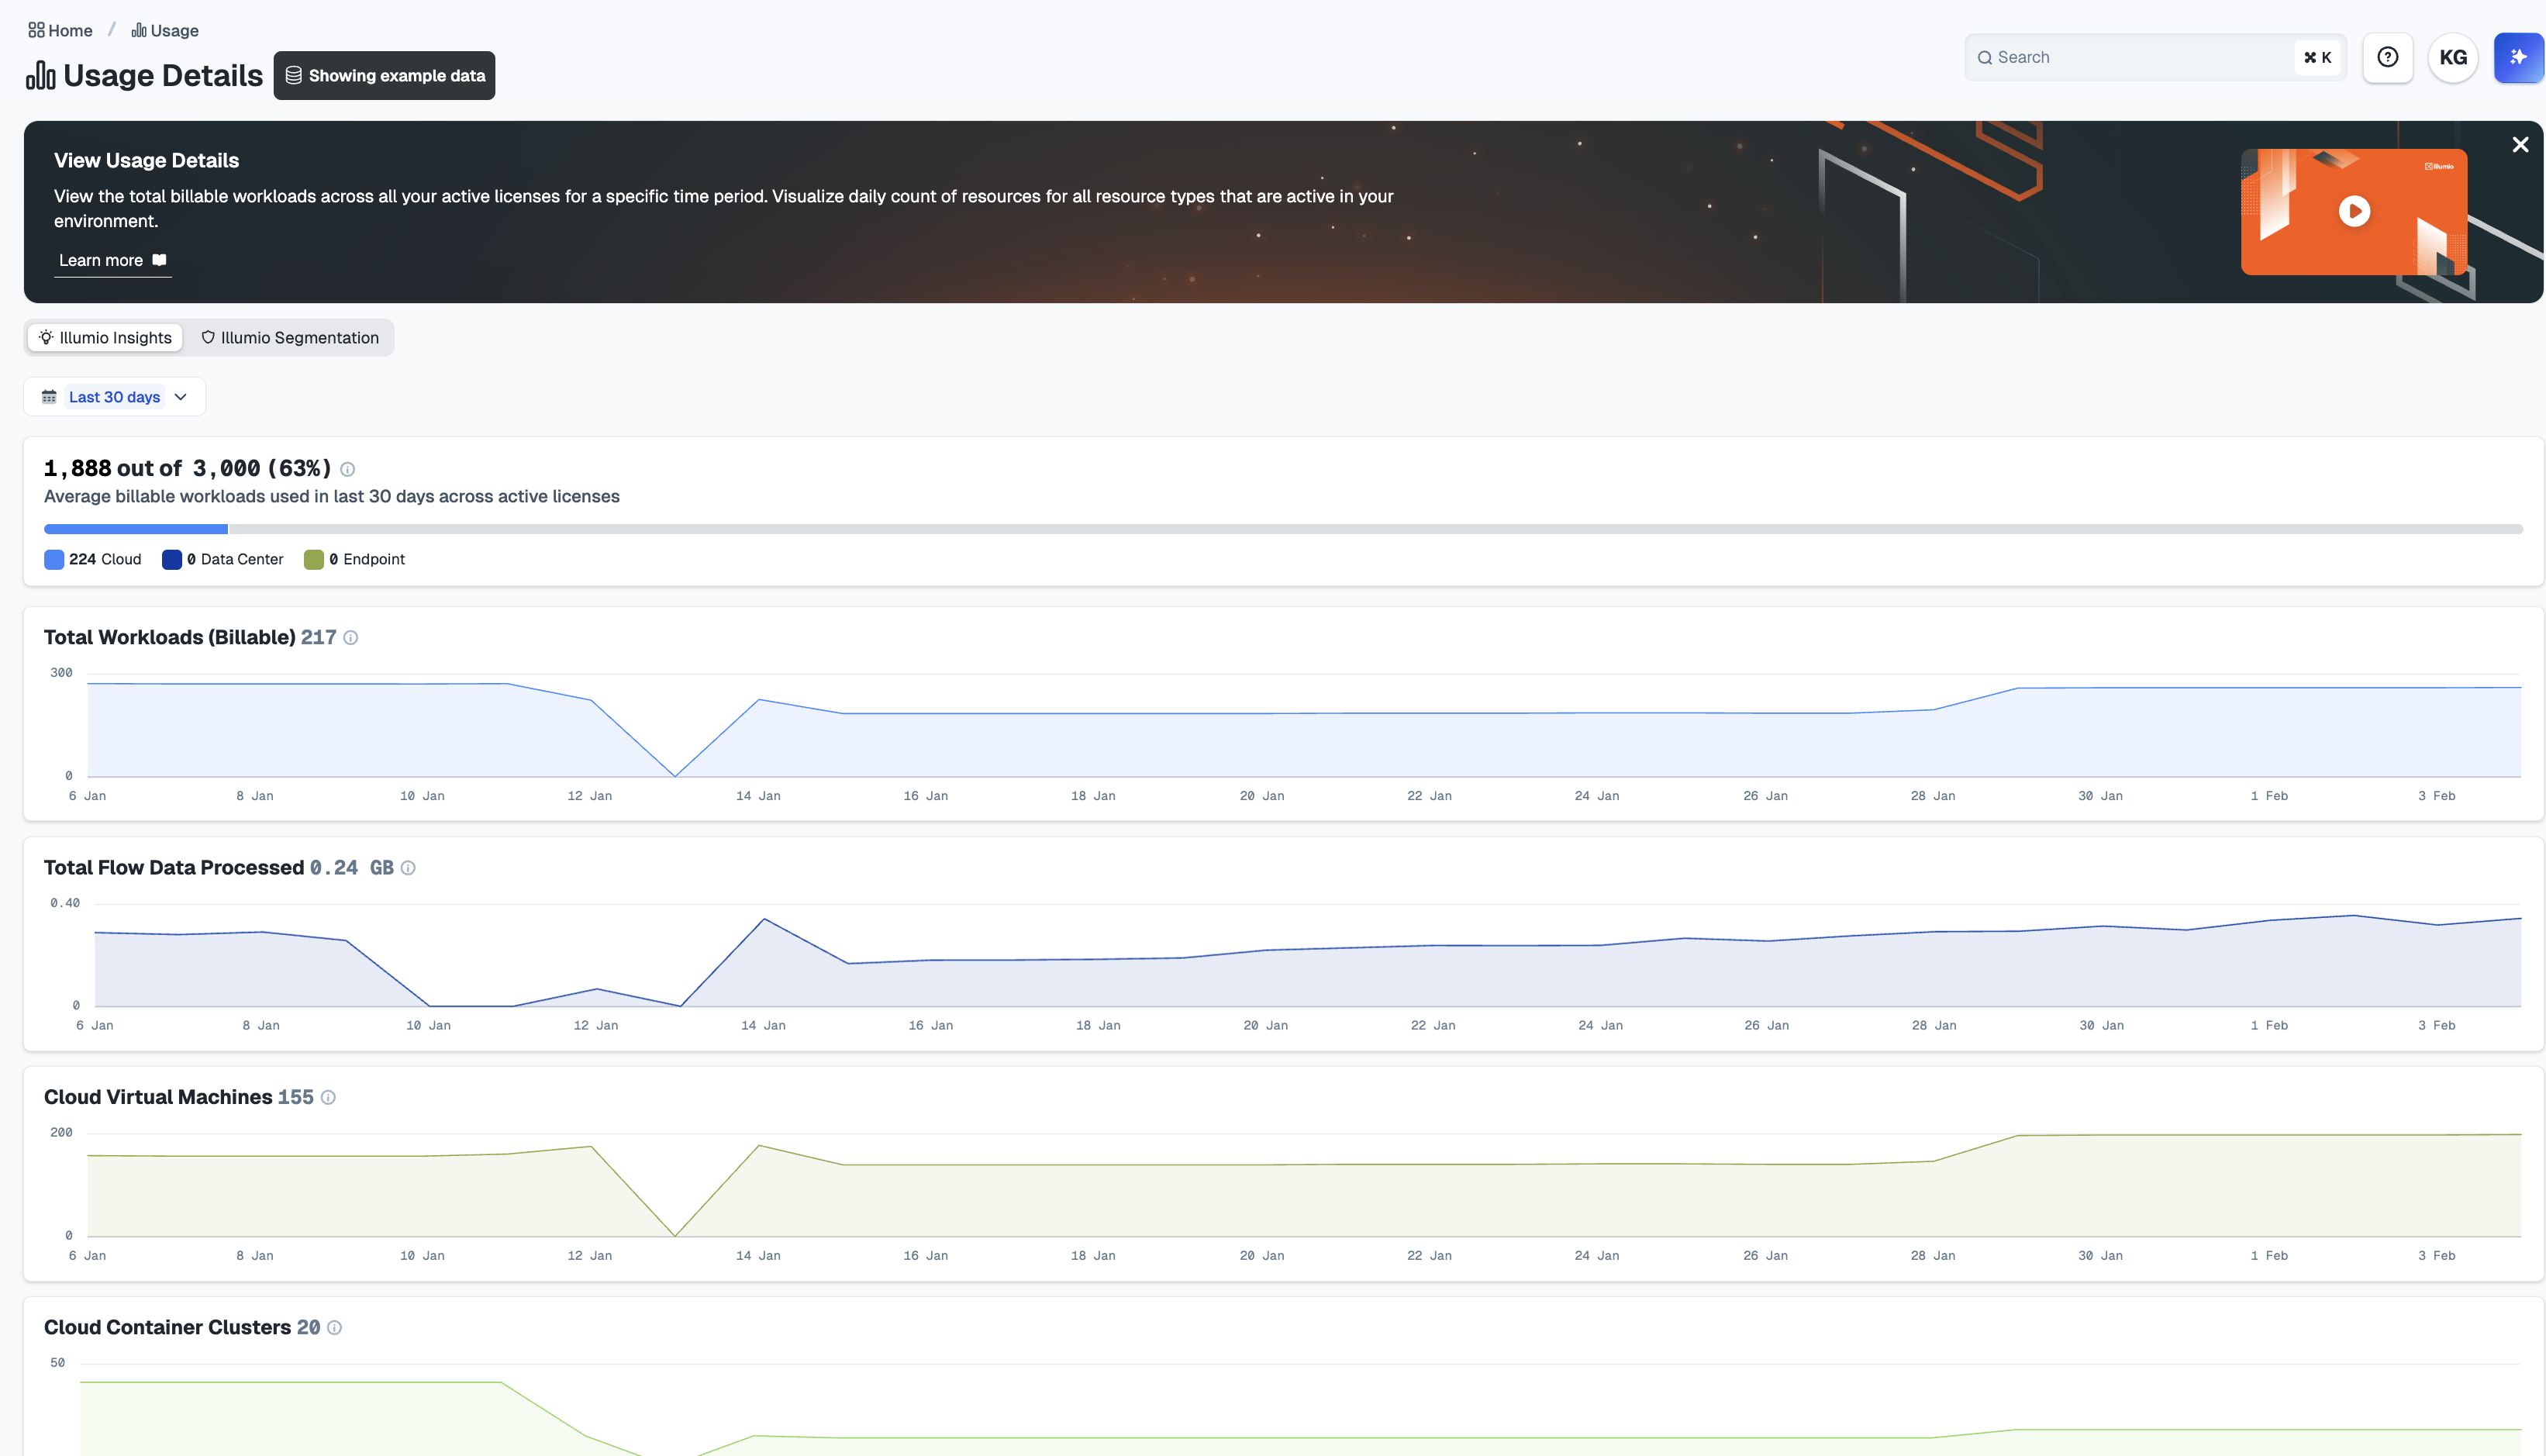
The Usage Details page displays graphs of daily usage based on the time range selected.
Total Workloads (Billable): The value next to the chart title represents the daily workload usage averaging across the time period you select. Move your cursor to a specific date on the chart to see the total number of workloads used on that date.
Total Flow Data Processed: The value next to the chart title represents the daily flow data processed averaging across the time period you select. Moving your cursor to a specific date on the chart gives you the total flow data processed on that date.
Resource Count: The remaining charts show the raw count for each resource type. These charts are automatically sorted by the resource type with highest workload consumption.
The value next to the chart title represents the daily resource count averaging across the time period you select. When you move your cursor to a specific date on the chart, you will see the average number of resources on that date.
View the Illumio Segmentation for Cloud usage details.
For a list of Resource Types and their definitions, see Illumio Workloads.