Dashboard overview
The Dashboard provides a quick way to understand your cloud presence at a glance.
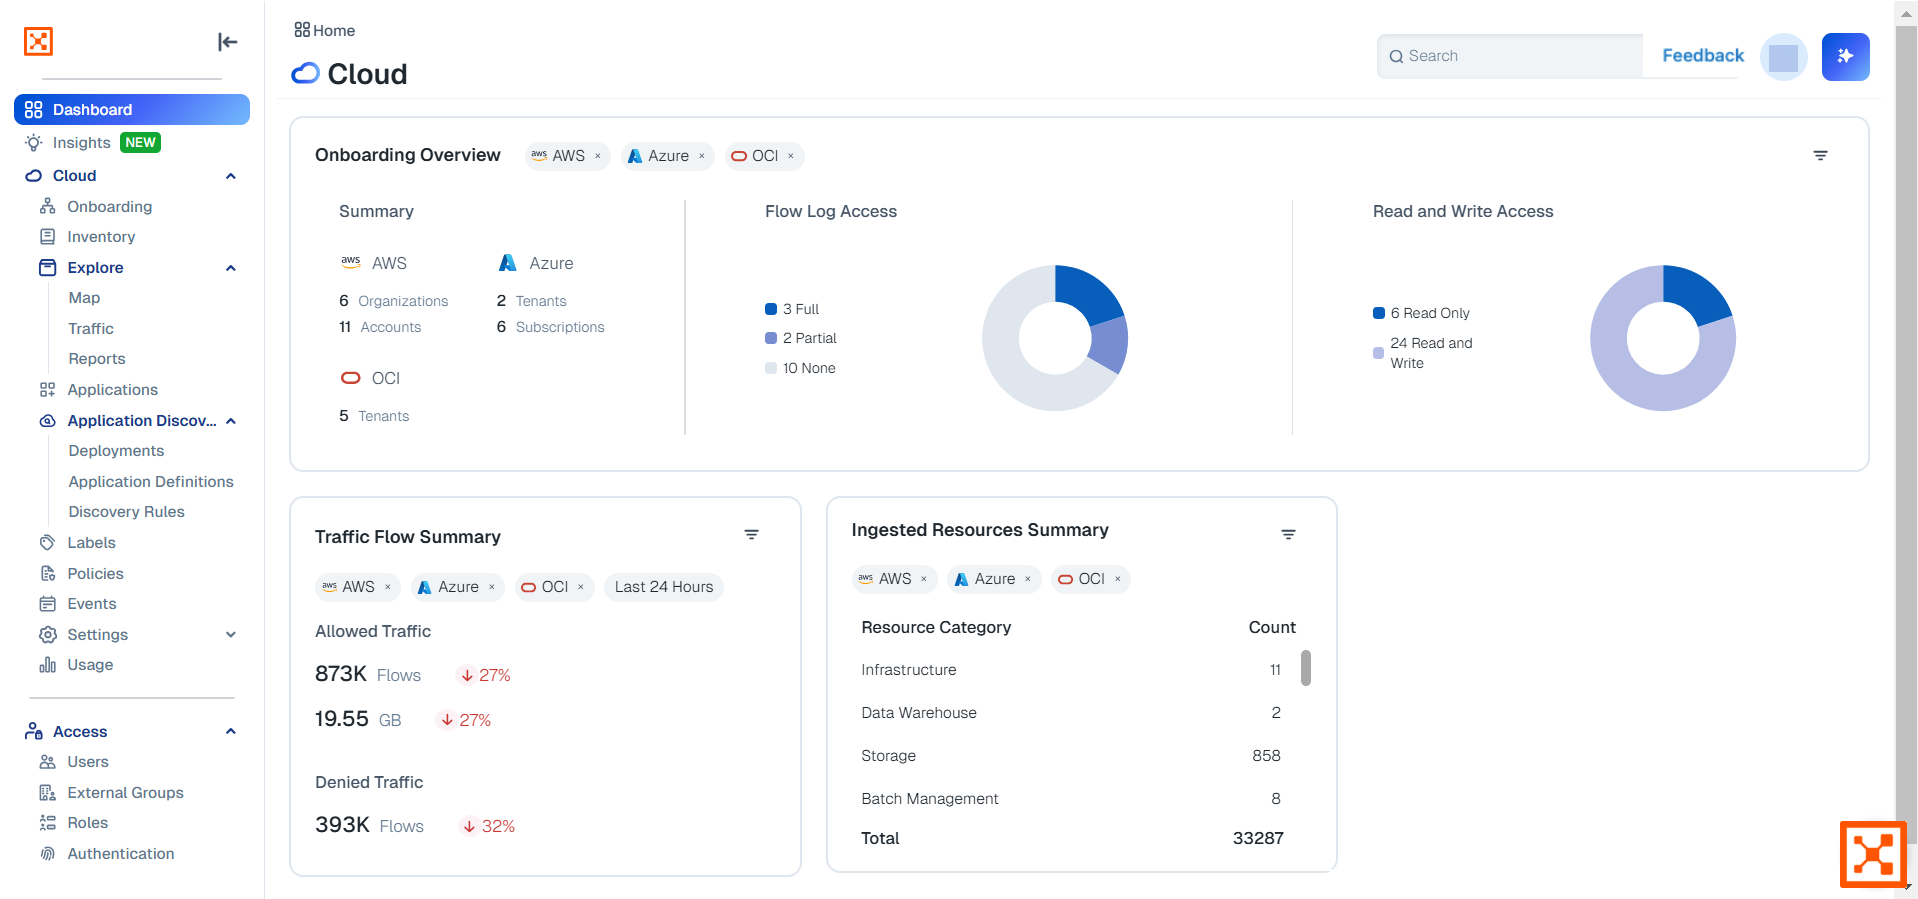
Click the Summary section to go to the Onboarding page and see the list of providers types along with additional details.
Click the Flow Log Access section to go to the Flow Log Access page. See Grant flow log access to your CSPs.
Click the Read and Write Access section to go to the Onboarding page and see the list of permissions
Click the filter icon in the upper right-hand corner to change the section's filters
Traffic Flow summary
This has two sub-sections, Allowed Traffic and Denied Traffic.
Click the count of Allowed Traffic to go to the Traffic page and see only flows with ALLOWED status within the selected time-frame
Click the count of Denied Traffic to go to the Traffic page and see only flows with DENIED status within the selected time-frame
Click the rest of the body of the section to go to the Traffic page and see every flow within the selected time-frame
Click the filter icon in the upper right-hand corner to change the section's filters. Note that when one single Cloud Service Provider (CSP) is specified, the CSP is also filtered in the Traffic page.
Summary of Ingested Resources
This includes Resource Category and Count, displaying resource types that support visibility.
Click the filter icon to change the section's filters, including CSPs and column sorting preferences. When one Cloud Service Provider (CSP) is specified, the CSP is also filtered in pages.
Click any item in the Resource Category column to see both billable and non-billable resources in the Inventory page:
The Count column for resources is static. It indicates the raw counts for the listed resource categories. These counts reflect the totals across all onboarded CSPs, even if you filter by CSP in the section. Hover over the numbers to see the percentage of the total that each represents.