Reading and Filtering the Global Map
This topic explains how to read and filter the Global Map. For background information, see Global Map.
Reading the Global Map Symbols
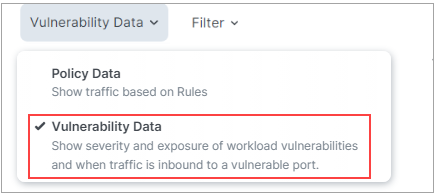
There are two legends for the side panel, one for Policy Data mode and another for Vulnerability Data mode. You can use the drop-down selector above the panel to switch between these modes.
Legend - Policy Data
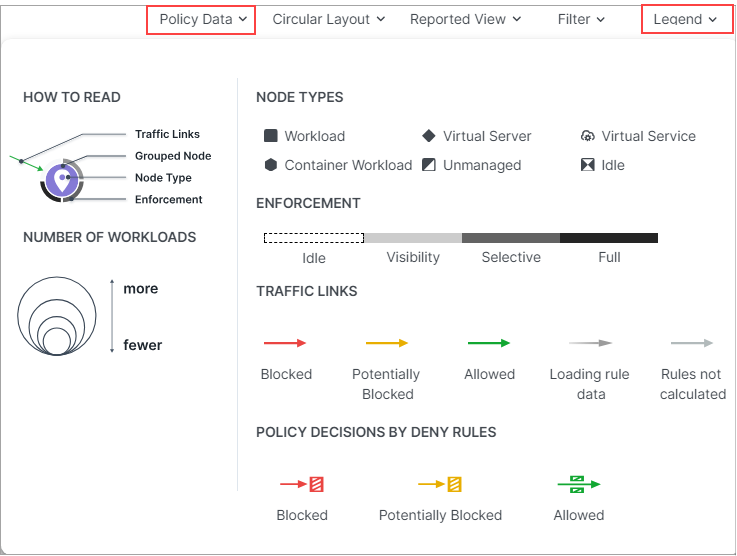
Symbols Explained
Number of Workloads (Policy Data and Vulnerability Data modes)
The relative size of each node indicates the number of workloads in the node.
Enforcement (Policy Data mode)
Pay attention to how the Map groups designate the enforcement mode for groups:
Workloads and groups inside fully dark lines are in FullEnforcement mode.
Workloads and groups inside semi-dark lines are in SelectiveEnforcement mode.
Workloads and groups inside light gray lines are in Visibility only mode.
Workloads and groups not surrounded by any of the above-described lines are in Idle mode.
The completeness of the ring around a group denotes the proportions of different enforcement states
As you navigate into the groups, you notice that the workloads also have borders indicating their enforcement modes.
Traffic Links (Policy Data mode)
Traffic links are presented with lines and arrows in different colors:
Red: Traffic is blocked
Yellow: Traffic is potentially blocked
Green: Traffic is allowed
Gradient arrows: The light color is next to the source and dark next to the destination. Gradient arrows are used while the rule data is still loading from the traffic.
Grey: Rules are not calculated
Reported View
The Illumio UI displays the traffic on the Global Map using red, orange, or green lines to indicate whether the workload had a rule that allows the traffic when the connection was attempted.
A green line indicates that the workload had an explicit rule to allow the traffic when the connection was attempted
A red line indicates that the workload did not have an explicit rule to allow the traffic when the connection was attempted
An orange line indicates that no explicit rule exists, but because of the enforcement state of the workloads the traffic is not blocked when provisioned.
Note
When a policy change occurs, only flows that are created after the policy change are displayed in red or green based on the new policy. Flows created before the policy change might continue to be displayed in red or green using the old policy.
If multiple rules allow traffic between entities, only one green line is displayed.
Rules created for existing or live traffic don't change the color of the traffic lines in the Reported view, even when they are provisioned, until new traffic is detected.
Draft View
This view also displays the traffic using red, green, and orange lines to indicate whether Illumio has a rule to allow the connection that was reported by the workload. This way, you can add rules and see their anticipated effect in real-time before the rules are implemented. In the Draft view , line colors have the following meanings:
A green line indicates that Illumio had an explicit rule (in either a draft or an active policy) to allow traffic when the connection was attempted.
A red line indicates that Illumio did not have an explicit rule (in either a draft or an active policy) to allow traffic when the connection was attempted.
An orange line indicates that no explicit rule exists, but because of the enforcement state of the workloads, the traffic will not be blocked when the rules are provisioned.
Filtering the Global Map
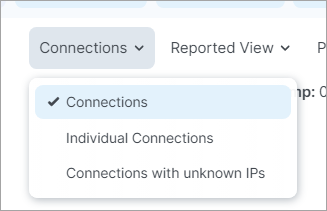
Connections Menu
When viewing the Traffic tab in on the Connections Menu allow you to view aggregated or individual connections.
Filter drop-down
Options in the Filter drop-down allow you to control which traffic information is displayed on the Global Map. This is useful for controlling the overall complexity of the visual information, making it easier to focus on the types of traffic you're interested in at any given time.
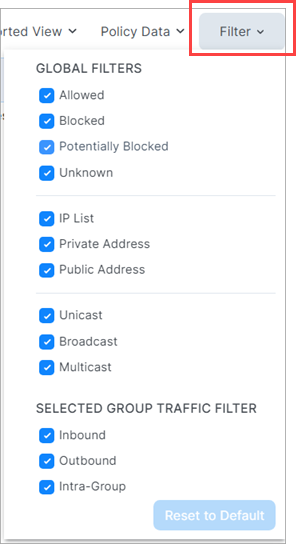
The Filter dropdown presents two types of filters:
Global Filters
These filters allows you to control the display of traffic for everything on the Global Map, whether selected or not.
Selected Group Filters
These filters allow you control the display of traffic only for the selected group on the Global Map.