Ransomware Protection Dashboard for Servers
In Illumio Core 23.2.0, a new dashboard gives you broad, visualized information about ransomware protection readiness, risk exposure, and protection coverage statistics.
Working with the Ransomware Protection for Servers Dashboard
You can access the Dashboard by clicking Dashboard in the left menu.
The new Ransomware Protection Dashboard is located above the VEN Dashboard.
In this release, only the following global user roles are allowed to use the Ransomware Protection Dashboard:
Global Org Owner
Global Administrator
Global Viewer
Only managed server workloads are included in the Dashboard statistics. Endpoints and container workloads are not included.
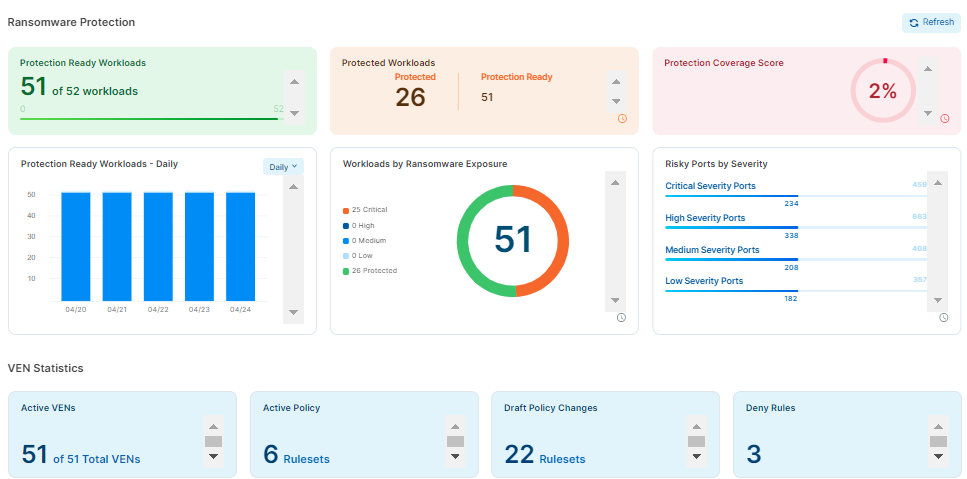
In the upper-right corner, you can see the Refresh button, which brings new fresh data from the system.

Four of the dashboard widgets are auto-refreshed at a regular interval and are not refreshed by the Refresh button. The last refresh time is indicated by the tool tip over the Clock icon.
Left Section of the Dashboard
The two widgets show the following stats:
Protection Ready Workloads
A workload is protection-ready when there is a VEN installed on the workload and can be configured to enforce Illumio security policies.
Users can optionally enter the target number of workloads requiring protection, which can be edited at any time. This widget indicates the number of such workloads compared to all available target workloads.
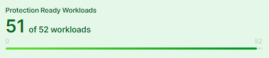
In the example above, 51 workloads are protection-ready.
Protection Ready Workloads (daily, weekly, monthly. quarterly)
This widget shows the number of Protection Ready workloads for a selected period of time.
In each of the selected views, the number of Protection-Ready Workloads is represented as a percentage of the available target workloads (100%).
The resolution might be Day, Week, Month, and Quarter.
Middle Section of the Dashboard
The middle sections shows the following stats:
Protected Workloads
A workload is protected when it has policies on all the ransomware risky services / ports and the policies are enforced: the workload has to be in Selective Enforcement or Full Enforcement mode.
Workloads by Ransomware Exposure
A workload is assessed according to its exposure to the services commonly exploited by ransomware. The risk of each service is classified into four severities: Critical, High, Medium, and Low.
A workload is protected for the service in these two cases:
The service is blocked by enforcement boundary in Selective Enforcement or
The workload is in Full Enforcement, whether there is rule or no rule for that service.
This widget shows the number of workloads by their ransomware exposure (Critical, High, Medium, Low, and Protected) across the organization.
Right Section of the Dashboard
The right section shows the following stats:
Protection Coverage Score
The Protection Coverage Score is a metric used to measure the effectiveness of security policies in protecting workloads. It indicates the percentage of the entire possible attack surfaces that are actively protected by security policies. For example, a policy that allows all workloads as source will have a lower coverage score compared to a policy that only allows a small number of source workloads.
Protection coverage score takes all the protection ready workloads into consideration across the organization.
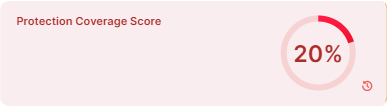
The color of the widget changes from red to yellow and then to green as the protection coverage score increases.
Risky Ports by Severity
This widget shows how many ransomware-risky ports, categorized by their severity (Critical, High, Medium, and Low) are in the system. Each category of ransomware-risky ports has a different total on each workload and hence across the system.
API Support for the Ransomware Protection for Servers Dashboard
The Dashboard uses several APIs to aggregate various data from the system and helps you focus on the data you are interested in.
The Dashboard is powered by the two main APIs: time_series and risk_summary.
For the complete list of REST APIs that are used to power the Ransomware Protetion Dashboard, see "Ransomware Protection Dashboard APIs" in the REST API Developer Guide.
View Workload Ransomware Protection for Servers Details
The Ransomware Protection tab provides detailed protection information for the workloads regarding each of the ransomware-risky services.
Information about the ransomware risk is then aggregated into the Ransomware Protection Dashboard for the system-side ransomware risk analysis.
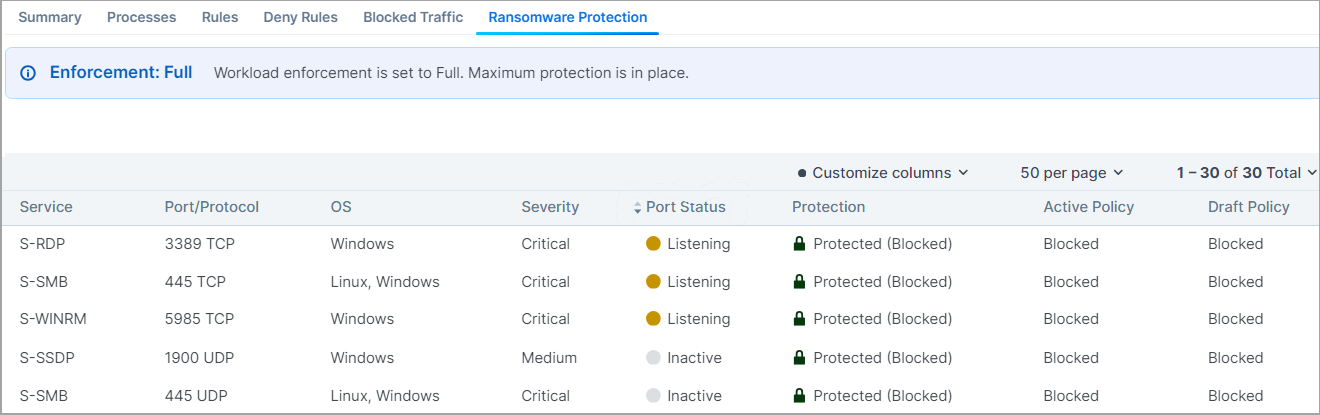
The Severity and Port Type are designated per each ransomware-risky service.
For more details, see "Services" in the Security Policy guide.
Here is the explanation for the data provided in the Ransomware Protection table:
Severity: Severity of the ransomware risk, which can be Critical, High, Medium or Low.
Port Status: Port status can be Active or Inactive.
Listening: Listening means there is a running process on that port.
Inactive: Inactive means there is no process running on the port. The same information is also provided on the Processes tab.
Port Type: The port type can be Admin or Legacy.
Admin: Admin refers to the service and ports are used for common administrative tasks.
Legacy: Legacy means that ports are used for legacy protocols.
Protection: Protection types are:
Protected (Blocked). When port is blocked by deny rules in Selective Enforcement or blocked with no allow rules in Full Enforcement. No ransomware can propagate through that port.
Unprotected The port is exposed to ransomware exploits.
Protected (Allowed by Policy). When there are allow rules intentionally policing the traffic. Only the trusted sources are allowed to access the port and hence the risk of lateral movement for ransomware is reduced. The workload has to be either in Selective Enforcement or Full Enforcement for the policy to be enforced.
The Port status does not affect the protection state.
Active Policy and Draft Policy: Indicates whether there is an Active or Draft policy to protect that particular port and the corresponding action.
Dashboard Access for Supercluster Users
Starting from the release 23.2.10, access to the Ransomware Protection Dashboard was extended to supercluster users in the following way:
- The Supercluster Leader is able to see the Ransomware Dashboard icon in the side menu and to visit dashboard page after clicking on it;
- Supercluster members are not able to see the Ransomware Dashboard icon in the side menu and have no access to the dashboard page.
- Both the Supercluster Leader and members can view the workload information in the workload page and the service page.