VEN Dashboard
Illumio provides a set of dashboard widgets to give you broad, visualized information about VEN statistics.
Working with the VEN Dashboard
You can access the Dashboard by clicking on the Dashboard button in the left menu.
The VEN Dashboard is located above the new Ransomware Protection Dashboard.
The Dashboard uses an API to aggregate various data from the system and helps you focus on the data you are interested in.
For more information about the API support, see "VEN Dashboard APIs" in the REST API Developer Guide.
In this release, only two user roles are allowed to use the VEN Dashboard:
Global Org Owners
Global Administrators
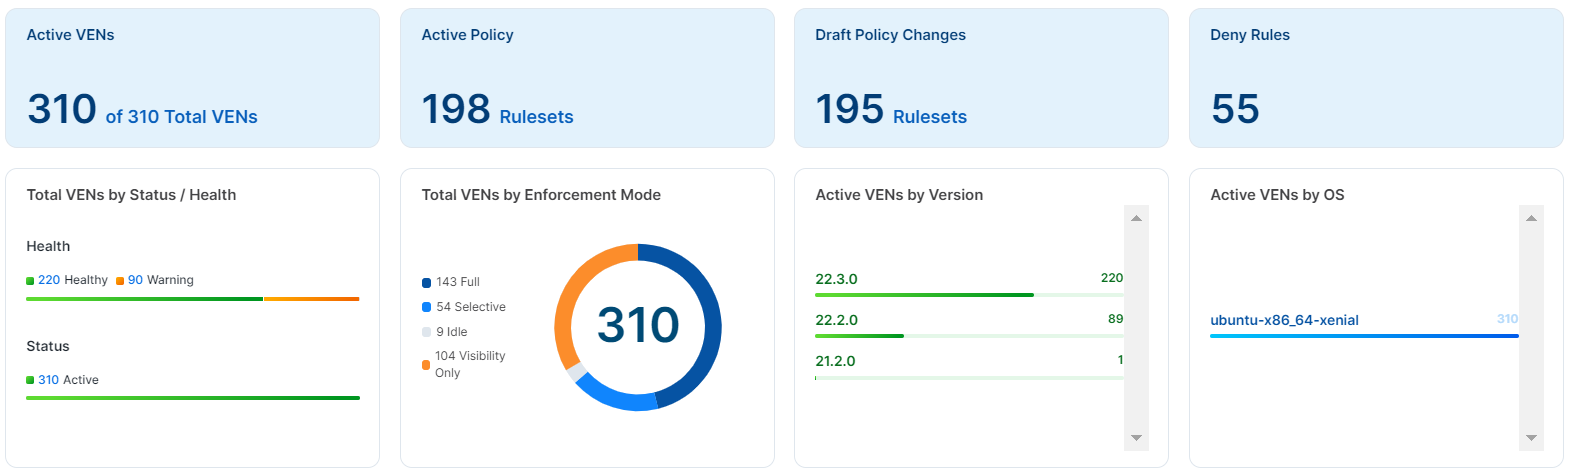
The VEN Statistics section of the Dashboard contains several widgets to display summary statistics or status. To get new fresh data, click the Refresh button at the top of the page. To see more details, click the widget, and the list page is displayed with the appropriate filter to see the resources.
The upper four sections show stats about:
Active VENs (how many VENs are active out of the total number of VENs)
Active Policy (number of rulesets)
Draft Policy Changes
Deny Rules
In the lower sections, the VEN Statistics part of the Dashboard includes the following widgets:
Total VENs by Status/Health
VEN counts by status (stopped, suspended, uninstalling, and active statuses)
VEN counts by health (error, warning, and healthy)
Total VENs by Enforcement Mode
VEN stats by enforcement mode: full, visibility only, idle, and selective enforcement.
Active VENs by Version
VEN stats by versions (number of VENs per version)
Active VENs by OS
VEN stats by currently employed versions (number of VENs per OS)