What's New and Changed in 23.5
The following new features were added in Illumio Core 23.5.
Policy Templates
Policy templates provide out-of-the-box, pre-filled policy definitions for some of the most popular security practices. Templates are provided to control inbound internet access, ransomware, inbound and outbound administrator access, Active Directory, and ICMP.
Ransomware Protection Dashboard Changes
New Widgets
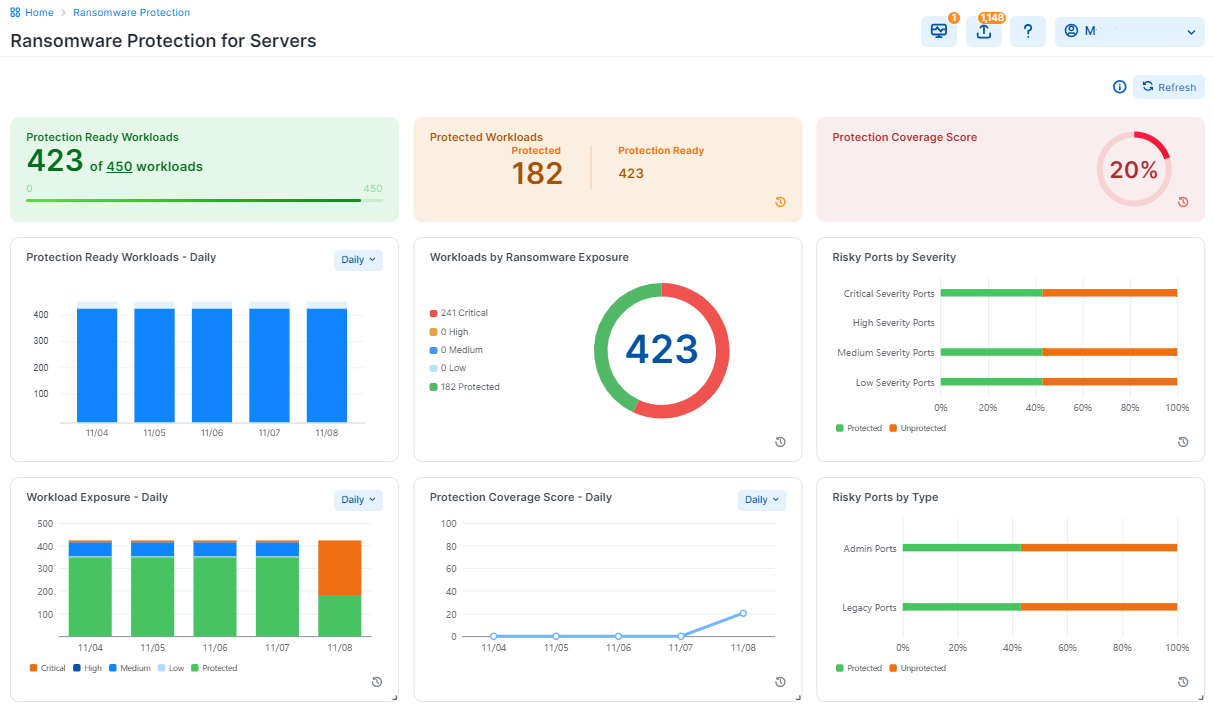
In Release 23.5, three new widgets have been added on the bottom of the Ransomware Protection Dashboard.
Workloads Exposure (Daily, Weekly, Monthly, Quarterly)
Workload Exposure widget shows, in percentages, how many of the existing workloads are protected from the ransomware vs. how many are still exposed. The unprotected workloads are further grouped in their exposure categories as Critical, High, Medium, and Low .
The exposure can be followed in time intervals: Daily, Weekly, Monthly, and Quarterly.
Protection Coverage Score (Daily, Weekly, Monthly, Quarterly)
The Protection Coverage Score is a metric used to measure the effectiveness of security policies in protecting workloads. It indicates the percentage of the entire possible attack surfaces that are actively protected by security policies. For example, a policy that allows all workloads as source will have a lower coverage score compared to a policy that only allows a small number of source workloads.
Protection coverage score takes all the protection-ready workloads into consideration across the organization.
The color of the widget changes from red to yellow and then to green as the protection coverage score increases.
Risky Ports by Type
This widget shows the percentage of risky ports by type: administrative vs. legacy ports.
Each port type is presented with a bar that depicts the percentage of protected (green) and unprotected (orange) ports.
To help visualize the protection coverage by port type, five percentage data points are used: 20%, 40%, 60%, 80%, and 100%.
Existing Widgets
In Release 23.5, some changes have been introduced for the existing Dashboard widgets:
Protected Workloads
For the widget Protected Workloads, a list of services that are at risk of ransomware penetration and lateral movement is provided to help customers assess ransomware exposure on their Enterprise Service.
Protection Coverage Score
For this widget, guidelines and an example are provided to help calculate exact protection coverage score for selective vs. full enforcement.
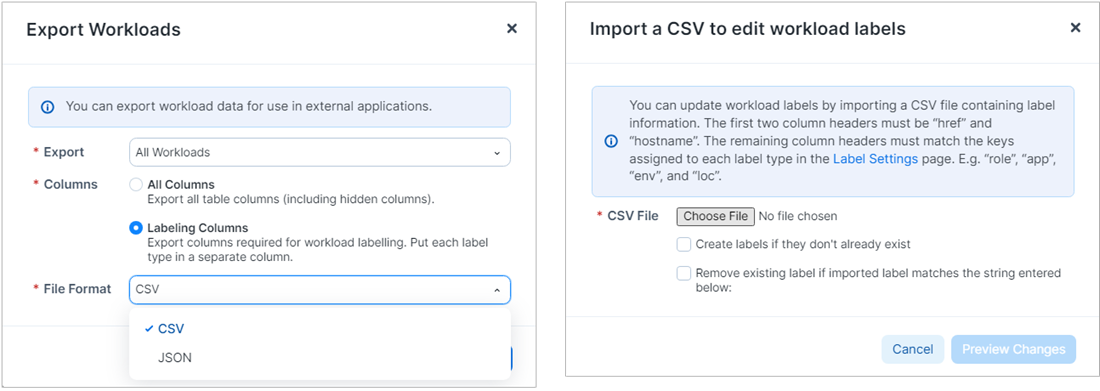
Bulk Export/Import of Workload Labels
The export/import feature on the Workloads page allows you to create, assign, change, and unassign workload labels in bulk. With the Export feature, the PCE creates and downloads a file for you. Alternatively, you can skip the Export step and prepare your own CSV file and then import your file to the PCE. Use the import feature to specify updates in a CSV file and then import those updates to the PCE.
Enhancements in the Visualization Tools
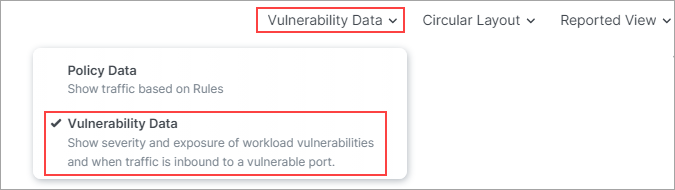
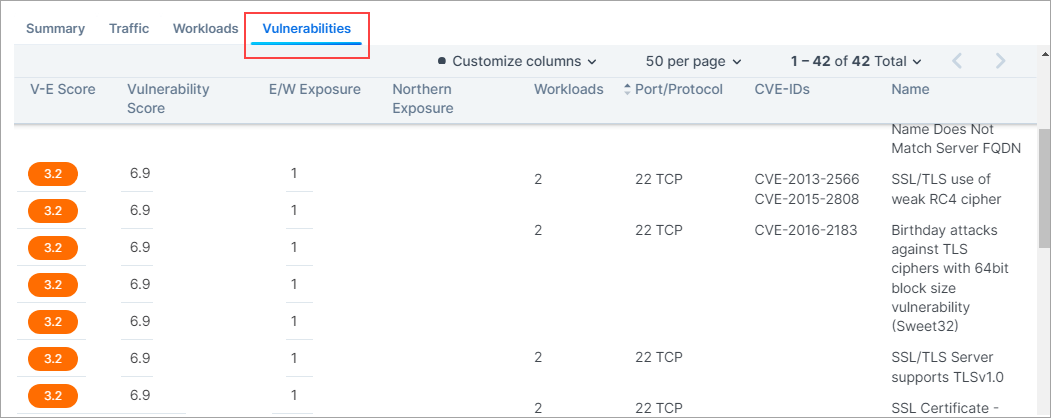
Vulnerability Data Option
If you're in Vulnerability Data mode on the Map, a Vulnerabilities Tab is available on the right panel that opens when you click on a group in the Map. The tab appears only if the group you're evaluating contains vulnerabilities.
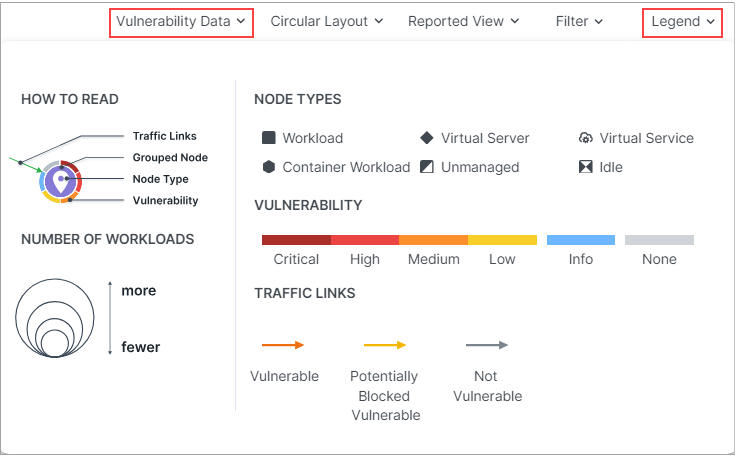
Legend for the New Vulnerability Data Option
The new Vulnerability Data option in the Map features a legend.
The relative size of each node indicates the number of workloads in the node.
The outer ring may be continuous or comprised of segments. The color of the segments shows the vulnerability level of workloads; segment sizes show the proportion of workloads assessed to be at the indicated vulnerability level.
The color of each Traffic Link indicates the link's level of vulnerability.
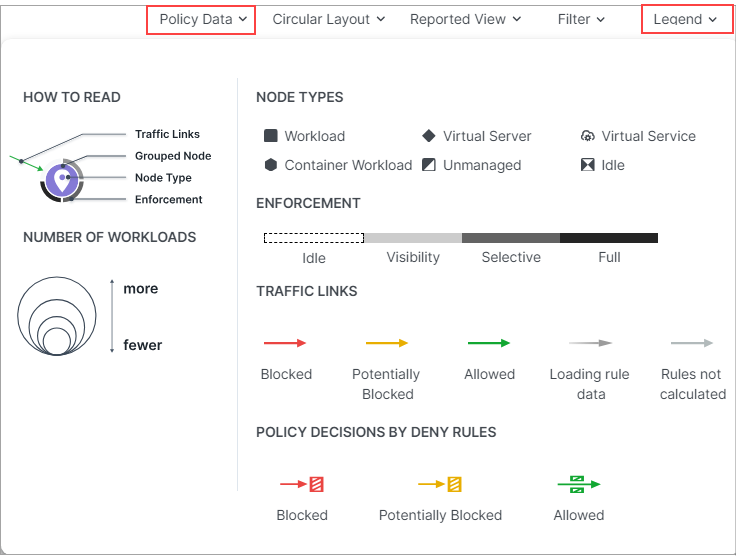
Updated Legend for the Policy Data option
The Policy Data option in the Illumination Map features an updated legend.
The relative size of each node indicates the number of workloads in the node.
The outer ring may be continuous or comprised of segments. The shade of the segments shows the enforcement level of workloads; segment sizes show the proportion of workloads under the indicated enforcement level.
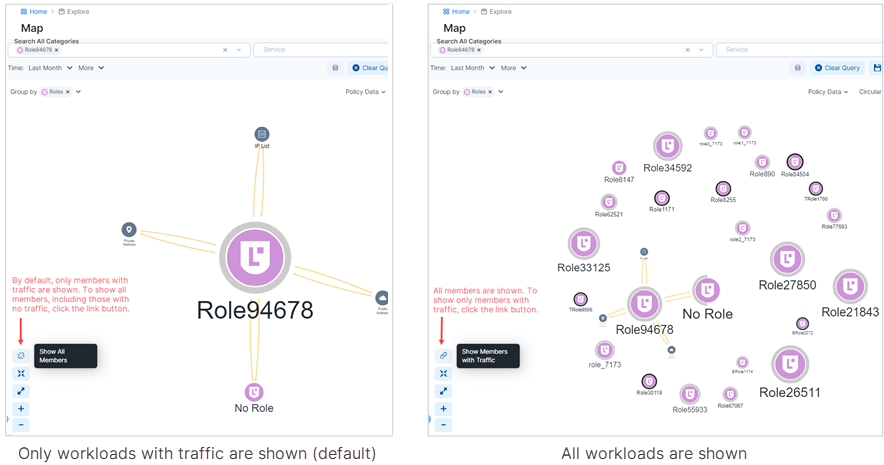
Show Members with No Traffic
Previously, running a query in the Map revealed only endpoints with traffic flows. A new feature redraws the map to reveal all endpoints, including those with no traffic.
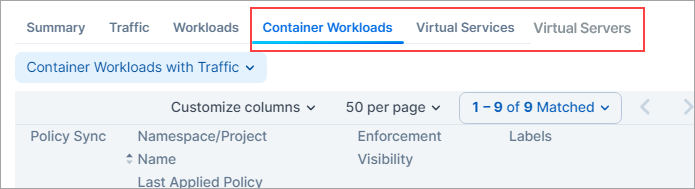
New Group Member Tabs
To help you evaluate and secure your traffic, three new tabs detailing additional group members are now available in the right panel that opens when you click on a group in the Map. The tabs appear only if the group you're evaluating contains the corresponding group members.
Container Workloads
Virtual Services
Virtual Servers
Windows Outbound Process: A New Object Type
In rulesets, you can now define and use a new type of object, a Windows outbound process. This provides visibility and policy enforcement at the source process level for granular control over the source traffic.
Limits on Flowlink Traffic Data
The PCE removes traffic flow data summaries (used by the Explore features in the PCE web console) when these conditions occur:
The disk size of the traffic flow summaries exceeds the disk space allocated for the data.
The traffic data database has been inactive for 90 days.
When Flowlink is used, the following limits apply on traffic data:
The default storage limit on traffic data from all of an organization's Flowlink servers is 500 MB.
The default storage size limit is based on the number of server VENs, endpoints, and container VENs. Kubelink flows (from container VENs) are grouped with server and endpoint flows.
When the storage limit or the 90-day limit is reached, traffic flow data is pruned. The order of pruning is first data from endpoints, then Kubelink, and lastly Server VENs.
Splunk Integration Version Upgrade
Splunk TA and app version 4.0.0 is now supported, including support for MT4L, multiple PCEs, multiple organizations, and faster search. Security operations personnel (SOC) can further enrich investigations and audits with Illumio data.
Traffic from Unpaired VENs
Traffic data for unpaired VENs can be seen by filtering on IP address. Get better visibility on unpaired VEN traffic for history and analysis.
Classic UI Removed
In Illumio Core 23.2.0, Illumio introduced a new PCE user interface (UI) designed to maximize user productivity and enable intuitive platform administration. Users had the option to toggle between the new UI and the earlier, classic UI. In 23.5.0, the toggle option is removed. The classic UI is no longer available.
There are two parts of the classic UI that are exceptions to this removal. The Explorer and Illumination Plus can be enabled with a setting in the user's Profile page.