Ransomware Protection for Servers Dashboard
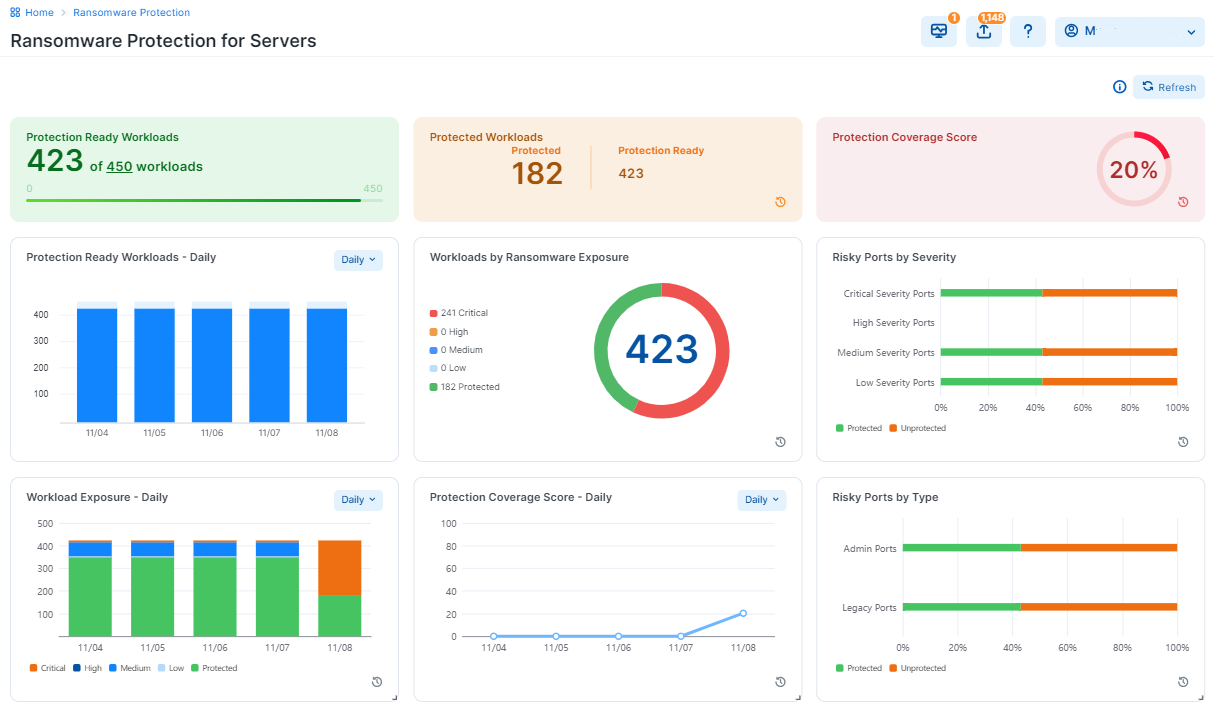
The Ransomware Protection dashboard gives you broad visual information about ransomware protection readiness, risk exposure, and protection coverage statistics.
About the Dashboard
You can access the Ransomware Protection Dashboard by selecting Dashboard-> Ransomware Protection in the left menu. It is located above the VEN Dashboard.
Dashboard Layout
The Dashboard consists of three columns and each of them contains three widgets.
Refreshing the widget information
The widgets that include small clock icons are auto-refreshed in regular time intervals of four hours.
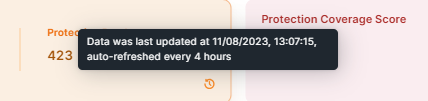
Click on the clock icon to learn about the auto-refresh schedule.
The widgets with no clock icons are refreshed when users click Refresh.

Widget color changes
Widgets change colors to show the percentage of the achieved coverage:
Red: indicates coverage between 0 and 50%
Yellow: indicates coverage between 50% and 80%
Green: indicates coverage between 80% and 100%
Getting more information from the Dashboard
Click Info (?) to learn about the Dashboard functions.
Widget Types
Widgets on the Dashboard belong to these four types:
Protection Readiness Widgets
These two widgets show the protection readiness:
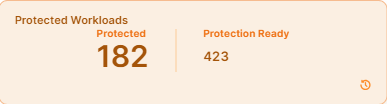
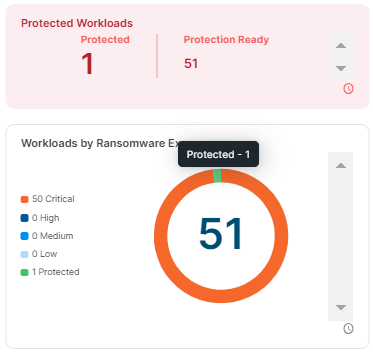
Protection Ready Workloads
A workload is protection-ready when there is a VEN installed on the workload and can be configured to enforce Illumio security policies.
Users can optionally enter the target number of workloads requiring protection, which can be edited at any time. This widget indicates the number of such workloads compared to all available target workloads.
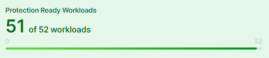
In the example above, 51 workloads are protection-ready. The widget has green color because the percentage of the protection-ready workloads is 98%.
Protection Ready Workloads (daily, weekly, monthly. quarterly)
This widget shows the number of Protection Ready workloads for a selected period of time.
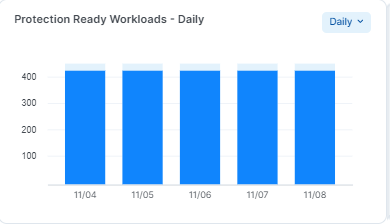
In each of the selected views, the number of Protection-Ready Workloads is represented as a percentage of the available target workloads (100%).
The protection readiness can be followed in time intervals: Daily, Weekly, Monthly, and Quarterly.
Workload Protection Exposure Widgets
These widget display information about the workloads protection exposure:
Protected Workloads
A workload is protected when it has policies on all the ransomware-risky services / ports and the policies are enforced.
The workload has to be in Selective Enforcement or Full Enforcement mode.
In this example, 182 workloads are protected out of 423 that are protection-ready. The percentage of protected workloads is 43%, hence the widget color is light red.
Ransomware-risky services
The list of services that are at risk of ransomware penetration and lateral movement is provided to help customers assess ransomware exposure on their Enterprise Services. All new organizations created after the release 23.2 have services created and tagged with the metadata as system default. Organizations created before the release 23.2 with services that have exact match of protocol and port numbers will be tagged with the ransomware risk metadata.
Customers should work with Illumio Support to review and revise their services objects to match the list below for accurate assessment.
Service | Service Name | Protocol | Port Number | Severity | Category | OS |
|---|---|---|---|---|---|---|
HTTP | S-HTTP | TCP | 80 | Medium | Legacy | Linux, Windows |
LLMNR | S-LLMNR | UDP | 5355 | Medium | Legacy | Linux, Windows |
NFS | S-NFS | TCP/UDP | 2049 | Medium | Admin | Linux |
RDP | S-RDP | TCP/UDP | 3389 | Critical | Admin | Windows |
MSFT RPC | S-RPC | TCP | 135 | Critical | Admin | Linux, Windows |
SMB | S-SMB | TCP/UDP | 445 | Critical | Admin | Linux, Windows |
SSH | S-SSH | TCP/UDP | 22 | Medium | Admin | Linux |
WinRM | S-WINRM | TCP | 5985 | Critical | Admin | Windows |
WinRM Secure | S-WINRM-SECURE | TCP | 5986 | Critical | Admin | Windows |
FTP Data | S-FTP-DATA | TCP | 20 | Medium | Legacy | Linux, Windows |
FTP Control | S-FTP-CONTROL | TCP | 21 | Medium | Legacy | Linux, Windows |
METASPLOIT | S-METASPLOIT | TCP/UDP | 4444 | Low | Legacy | Linux, Windows |
Multicast DNS | S-MDNS | UDP | 5353 | Medium | Legacy | Windows |
NetBIOS | S-NETBIOS | UDP TCP | 137, 138 137, 139 | High | Legacy | Windows |
POP3 | S-POPV3 | TCP | 110 | Low | Legacy | Linux, Windows |
PPTP | S-PPTP | TCP/UDP | 1723 | Low | Legacy | Linux, Windows |
SSDP | S-SSDP | UDP | 1900 | Medium | Legacy | Windows |
SunRPC | S-SUNRPC | TCP/UDP | 111 | Low | Legacy | Linux |
TeamViewer | S-TEAMVIEWER | TCP/UDP | 5938 | High | Admin | Linux, Windows |
Telnet | S-TELNET | TCP/UDP | 23 | Medium | Admin | Linux, Windows |
VNC | S-VNC | TCP/UDP | 5900 | High | Admin | Linux, Windows |
WSD | S-WSD | TCP/UDP | 3702 | Medium | Legacy | Windows |
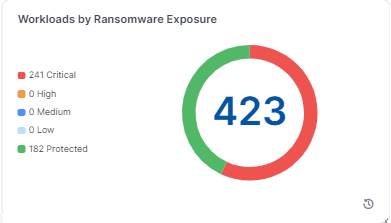
Workloads by Ransomware Exposure
This widget shows the number of workloads by their ransomware exposure (Critical, High, Medium, Low, and Protected) across the organization.
A workload is assessed according to its exposure to the services commonly exploited by ransomware. For a list of those workloads, see Ransomware-risky Services.
Protected workloads are presented in green.
For more details, see "Services" in the Security Policy Guide.
A workload is protected for the service in these two cases:
The service is blocked by enforcement boundary in Selective Enforcement or
The workload is in Full Enforcement, whether there is rule or no rule for that service.
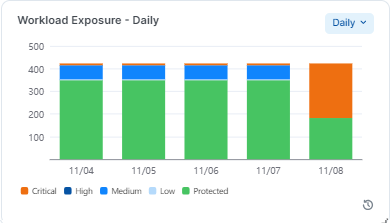
Workloads Exposure
The Workload Exposure widget shows, in percentages, how many of the existing workloads are protected from the ransomware vs. how many are still exposed. The unprotected workloads are further grouped in their exposure categories as Critical, High, Medium, and Low .
The exposure can be followed in time intervals: Daily, Weekly, Monthly, and Quaterly.
Protection Coverage Widgets
Protection Coverage Score
The Protection Coverage Score is a metric used to measure the effectiveness of security policies in protecting workloads. It indicates the percentage of the entire possible attack surfaces that are actively protected by security policies. For example, a policy that allows all workloads as source will have a lower coverage score compared to a policy that only allows a small number of source workloads.
Protection coverage score takes all the protection-ready workloads into consideration across the organization.
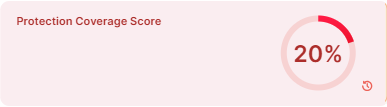
The color of the widget changes from red to yellow and then to green as the protection coverage score increases.
The widget above is red, because the protection coverage score is 20% or lower than 50%.
Table for 10 total address spaces:
Enforcement Mode | Policy | blocked_peer_set_count | Coverage % |
|---|---|---|---|
Selective Enforcement | No deny or allow | 0 | 0% |
allow (no deny) | 0 | 0% | |
Deny | 10 | 100% | |
Deny and allow | 5 | 50% | |
Full Enforcement | No allow rules | 10 | 100% |
Allow | 5 | 50% |
Weight assigned for protection coverage score
Protection | Weight assigned |
|---|---|
Critical | 40 |
High | 30 |
Medium | 20 |
Low | 10 |
Coverage score example
Protection coverage score calculation for four ports
Ports | Policy | Idle | Visibility | Selective Enforcement | Full Enforcement | |||||
|---|---|---|---|---|---|---|---|---|---|---|
SMB | S-SMB | TCP | 445 | Critical | 40 | No rules | Unprotected | Unprotected | 0 | 100% |
VNC | S-VNC | TCP | 5900 | High | 30 | Deny rules | Unprotected | Unprotected | 100% | 100% |
POP3 | S-POPV3 | TCP | 110 | Low | 10 | Allowed rules | Unprotected | Unprotected | 0 | 50% |
FTP Data | S-FTP-DATA | TCP | 20 | Medium | 20 | Deny rules and allow rules | Unprotected | Unprotected | 50% | 50% |
Protection Coverage Score | 0% | 0% | 40% | 85% | ||||||
According to the table above, here is how the protection coverage was calculated:
Selective Enforcement = ( 40 * 0 + 30 * 100% + 10 * 0 + 20 * 50%) / (40+30+10+20) = 40%
Full Enforcement = ( 40 * 100% + 30 * 100% + 10 * 50% + 20 * 50%) / (40+30+10+20) = 85%
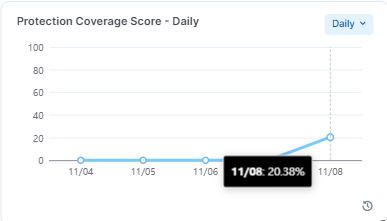
Protection Coverage Score over Time
This widget displays the percent of the ransomware protection coverage over a time period, which can be viewed as Daily, Weekly, Monthly and Quarterly. In each case, it displays the last datapoint of the period.
To help visualize the protection coverage trends, five percentage data points are used: 20%, 40%, 60%, 80%, and 100%.
When users move the cursor over the widget, the pop-up shows the percentage for the ransomware protection for a selected period:
Risky Ports Widgets
These two widgets give ire details about risky ports in the system.
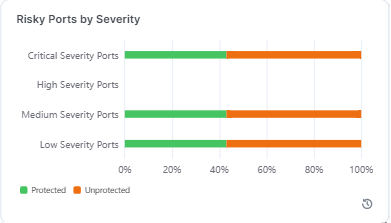
Risky Ports by Severity
This widget shows how many ransomware-risky ports, categorized by their severity (Critical, High, Medium, and Low) are in the system. Each category of ransomware-risky ports has a different total on each workload and hence across the system.
To help visualize the protection coverage by severity, five percentage data points are used: 20%, 40%, 60%, 80%, and 100%.
Risky Ports by Type
This widget shows the percentage of risky ports by type: administrative vs. legacy ports.
Each port type is presented with a bar that depicts the percentage of protected (green) and unprotected (orange) ports.
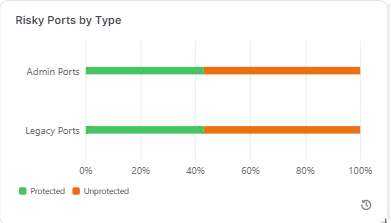
To help visualize the protection coverage by port type, five percentage data points are used: 20%, 40%, 60%, 80%, and 100%.
Using the Dashboard
Who can use the Dashboard
The following global user roles are allowed to use the Dashboard:
Global Org Owner
Global Administrator
Global Viewer
What is Included in Dashboard Statistics
Only managed server workloads are included in the Dashboard statistics. Endpoints and container workloads are not included.
Shortcuts for Working with the Dashboard
Use these shortcuts to the Workloads page from in the Dashboard.
Go to Protected Workloads -> Workloads by Ransomware Exposure and click anywhere on the pie chart where you want to see the detailed information, such as on the Protected segment (in green):
Right-click on the selected segment.
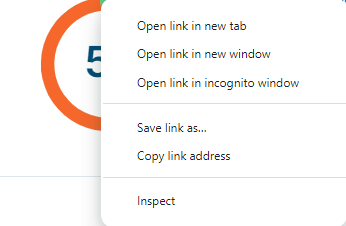
Several options will be available.
Choose "Open link in new window":
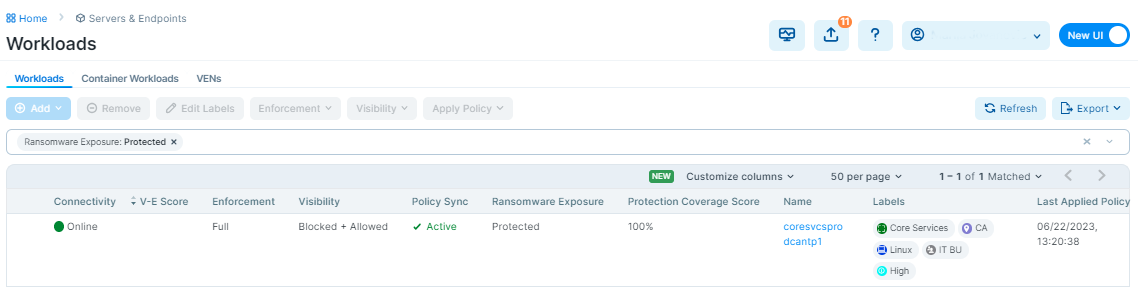
The Workloads page with the one workload that was 100% protected for the ransomware exposure is displayed.
Workload Ransomware Protection for Servers Details
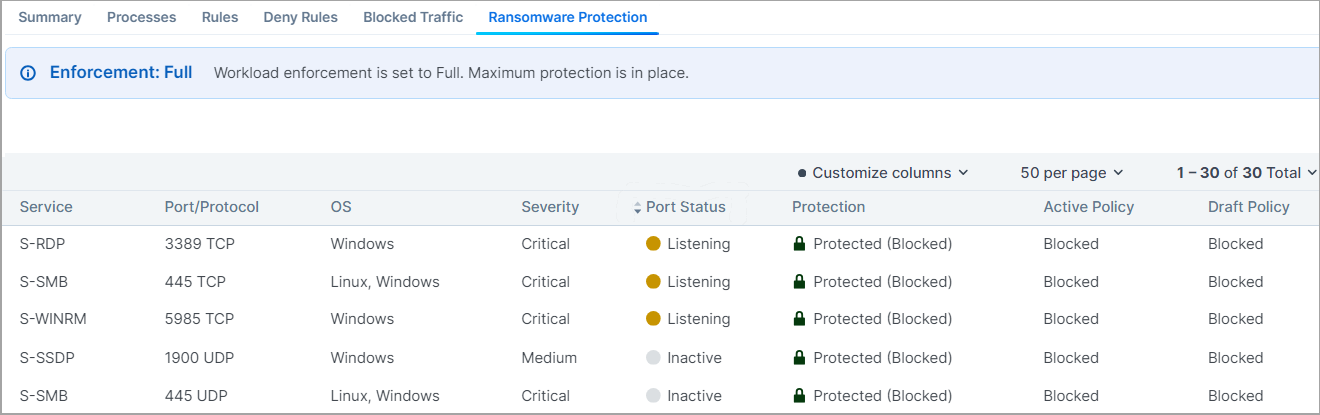
The Ransomware Protection tab provides detailed protection information for the workloads regarding each of the ransomware-risky services.
Information about the ransomware risk is then aggregated into the Ransomware Protection Dashboard for the system-side ransomware risk analysis.
The Severity and Port Type are designated per each ransomware-risky service.
For more details, see "Services" in the Security Policy Guide.
Here is the explanation for the data provided in the Ransomware Protection table:
Severity: Severity of the ransomware risk, which can be Critical, High, Medium or Low.
Port Status: Port status can be Active or Inactive.
Listening: Listening means there is a running process on that port.
Inactive: Inactive means there is no process running on the port. The same information is also provided on the Processes tab.
Port Type: The port type can be Admin or Legacy.
Admin: Admin refers to the service and ports are used for common administrative tasks.
Legacy: Legacy means that ports are used for legacy protocols.
Protection: Protection types are:
Protected (Blocked). When port is blocked by deny rules in Selective Enforcement or blocked with no allow rules in Full Enforcement. No ransomware can propagate through that port.
Unprotected The port is exposed to ransomware exploits.
Protected (Allowed by Policy). When there are allow rules intentionally policing the traffic. Only the trusted sources are allowed to access the port and hence the risk of lateral movement for ransomware is reduced. The workload has to be either in Selective Enforcement or Full Enforcement for the policy to be enforced.
The Port status does not affect the protection state.
Active Policy and Draft Policy: Indicates whether there is an Active or Draft policy to protect that particular port and the corresponding action.
API Support for the Ransomware Protection for Servers Dashboard
The Dashboard uses several APIs to aggregate various data from the system and helps you focus on the data you are interested in.
The two main APIs are: time_series and risk_summary. To learn about APIs used to power the Ransomware Protection Dashboard, see "Ransomware Protection Dashboard APIs" in the REST API Developer Guide.