Illumination Lesson
In this lesson, you will learn how to visualize your application environment and how inbound and outbound network traffic impacts your workloads.
Lesson Prerequisites
This lesson requires you to have the following data, access, and systems.
5 to 20 workloads: That are running and that you’ve paired with the PCE.
Labeled workloads: Applied a basic labeling scheme to the workloads (though you can refine it using Illumination).
Tip
You won’t get the full benefit of mapping traffic unless your environment is generating network traffic between the workloads you pair.
Development or test applications: The workloads need to have running applications that are generating traffic data. A distributed application is recommended.
Instructions
About Illumination
Visibility into your application environment is an important step toward implementing micro-segmentation. It's important to understand what it is that you want a segment. And, understanding the applications inside your environment—not just the applications, but also the workloads that comprise them—is critical.
The Illumio web console includes a visualization tool—the Illumination map—that you can use to reveal the granular details of application traffic flows between specific workloads, allowing you to discover interactions across applications and between the tiers within your applications.
Group Discovery in Illumination
After you pair workloads, they appear in the Illumination map. It displays the inbound and outbound network traffic for your workloads. When you have less than 50 workloads paired with the PCE, you see them all in the Illumination map.
Based on how you label your workloads, the Illumination map forms logical groups.
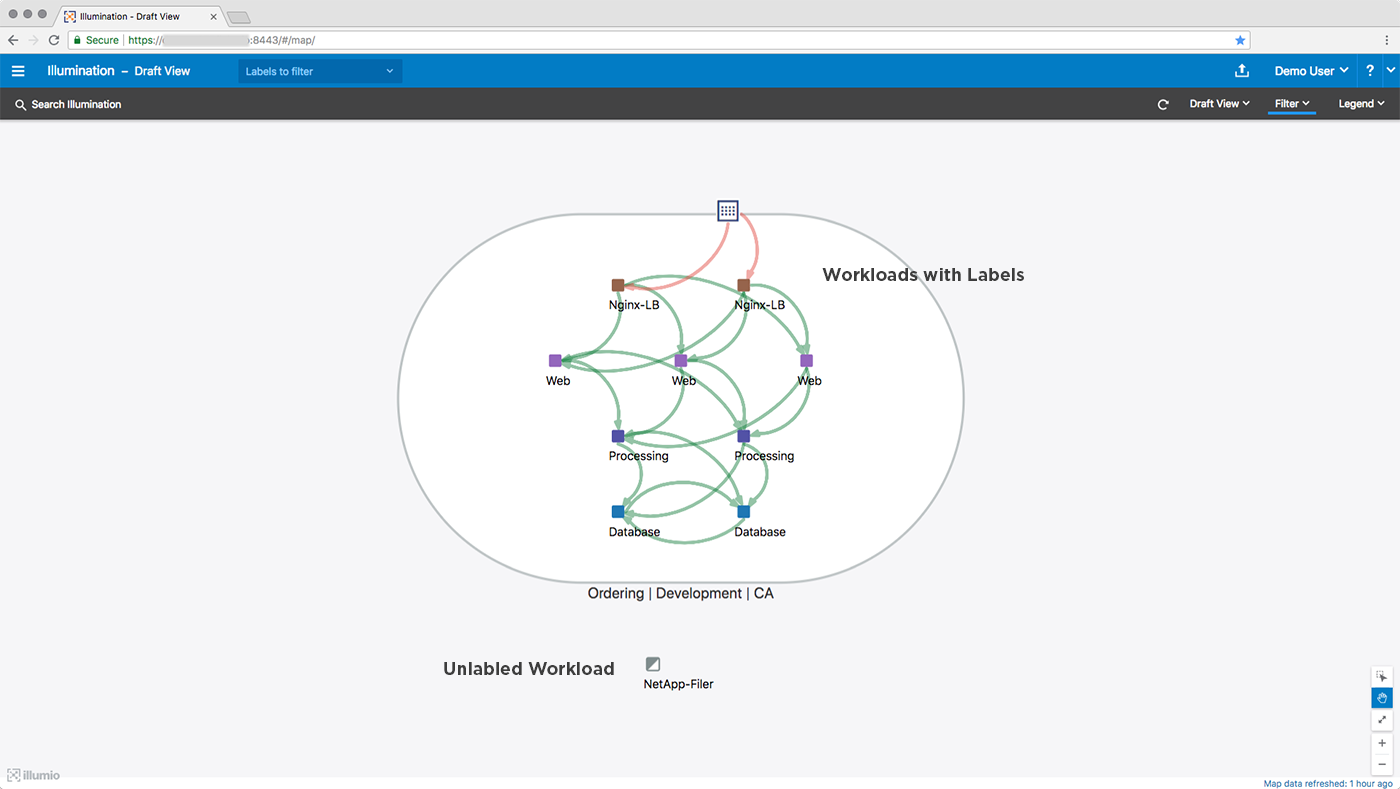
Workloads with the same Application, Environment, and Location labels appear in the same group. Illumination organizes your groups by their Application label. Changing any of a workload’s labels moves the workload in the Illumination map and displays inter-group traffic flows.
Auto-scaling Illumination Map
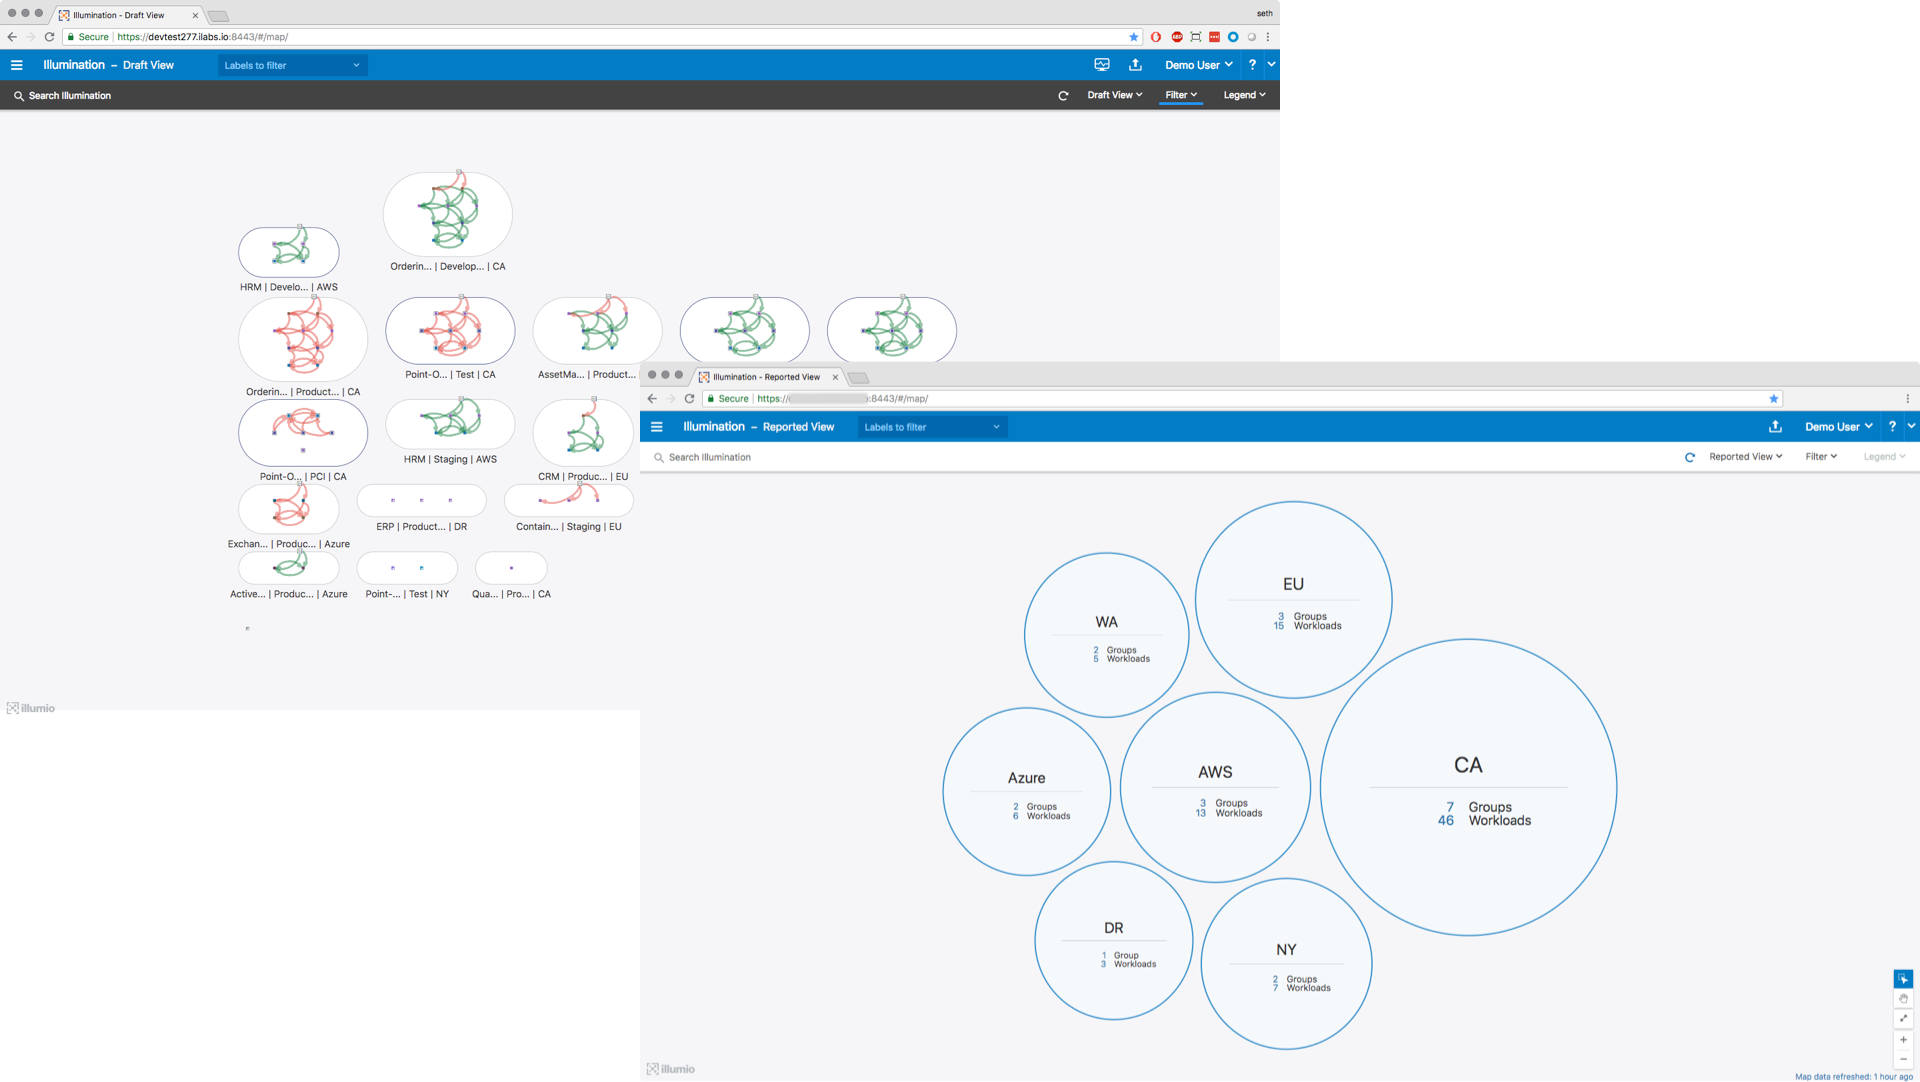
Note
If you have paired more than 50 workloads, the Illumination map switches to displaying your workloads grouped by their Location labels. See Visualization Guide for more information.
To see details about a group, click the group to zoom in. A command panel appears that displays valuable information about the group.
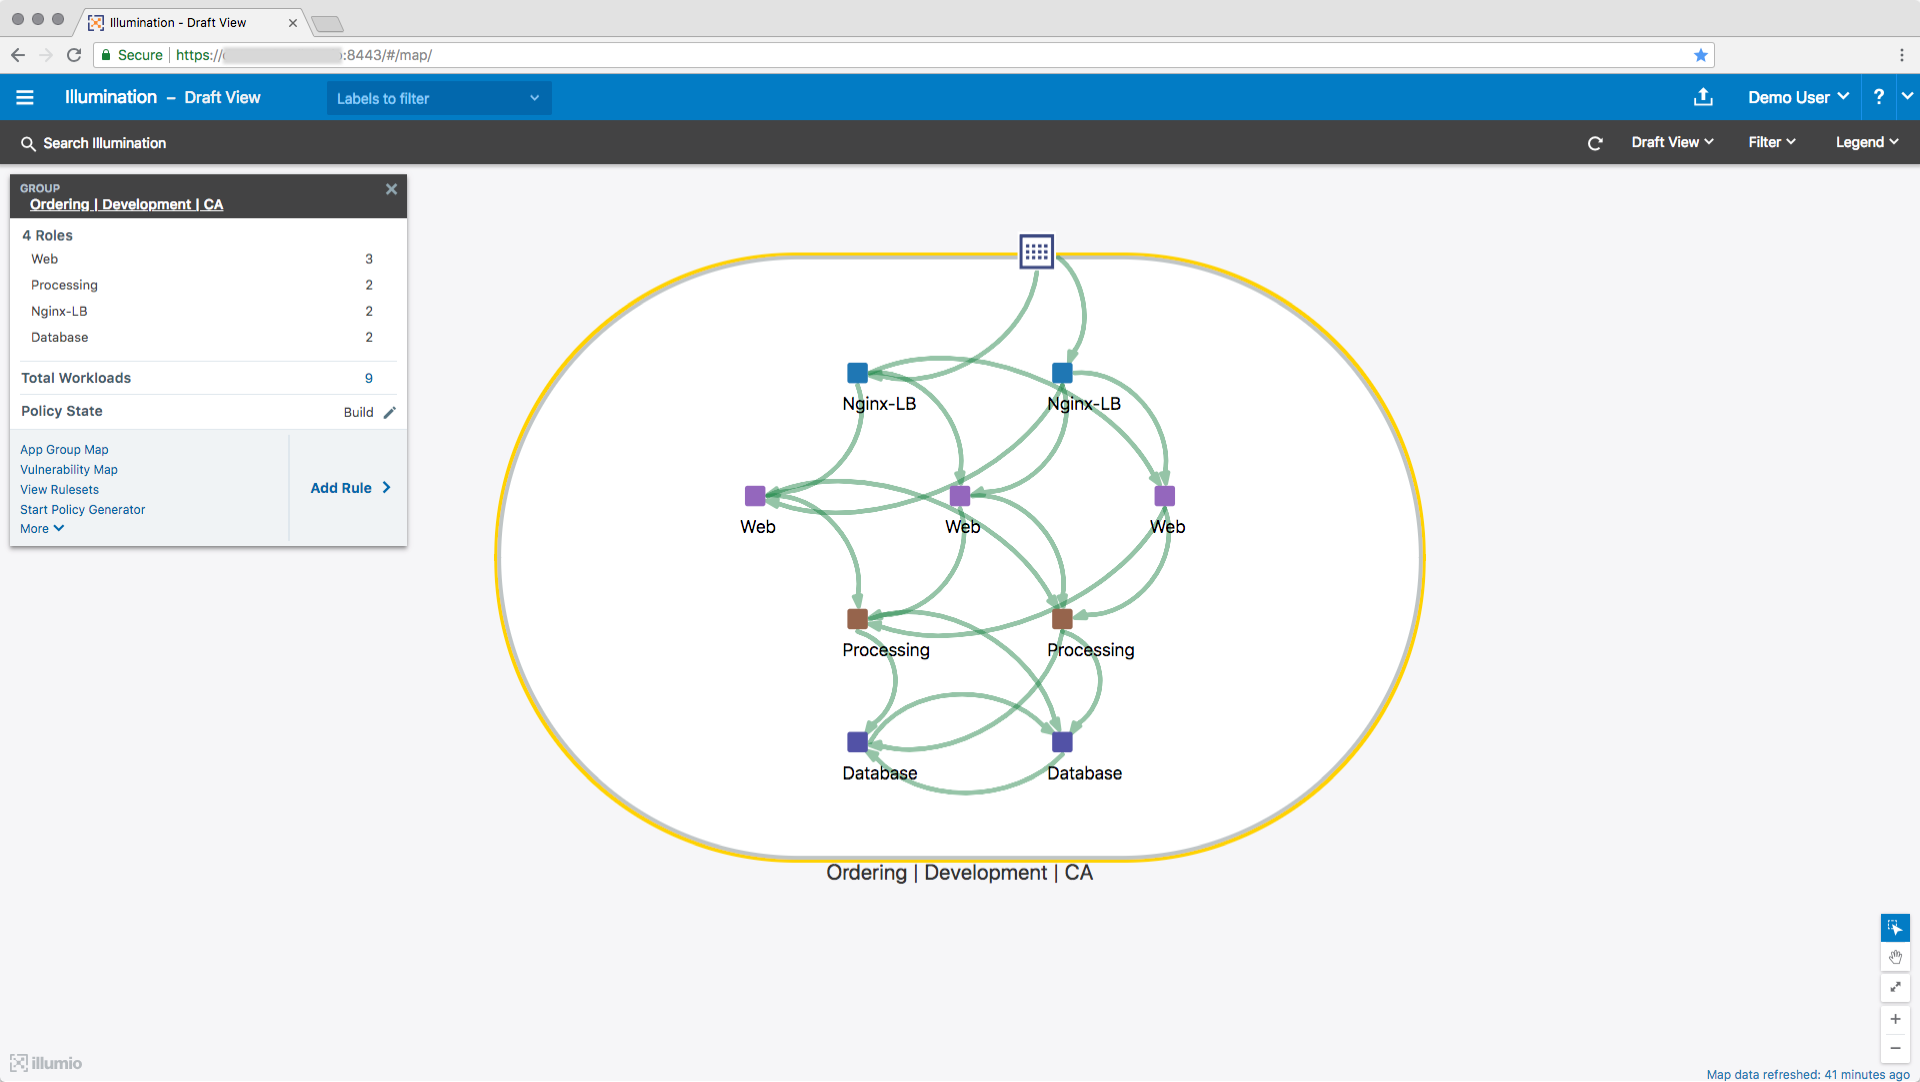
Traffic Flows
The Illumination map uses a color-coded system to display whether traffic will be allowed or blocked between your workloads.
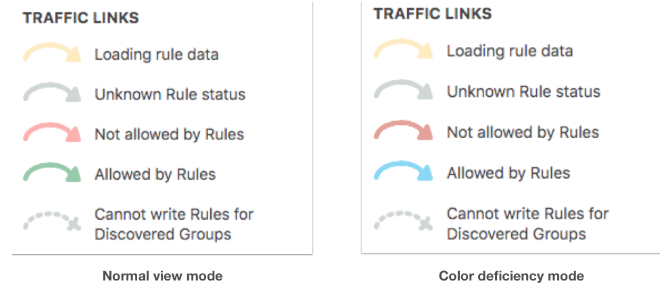
The traffic link colors are impacted by two key features in Illumio Core: Workload policy states and the Draft and Reported views of the Illumination map.
Workload Policy States
When you pair a workload with the PCE, you assign a policy state to the workload. The policy state determines how Illumio rules affect a workload's network communication.
Icon | Name | Description |
|---|---|---|
 | Idle | The VEN does not take control of the workload’s native OS firewall and no traffic is blocked in this state. When a workload is in the Idle policy state, it reports its traffic flows with green lines (allowed). |
 | Build | The VEN does not take control of the workload’s native OS firewall and no traffic is blocked in this state. The Idle policy state displays traffic in the Illumination map. |
 | Test | The VEN does not take control of the workload’s native OS firewall and no traffic is blocked in this state. ImportantTraffic is reported as blocked traffic unless you’ve written an Illumio rule allowing the connection. |
 | Enforced | The VEN takes control of the workload’s native OS firewall and blocks traffic unless you’ve written an Illumio rule allowing the connection. |
 | Unmanaged | You have created the workload in the PCE by specifying its attributes, such as IP address, hostname, and OS. Unmanaged workloads aren’t paired with the PCE and don’t have the VEN installed on them. You can apply labels to unmanaged workloads so that managed workloads (with VENs installed) can communicate with unmanaged workloads. |
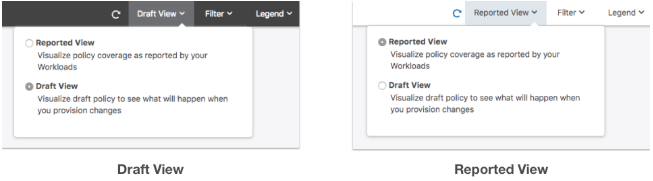
Illumination Map Views
The Illumination map provides two views of the policy data. These views show you what is happening and what will happen after provisioning pending changes from the PCE to the VENs.
Reported | Provides an accurate representation of what is allowed or blocked by the VENs. Use this view to verify your security changes; e.g., you added an Illumio rule allowing traffic or you changed a workload state to Enforced. |
Draft | Provides a “what-if” analysis conducted by the PCE. This view is a modeling tool that depicts whether traffic flows known to the PCE will be allowed or blocked, based on the configured policy. |
Tip
To switch between the two views, select the view from the top-right corner of the web console.