Mesh View
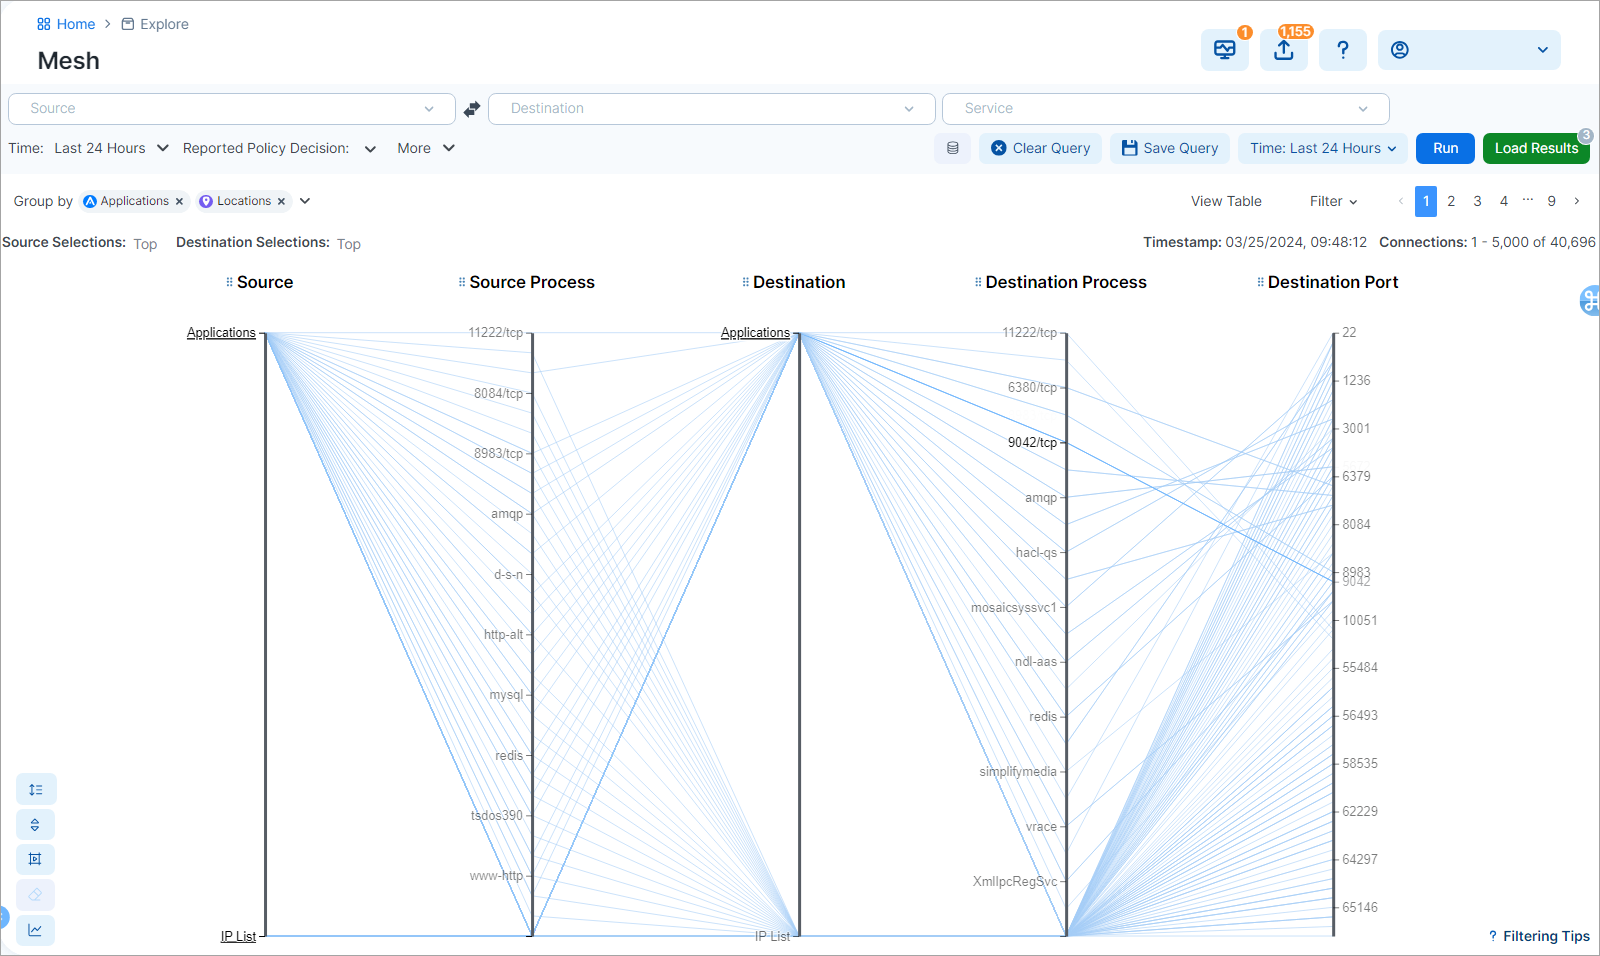
The Mesh view displays traffic flows along several vertical axes representing Destinations, Sources, ports, and processes. Mesh helps illustrate the overall topology of the network, offering an intuitive layout of network interaction.
You can click data points on the axes to focus on specific flows, sort and filter query results in several ways, drill down into data points for more granular detail, isolate ranges of data points with the Brush tool, by and to filter, and then go to the Table view to write rules.
About the Mesh
Note
The Mesh only supports Reported view. Draft view is not supported.
The Mesh shows multiple data dimensions simultaneously, providing a clear picture of how each data point interacts with others in their environment. Mesh offers the following:
High-dimensional data representation: Mesh portrays high-dimensional data. Every dimension is represented as a vertical axis, and data points are depicted as lines that intersect these axes. Network traffic data is presented as source, destination, port, and processes.
Cluster identification: In Mesh, patterns (like clusters or outliers) can emerge when multiple lines follow a similar path across the axes. This can help you quickly identify certain patterns or anomalies in the network flow data.
Simple representation: Mesh provides a structured, organized view of traffic flows, especially when the dimensions (or axes) are logically ordered.
Compactness: Mesh can represent a vast amount of data in a compact space by adjusting the spacing and ordering of its axes.
Enhanced data structuring: Mesh methodically places data points along the axes in sequential order, not randomly. This neat ordering produces to a crisper, more comprehensible visualization.
Customize the Mesh Display
The Group by aggregation tool available in the Map and Traffic is also available in the Mesh view. You can select and apply multiple Group by parameters. You can also specify the priority of parameters by dragging them up or down in the list. You will see your top group based on your selection and you can drill down through the groupings. The hierarchy of the parallel coordinates in the mesh is based on your selected grouping.
Other customization options include:
Add or remove axes
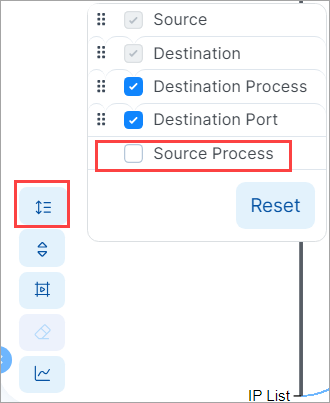
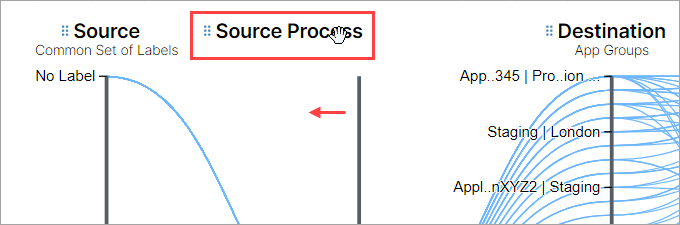
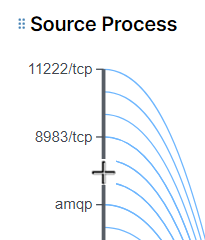
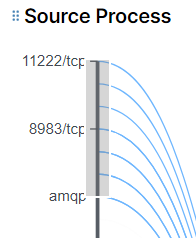
You can remove or add axes, keeping only those dimensions that are helpful for your current exploration. For example, except for the mandatory source and destination axes which you cannot remove, you might want to add or remove the other axes to narrow down the visualization and emphasize or de-emphasize certain data points.
In the image below, deselecting Source Process removes that axes from the Mesh.
Reorder axes
You can reorder the Mesh axis columns to change the Mesh display. For example, you may want to move the axis you are most interested in to the center of the mesh and move less important data to the sides of the mesh.
There are two ways to reorder the axes:
Dragging
Click an axis heading and drag the axis left or right.
Specify the order in a list
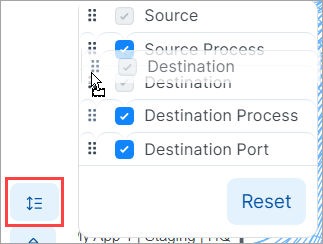
Click the Customize Axes icon in the Tool Cluster to display axes in a list, and then use the handles to select and drag axes up or down within the list.
Change the sorting order of Mesh data
You can sort the Mesh data by the axis value or the number of flows.
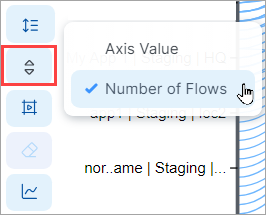
Axis Value
In ascending order, orders the ports numerically and Source and Destination columns alphabetically.
Number of Flows
Each axis is sorted according to its amount of traffic. The data point with the most flows appears at the top of the axis.
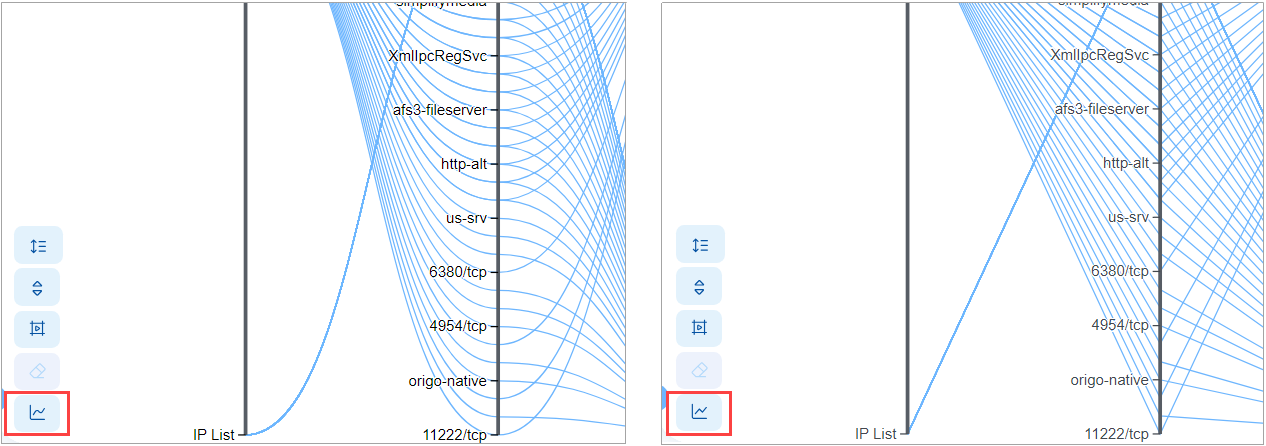
Change the Line Style
You can click the Line Style icon in the tool cluster to change mesh lines from curved (default) to straight.
The Mesh provides several ways to navigate your data.
Explore the Mesh View Data
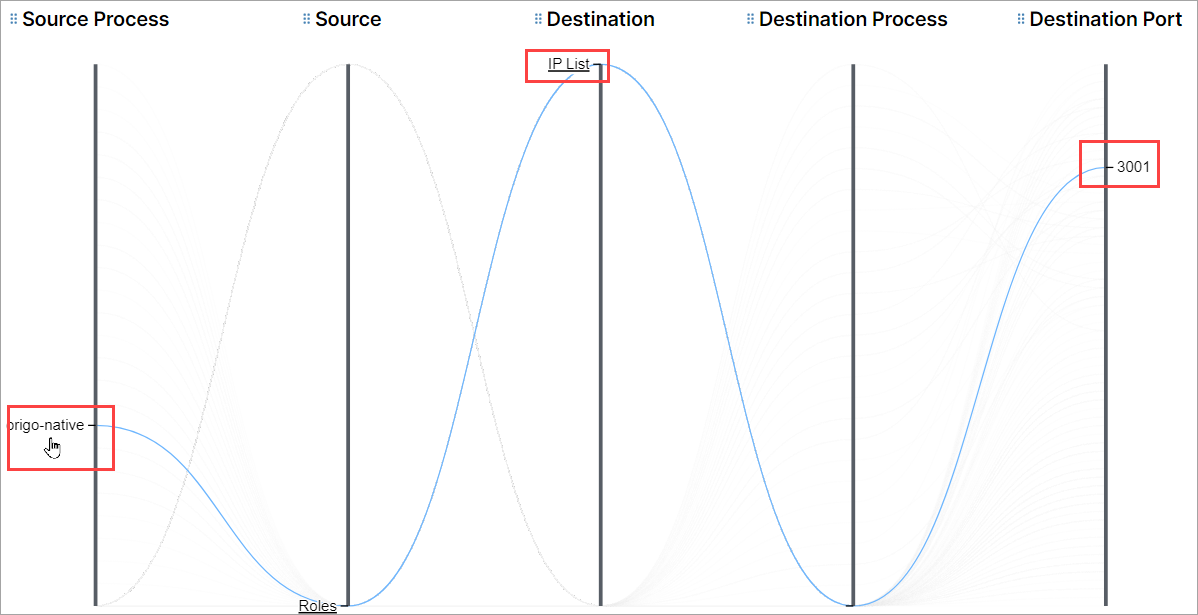
Basic mouseover
You can mouseover each vertical axis along data points to view specific connections between that point and points in other axes.
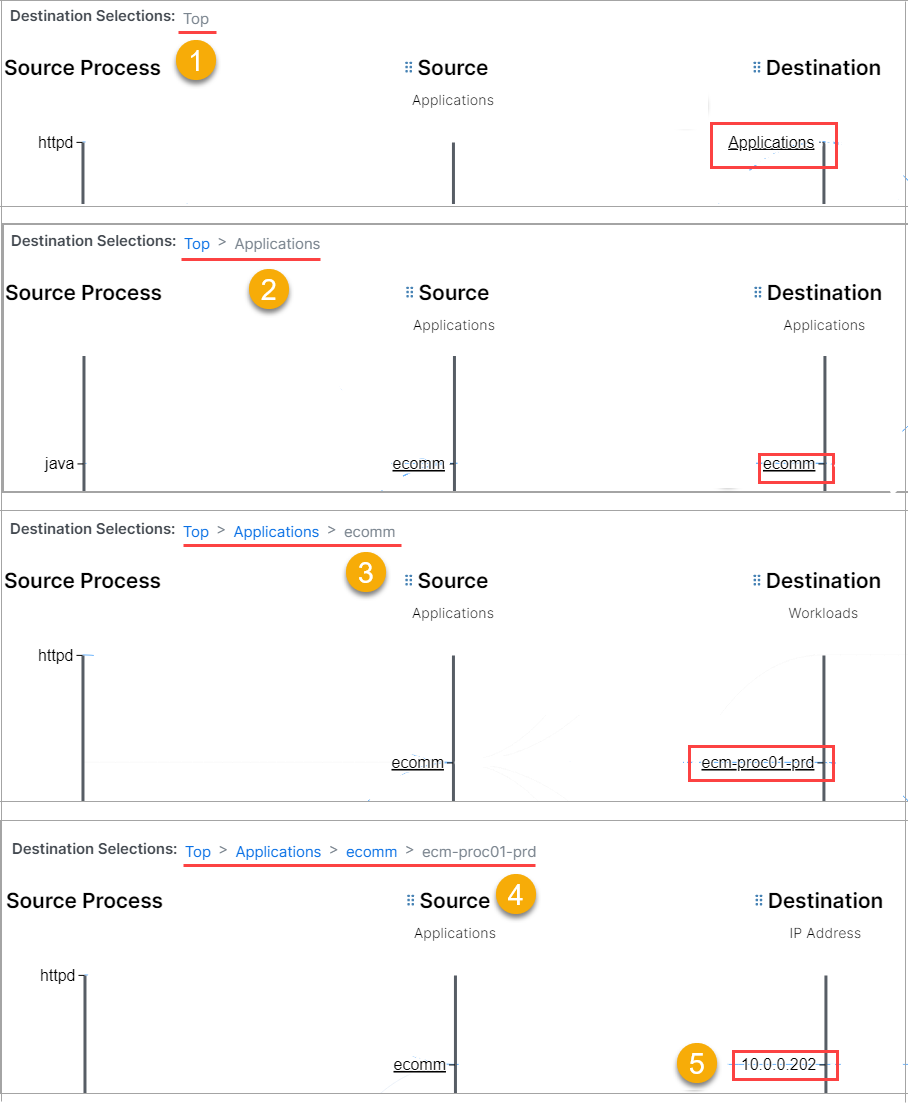
Drill in for more granular data
Click underlined data points to dive into deeper layers, traversing from grouped labels down to the granularity of individual IP addresses. Breadcrumbs above the mesh help you understand and traverse back through the layers.
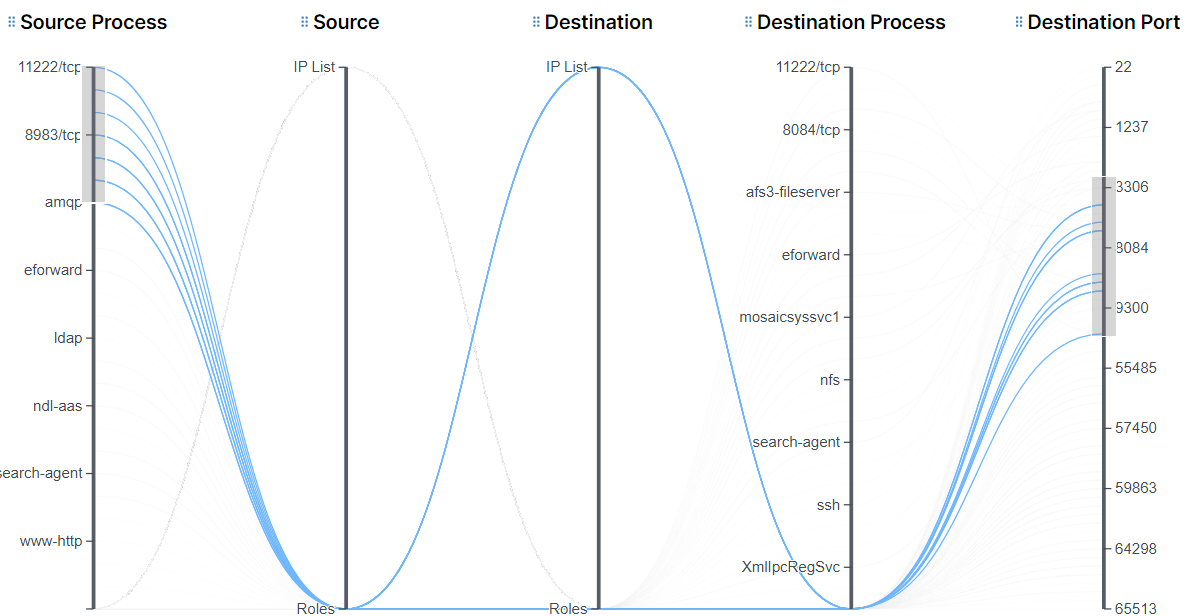
Brush to define and isolate data points
The Brush tool allows you to isolate one or more data points on one or more axes. This simplifies your view of the data so that you can focus on the connections you're interested in.
You change Brush tool modes by clicking the Brush icon on the Tool Cluster.
 | Brush is off, ready to be activated. |
 | Activated. When the Brush is activated, the icon turns dark blue and the cursor changes to crosshairs. By placing the crosshairs on the axis and dragging (brushing) up or down, you can select one or more data points on an axis. The selection is represented by the gray area on the axis. The crosshairs remain in effect while the Brush is in Activation mode. |
| Deactivated. When you have finished selecting areas on the axes using the crosshairs, you can click the icon to deactivate the crosshairs and restore the regular cursor. Now you can interact with the Mesh while the brushed portion of the axes, defined in gray, remain. You can still slide the gray bars up or down while in Deactivated mode. |
 | Clear Brush. Click to clear the brush and exit Brush Mode. |
Once the Brush is activated, you can:
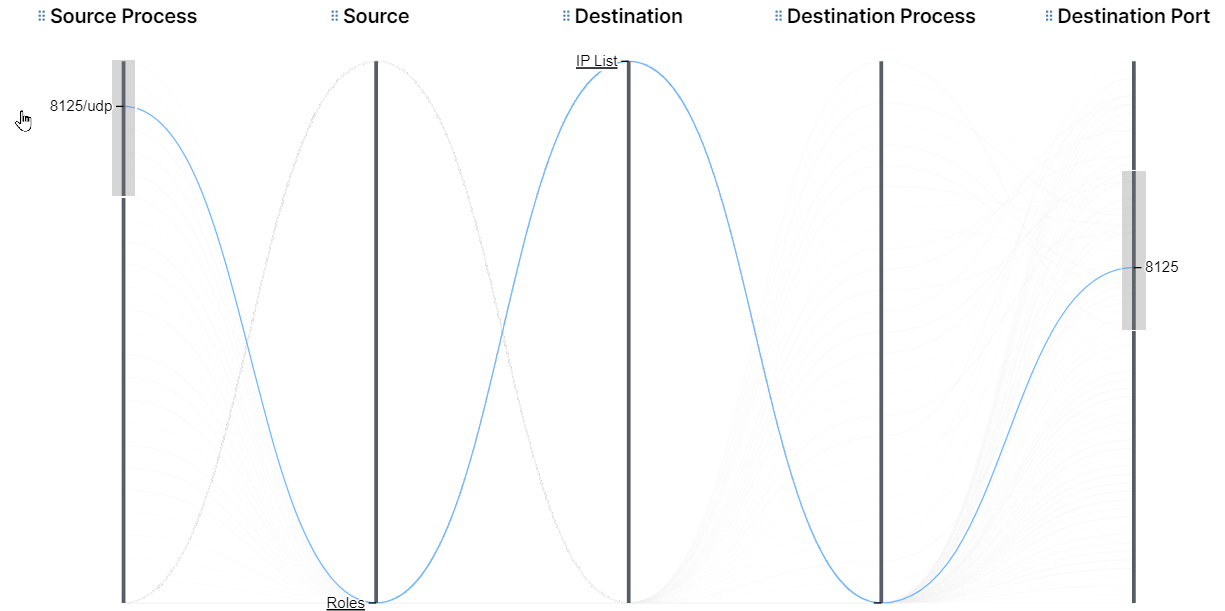
Mouseover an axis line
Click and drag up or down an axis line to select and isolate one or more data points. The selected portion is represented by a gray area on the axis.
To highlight connections within specific flows, apply the brush feature to multiple axes.
To turn off the crosshairs and restore the regular cursor, click the brush icon again. You can interact with the Mesh while the brushed portion of the axes, defined in gray, remain.
When done isolating a range of data points on axes, click Clear Brush in the Tool Cluster to reset the Mesh.