App Groups
An App Group is a logical grouping of workloads associated with an application instance, which is defined by the labels assigned to the workloads in it. This section describes the types of App Groups and how to configure them.
App Group features allow application owners to see all workloads for an application instance in a single App Group, even when the workloads are not currently communicating with each other. This is helpful when building or validating security policies for traffic between workloads because it allows application owners to focus only on the workloads that belong to their applications, regardless of location.
Ways to View App Groups
App Groups List Page
To view a list of all the App Groups in your PCE, click App Groups in the left navigation. The filterable list page presents high-level information about the listed App Groups as well as hyperlinks to each App Group's rules and map.
Two options are provided at the top of the App Groups list:
Edit App Group Definition: Allows you to configure whether App Groups comprise Application and Environment labels or Application, Environment, and Location labels. This is a global setting for all App Groups.
Segment Multiple App Groups: Allows you to apply nano-segmentation (also known as ringfencing) on multiple App Groups using the Policy Generator. Nano-segmenting App Groups allows all workloads to communicate across all services within each App Group. For related information, see Segment Multiple App Groups with Policy Generator.
Protection Coverage Score scores are shown for each app group on the List Page.
App Groups Details Page
To view an individual App Group, click an App Group in the list to view its Details Page. The details page includes several tabs:
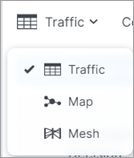
Explore: Offers three visualization options (detailed below) for exploring App Group traffic.
Members: Lists the App Group member applications; presents high-level information about each member.
Rules: Lists all rules that apply to any workload in the App Group.
Policy Generator: Simplifies the Illumio policy creation process by recommending the optimal security policy for your App Groups. You can use it to accelerate security workflows and reduce the risk of human error while creating security policy. For details, see Policy Generator.
Vulnerabilities: Shows the different vulnerability exposure scores for the selected App Group based on the ports, protocols, and workloads to which it is exposed.
Ransomeware Protection (Preview version): Presents a protection coverage score, workload exposure score, and recommended actions widget. A table of Risky Services is also provided.
App Group Visualization Options
App Group Traffic Table
The App Groups Traffic table displays details about the App Group in a traditional table format, including the traffic, group members, rule coverage, and ransomware protection statistics associated with that App Group.
You can use the Traffic table to query and analyze the PCE's traffic database for auditing, reporting, and troubleshooting. You can query for traffic flows between workloads or hosts, labeled workloads, or IP addresses, and you can restrict the query by specific port numbers and protocols.
The VEN decorates the flow summary logs with DNS names when it sends them to the PCE. In the Traffic table, the PCE appends the DNS names to the flow logs so that auditors and SOC analysts can look at these DNS names instead of performing reverse look-ups on random IP addresses.
For more information, see Traffic Table.
App Groups Mesh View
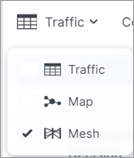
The Mesh view displays traffic flows along several vertical axes representing Destinations, Sources, ports, and processes.
You can hover over data points on the axes to focus on specific flows. You can also sort and filter query results to view them in a number of ways. You can drill down into deeper layers of data, traversing from grouped labels down to the granularity of individual IP addresses. You can use the Brush tool to isolate and investigate separate data points, and then go to the Table view to write rules.
For tips on how to filter the data in your Mesh view, click the Filtering Tips link in the bottom-right corner of the page for a pop-up tooltip.
For more information about the Mesh, see Mesh View.
App Groups Map View
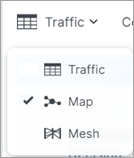
The App Groups Map view displays the workloads and traffic in your data center. The Map takes time to render with large-scale deployments. However, some users, such as application owners, prefer to think about their data center in terms of traffic between workloads that belong to different application instances rather than between physical locations.
For more information, see Map View.
You can search for specific App Groups and see the associated workloads, traffic, and rule coverage between members in the group and other Source and Destination App Groups that provide or consume its services, as well as rule coverage for the traffic between App Groups.
Source App Groups: Use services provided by the current application
Destination App Groups: Provide services used by the current application
Note
If you click an App Group that contains more than 1,000 workloads, an alert message appears and the workloads are not displayed.
When you click an App Group in the Map, the workloads and their associated traffic in that App Group displays, as well as a pop-up list of other App Groups communicating with that App Group either as the source or destination of services.
Connected to the App Group by arrows are the Source App Groups that initiate connections to this application instance and the Destination App Groups that provide services for this application instance. To view a list of the source or destination App Groups, single-click its circular representation on the map. A panel opens which displays the name of each App Group along with its Environment and Location label.
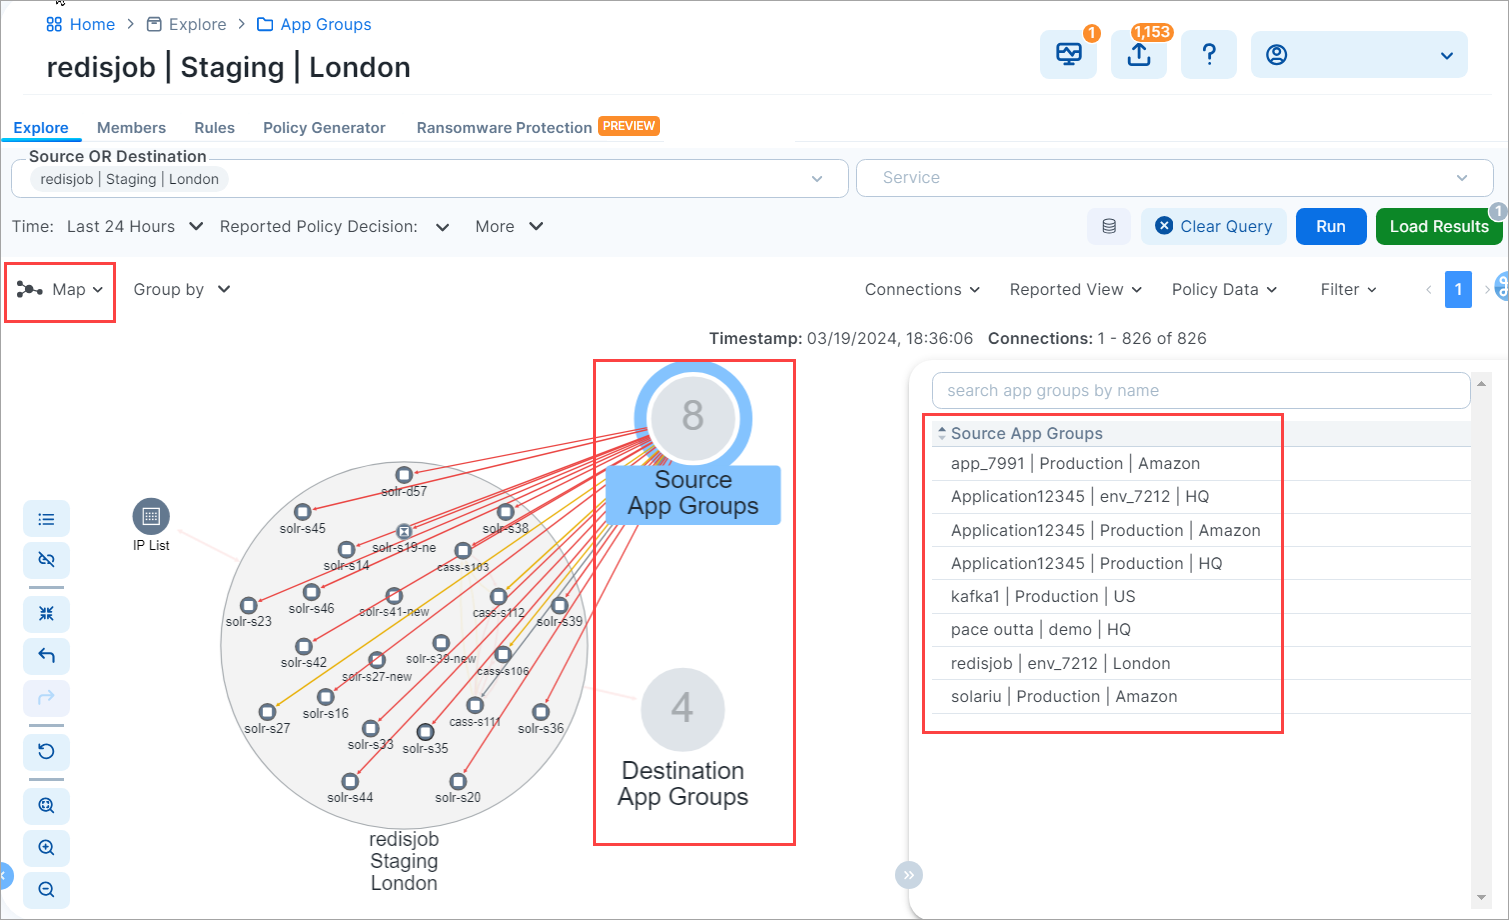
You can also search for App Groups connected to a given App Group. This is convenient for filtering a long list of connected App Groups.
Note
If the App Group does not have any connections, the Destination and Source App Groups do not display.
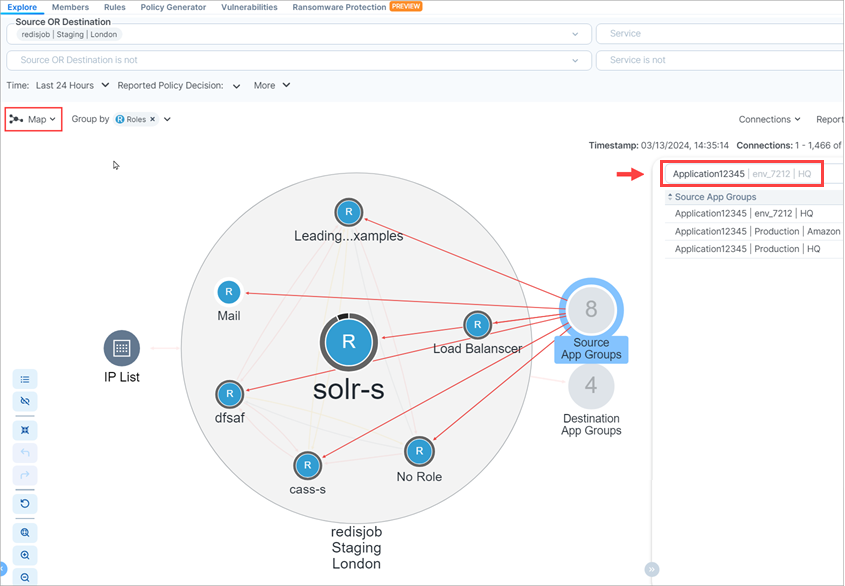
When you click a Source or Destination App Group in the panel, lines representing the traffic links between the App Groups display in either red for blocked traffic or green for allowed traffic. Source App Groups display above the original App Group and Destination App Groups display below the original App Group.
If an expanded Source or Destination App Group is currently displayed in the App Group Map, you can view the next or previous connected App Groups by clinking the Leftor Right arrows in the panel.
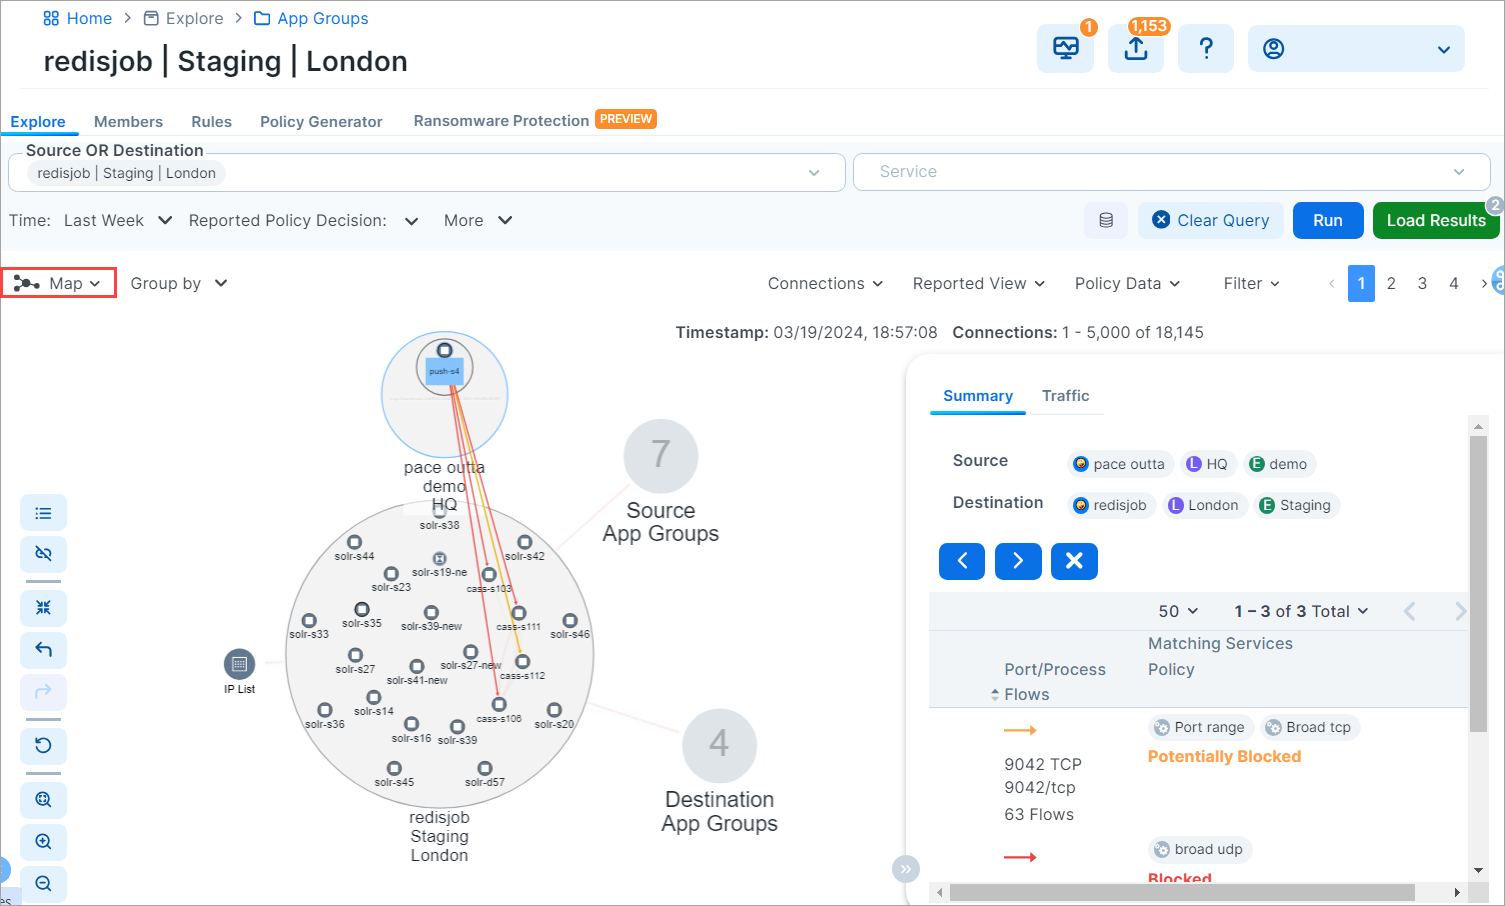
When you select an App Group, the list of all observed services between any workloads in that App Group displays. When you click a specific line between two workloads, all services between the selected workloads display.
When you have virtual servers, you can view their details in the App Group Map command panel in both Reported and Draft views.
Application owners can write both intra- and extra-scope rules to allow others to use the application instance. However, as an application owner, you can only write rules when you are the owner of the Destination App Group to allow other Source App Groups to access your application workloads.
Compare App Group V-E Scores by Enforcement Type
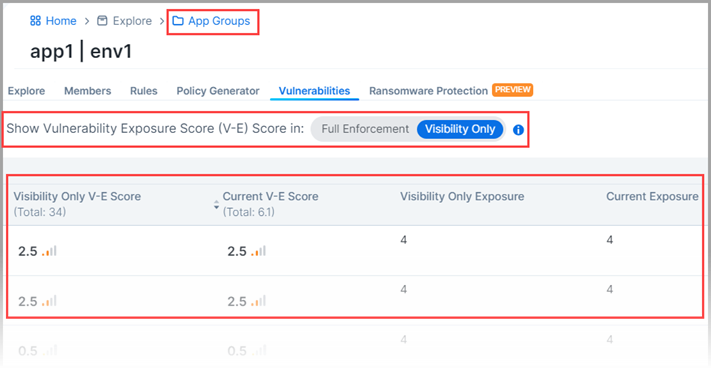
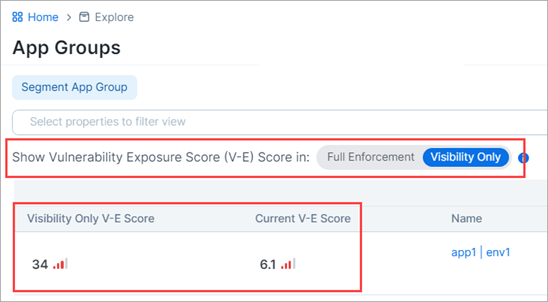
The Show Vulnerability Exposure (V-E) Score tool lets you see how the security of your app groups would change if you were to change their current enforcement mode. Columns in the App Group list and details pages provide a side-by-side comparison of the effect different enforcement modes would have on Vulnerability and Exposure (V-E) scores. A toggle allows you to simulate the switch between Full Enforcement and Visibility Only enforcement modes.
Note
This option allows you to simulate the switch between Full Enforcement and Visibility Only modes. It doesn't change the actual enforcement mode of your app groups.
How it works
The PCE displays V-E scores in the UI based on ransomware and vulnerability statistics it previously calculated and stored in a database.
If the stored data is stale (4 hours or older), the PCE recalculates the statistics and updates the V-E scores in the UI.
Toggling the Full Enforcement/Visibility Only options provides a side-by-side comparison of the effect of the different enforcement modes.
Because the PCE calculates and re-checks for new data periodically, the information in the UI may not immediately reflect the current V-E score.
API responses include the complete vulnerability data set for the different enforcement modes. V-E data for all modes is pre-processed and stored in a database to eliminate the performance impact of frequent recalculation.
A V-E score is the calculated value based on the Vulnerability Score and Exposure Score = ∑ f (VS, ES). It can be shown for an individual vulnerability on a port for a single app group or as a summation of all the V-E Scores for an App Group, role, or workload.
App Group List pages
On App Group list pages, two adjacent columns show the following:
Full Enforcement / Visibility Only V-E Score: Depending on the item's current enforcement mode, this column matches the Current V-E Score column or changes to show a different V-E score obtainable if the actual enforcement mode were changed.
Current V-E Score: The most recently calculated V-E score of the .
App Group Details pages
On the Vulnerabilities tab of App Group details pages, four adjacent columns show the following:
Full Enforcement / Visibility Only V-E Score: Depending on the item's current enforcement mode, this column matches the Current V-E Score column or changes to show a different V-E score obtainable if the actual enforcement mode were changed.
Current V-E Score: The most recently calculated V-E score of the app group.
Full Enforcement Exposure: Depending on the item's current enforcement mode, this column either matches the Current Exposure column or changes to show a different exposure score obtainable if the actual enforcement mode was changed.
Current Exposure: The current exposure score of the app group.