Ways to View Query Results
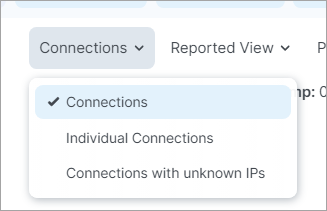
Options in the Connections menu allow you to view traffic connections in the Traffic table as:
Aggregations of multiple connections, for a more concise view
Individual connections, for a more granular view
Connections with unknown IP addresses
View Traffic as Aggregated Connections
Select the Connections option for an aggregated, more concise view of the traffic flows.
Tip
Contrast this method with the View Traffic as Individual Connections below.
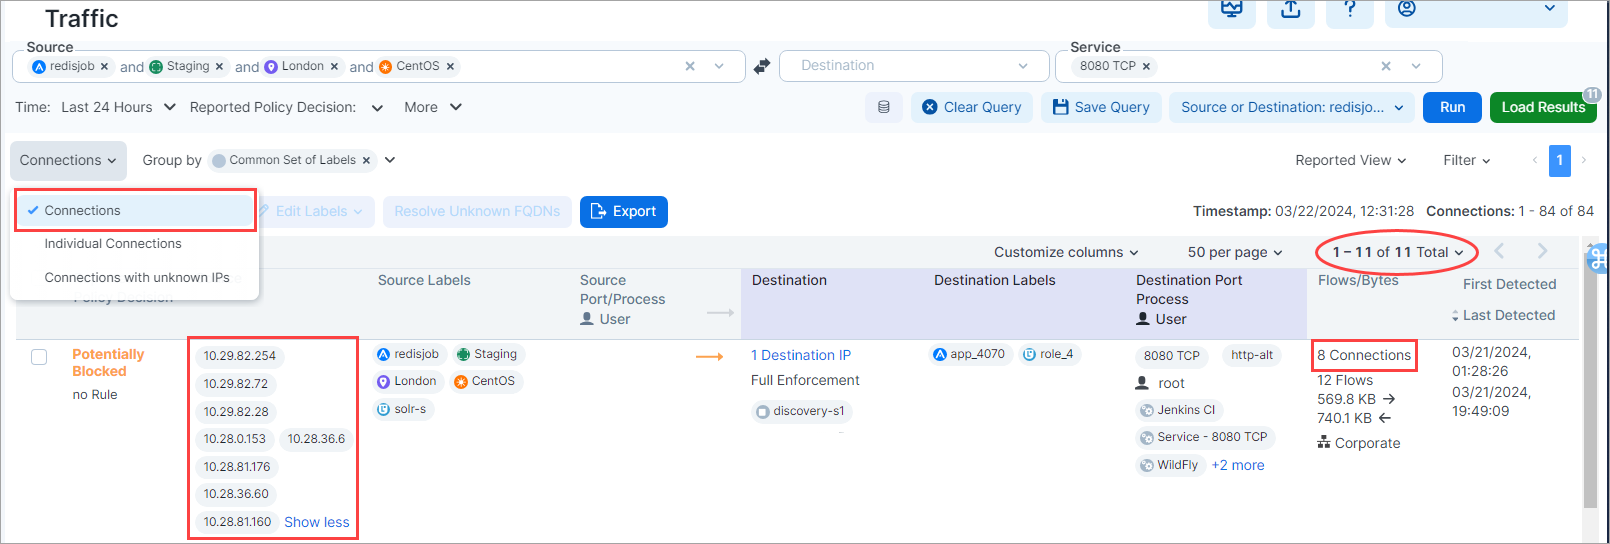
Note the following in the image below:
Connections is selected in the Connections menu.
Common Set of Labels is selected in the Group by menu. (This Group by selection is optional and shown here merely as an example grouping method. You can select this and/or any other combination of grouping options in the Group by menu, or no option at all.)
The Source column shows an aggregation of 8, commonly-labeled IP addresses.
The Flow/Bytes column shows 8 connections.
The total row count for the page is 11.
View Traffic as Individual Connections
Select the Individual Connections option for a more detailed, granular view of the traffic flows.
Tip
Contrast this method with View Traffic as Aggregated Connections above.
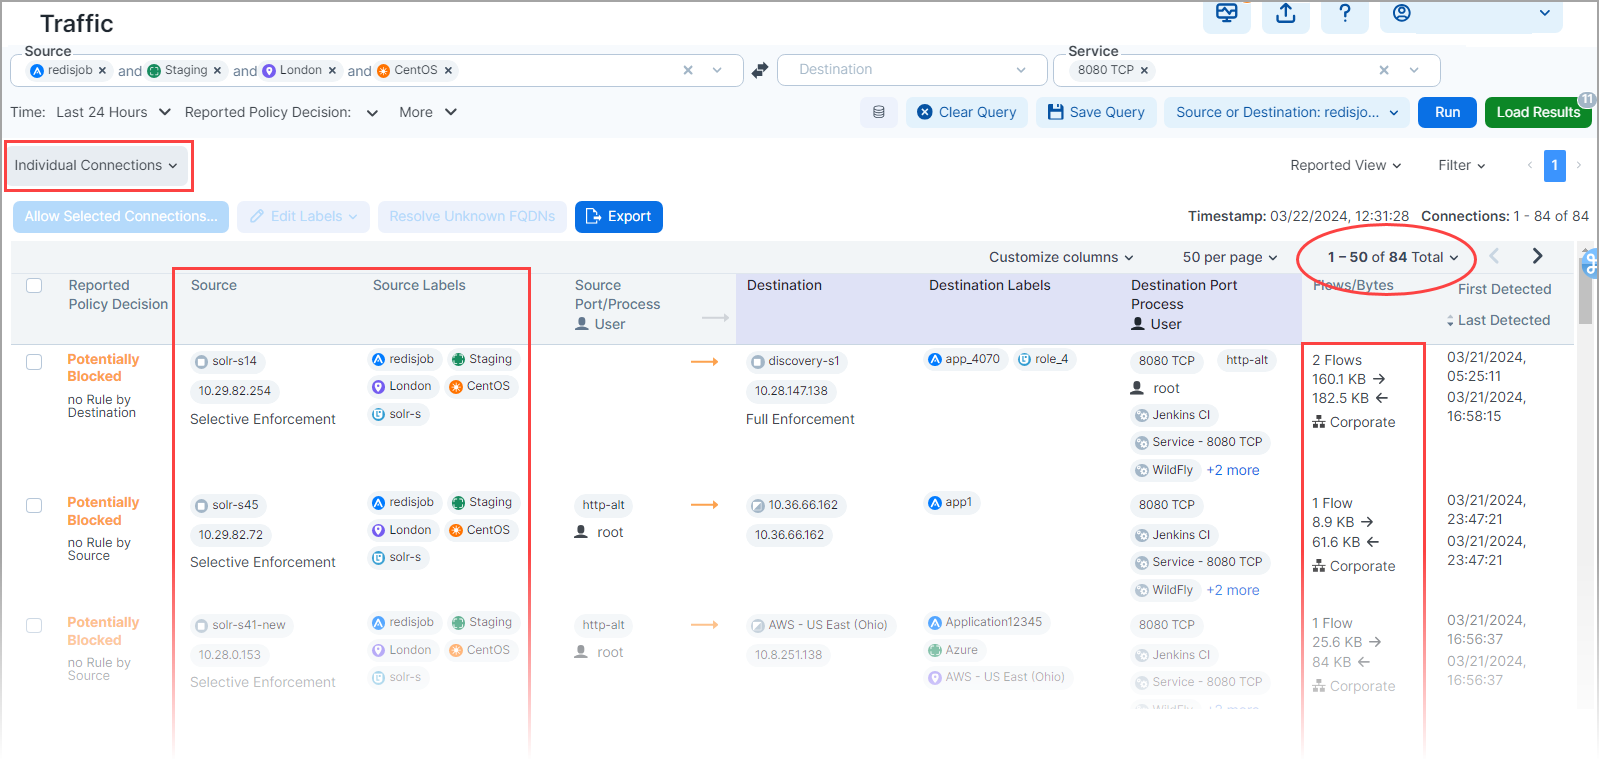
Note the following in the image below:
Individual Connections is selected in the Connections menu.
The Group by menu does not appear when Individual Connections is selected.
The Source column shows several rows of individual, commonly-labeled IP addresses.
The Flow/Bytes column shows that each row represents a single connection
The total row count for the page is 50
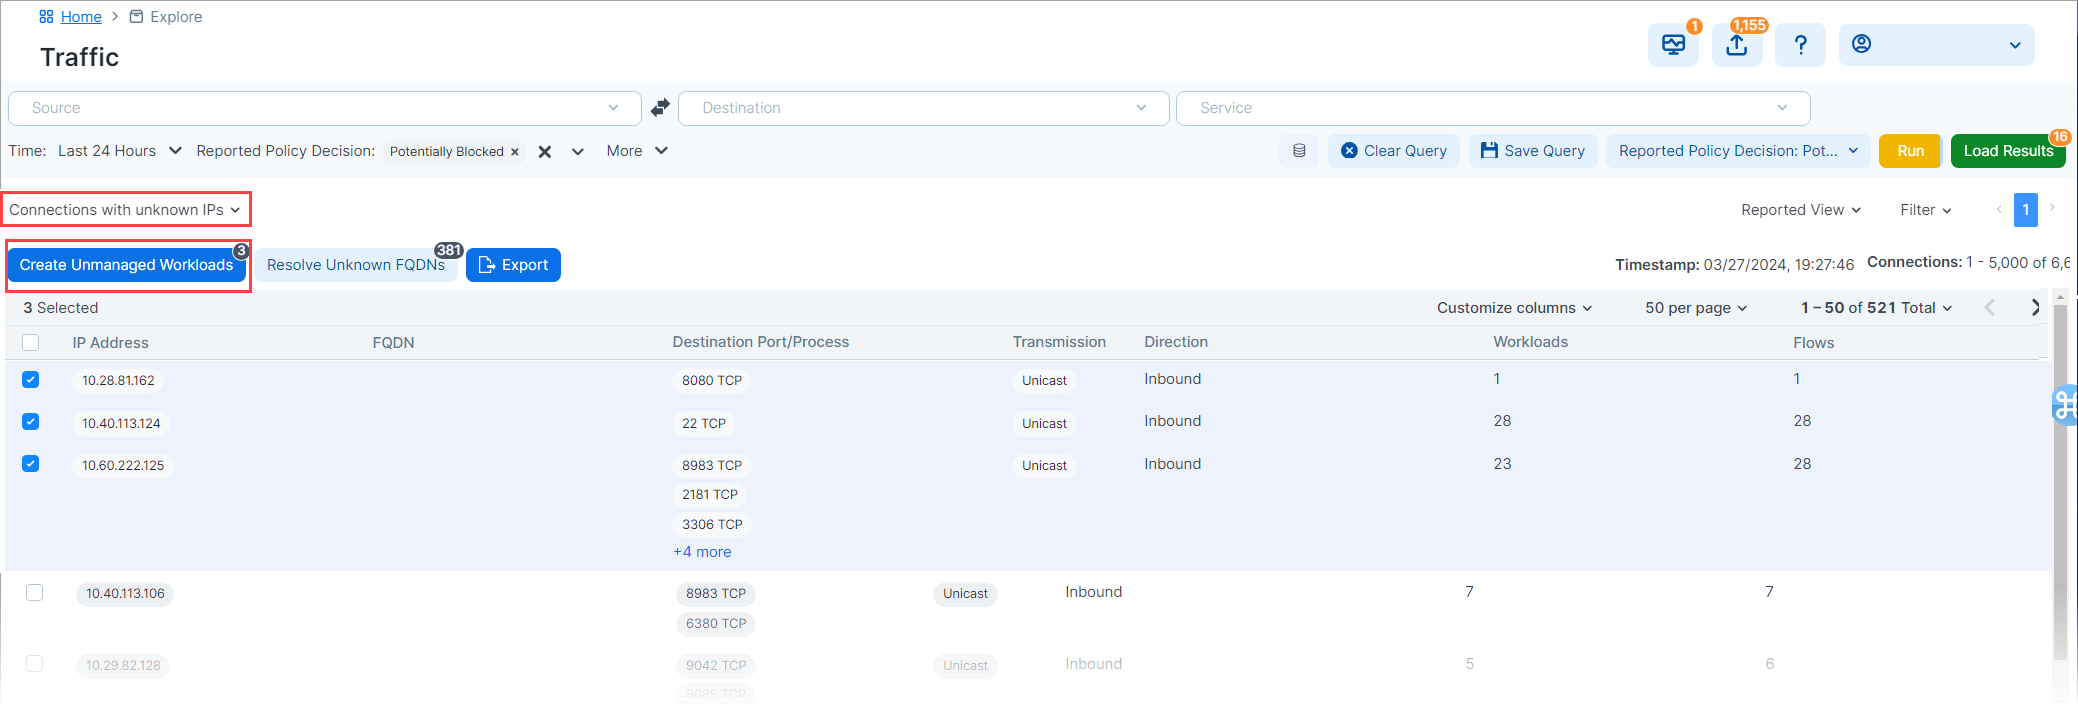
View Connections with Unknown IP Addresses
From the Connections menu, select the Connections with Unknown IPs option to see a list of connections found by the query that your organization has not turned into unmanaged workloads. You can easily create unmanaged workloads from these connections using the Create Unmanaged Workloads option above the list. For more information, see View Connections with Unknown IP Addresses.