About the Visualization Tools
In the PCE UI, you can use the visualization tools to reveal the traffic flows in your network and to help you configure policies to secure your applications. These tools include the Map, Traffic table, Mesh, Reports, and App Groups.
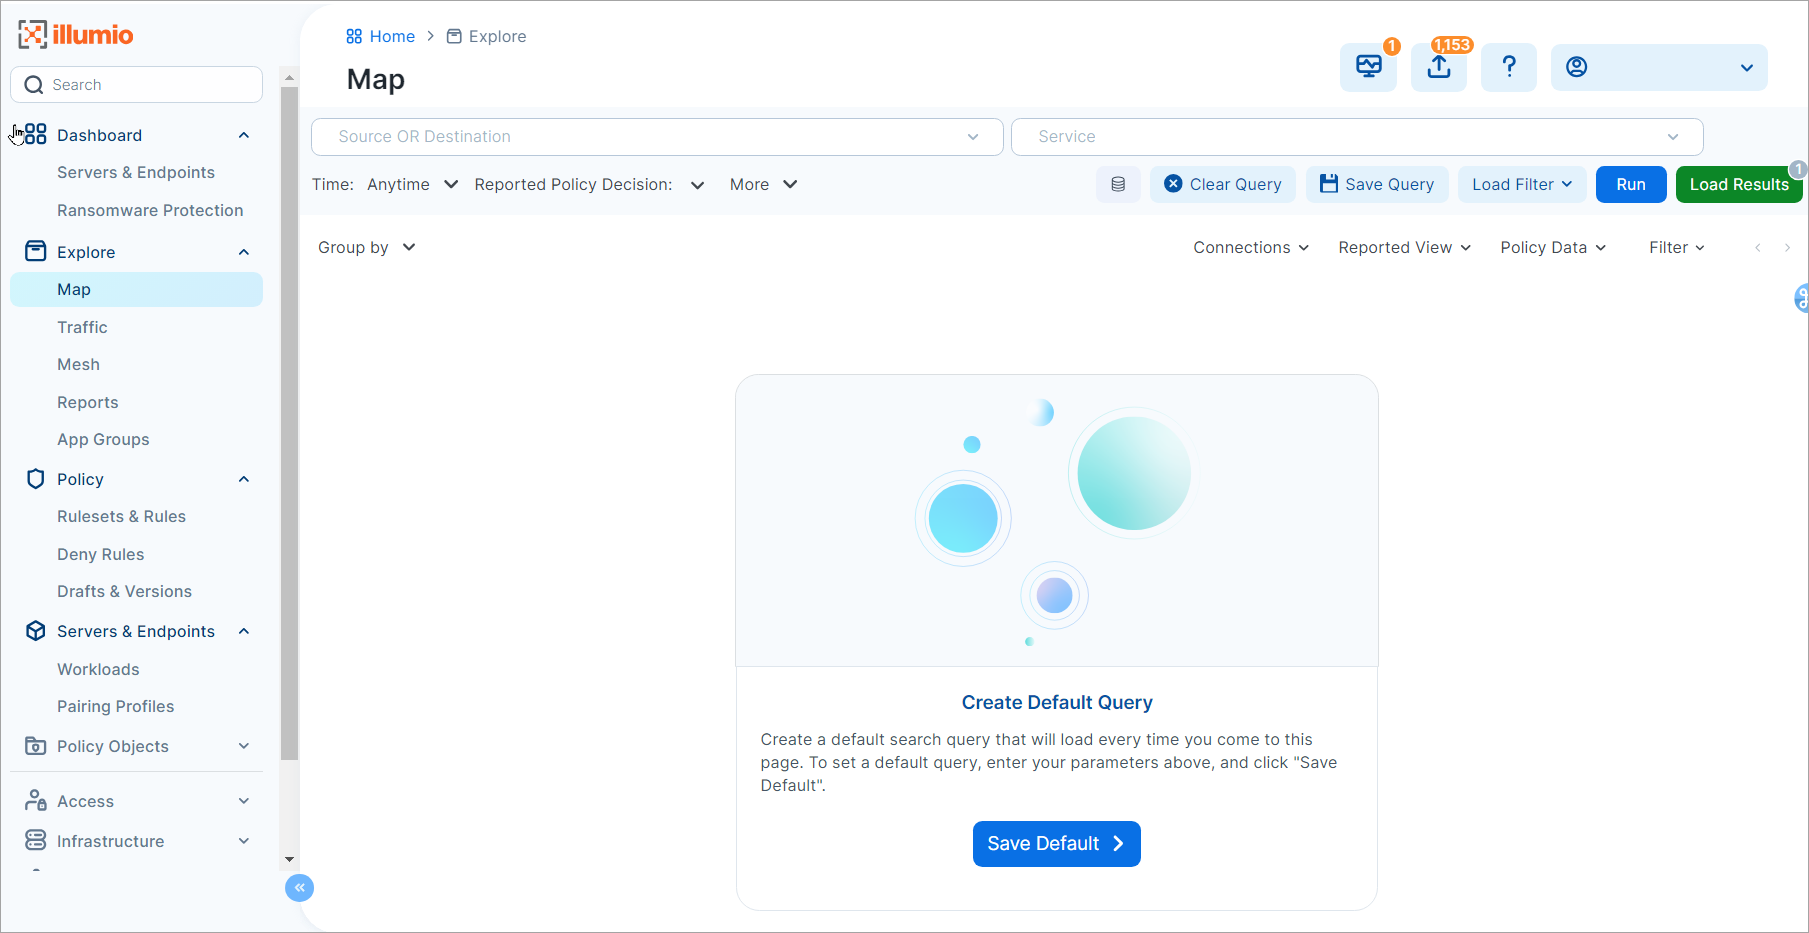
When you open a visualization tool for the first time or the first time during a 24-hour period, the PCE UI displays a landing page from which you run your first query.
Types of Visualization Features
Select visualization tools from the Explore category in the left navigation.
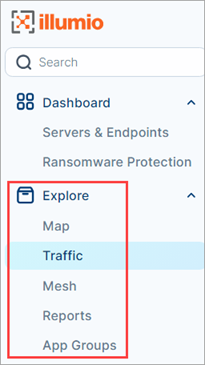
Map
The Map depicts workloads that form logical groups (based on labels attached to workloads) and provides an understanding of the traffic flows between workloads. You select groups in the Map view to view details about that group and develop policy for the workloads in the group.
Traffic
The Traffic table displays details about your traffic flows in columns and rows. Using this view, you query the PCE traffic database for historical data that can be used for compliance and audit, as well as policy development. With an easy-to-use interface, you enter your search parameters using plain-text language and filter results by a specific time period; specific ports, protocols, or processes; and actions that were taken on that traffic based on policies (for example, “allowed” vs. “potentially blocked” vs. “blocked”).
Mesh
Using vertical axes, the Mesh displays traffic flows as lists of destinations, sources, and the port. The traffic flows between destinations and sources connect along parallel coordinates. You can sort the results based on port number or the number of traffic flows. Click any item in the results to focus on specific traffic flows.
Reports
The Reports feature allows you to generate four types of recurring reports:
Executive Summary reports
App Group Summary reports
Traffic Export
Rule Hit Count Report
You can download reports in PDF and CSV formats and share them with people in your organization who don’t have access to the PCE UI or PCE REST API.
App Groups
App Groups allow application owners to see all workloads for an application instance, even when the workloads are not currently communicating with each other. This is helpful when building or validating security policies for traffic between workloads because it allows application owners to focus only on the workloads that belong to their applications, regardless of location.
Filters for the Visualization Tools
For each visualization tool (except Reports), traffic filters are available so you can show or hide different elements of your data and focus on what is most important to you.
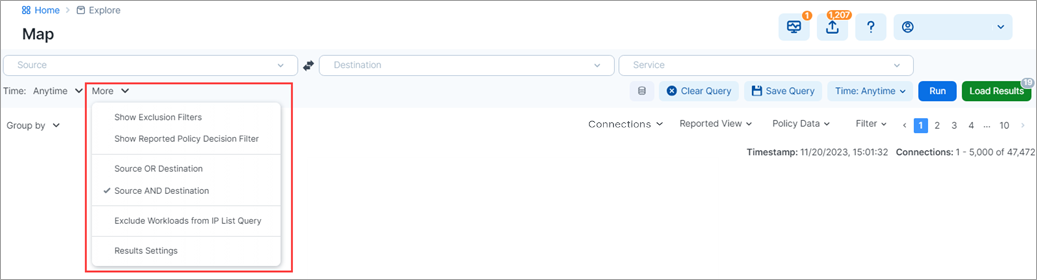
More menu
To modify the filters, open the More menu.
Note
The filters selected in previous sessions don’t persist unless you’ve added values to them. For example, the Exclusion filters won’t appear by default when you open the page unless you’ve explicitly excluded traffic in the past.
Tip
To search for traffic flows with a specific policy decision reported by the VENs, select the Show Reported Policy Decision Filter option. This option controls the type of policy decision (allowed, potentially blocked, blocked, or unknown) that the Traffic and Map views display.
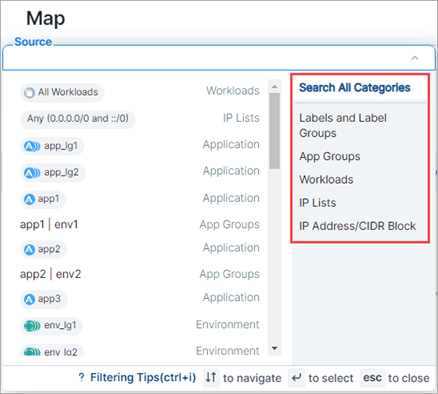
Source and Destination filters
Depending on the visualization tool, the Source and Destination filters include some or all of the following query options:
Search All Categories
Label and Label Groups
App Groups
Workloads
IP Lists
IP Address/CIDR Block
FQDN
Transmission
Selecting the Search All Categories option avoids the need to first enter a category in the filters.
The Label and Label Groups category restricts the Map to show only those entities that have the labels you enter in the filters. The filter does not filter the selected group. Only the connected groups are filtered.
From the Service drop-down list, search by port and protocol. You can select a specific protocol and the page allows you to search through all the services.
When you enter text in this filter, the PCE UI allows you to specify whether that text is a process name or a service. Once you make your selection, the UI reflects the option you chose.
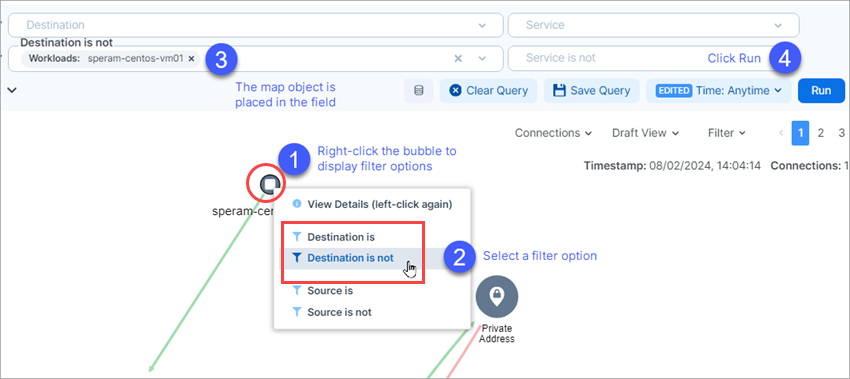
is/is not filter options
You can easily modify filter results using the "is/is not" options available in Traffic and Map views. These are useful when you're looking at search results and you want to easily modify the query by adding or removing filtering criteria.
Map view
Right-click a bubble on the map for the list of options to appear.
Select whether to include or exclude the data from the source or destination search fields.
Notice your selection populating the search field.
Click Run to see modified query results.
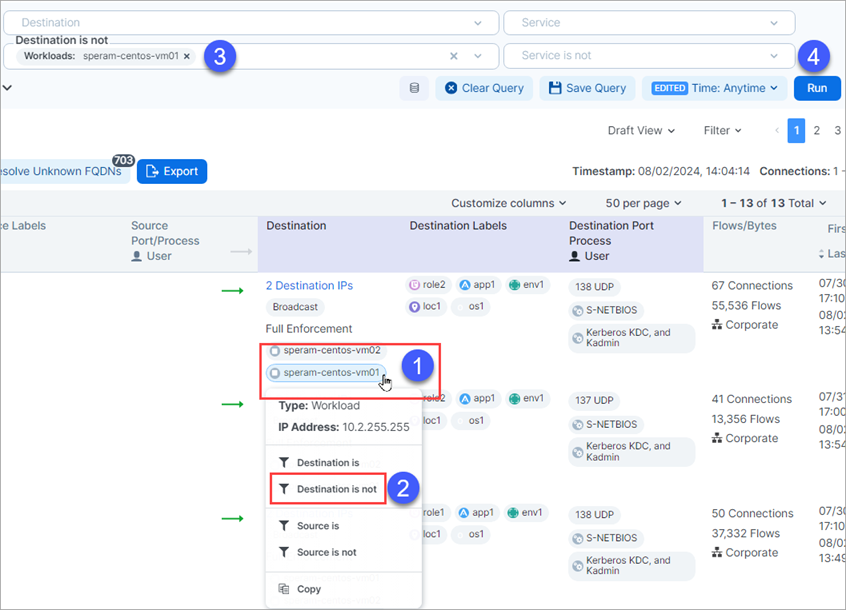
Traffic view
Tip
This feature also applies to pills on the Traffic tab available in the Map's details panel.
Mouse over any data pill for the list of options to appear.
Select whether to include or exclude the data from the source or destination search fields.
Notice your selection populating the search field.
Click Run to see modified query results.
Example Search Using Filters
Before you write policy rules to either allow or block traffic, you should determine if there are any traffic flows between them. For example, you might want to find traffic between Development or Testing environments from your Production environments.
For example, using the visualization tools, you can run the following query:
Find any traffic flows during the last week between my Development and Production environments, over any port except port 80, excluding any workloads that have a Role label named “Domain Controller.”
In the Explorecategory in the left navigation, go to Map, Traffic, Mesh, or App Groups.
Click More and select Show Exclusion Filters. Exclusion filters allow you to exclude criteria from a search.
From the Destination drop-down list, enter or select the Environment label named “Development."
From the Destination is not drop-down list, enter or select the Role label named “Domain Controller.”
From the Source drop-down list, enter or select the Environment label named “Production."
From the Source is not drop-down list, enter or select the Role label named “Domain Controller.”
Under Service, leave the Service field blank (which means “any”).
Under Service is not enter “80.”
Under Time, select Anytime.
Click Run.
Query Results in the Visualization Tools
In all views, the PCE limits the number of connections you can load per page in the PCE UI to 10,000. You can’t load your total number of connections in a single page. To handle this limitation, the PCE UI displays your connections in paginated results. To view all connections, you can paginate through your query results. For example, when you run a query that returns 200,000 traffic flows, you can paginate through your data to see all traffic flows.
To configure the maximum number of connections per page:
From the left navigation in the Explore category, click any visualization tool (except Reports).
Choose More > Results Settings.
Specify the maximum number of connections to display per page:
In the Displayed in Traffic field, configure the maximum number of results that can be retrieved from the PCE database and displayed per page in all views.
In the Returned from Database field, configure the results when the PCE is part of a Supercluster.
Important
Configuration for a Supercluster deployment does not apply to Illumio Core Cloud customers; you must be an Illumio Core On-Premises customer to configure your Illumio deployment as a Supercluster.
In a Supercluster, a query run on the leader PCE can return 200,000 results for each PCE in the Supercluster, including the leader. For example, in a Supercluster with four regions, the maximum results is 800,000, and in a standalone PCE, it is 200,000. When logged into a member PCE on a Supercluster, the limits are the same as for any SNC or MNC. In every case, the maximum number of results that can be shown in the PCE UI is 100,000 results. If more than 100,000 results are retrieved, the full results are available as a downloaded CSV file, and the first 100,000 are available in the PCE UI.
For more information about PCEs in a Supercluster configuration, see the PCE Supercluster Deployment Guide.
Click OK.
Load Results in Visualization Tools
As you run searches, the PCE caches your queries and saves them for a 24-hour period. Caching your query results is beneficial because the PCE displays pages quickly. To view and access your cached queries, click Load Results at the top-right corner of the page.
The load results process runs in the background to increase the speed that view pages display. Using this feature is optional, though recommended.
Switching between the Map and Traffic table doesn’t reload your data. Instead, the PCE UI switches immediately to that view.
V-E Scores Comparison Tool
(Available in PCE releases 24.2.10 and later)
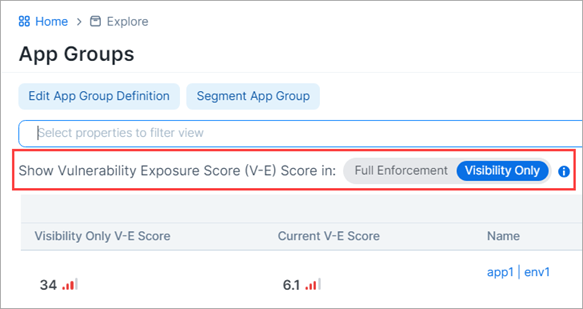
The Show Vulnerability Exposure (V-E) Score tool lets you see how the security of your app groups would change if you were to change their current enforcement mode. Columns in the Compare App Group V-E Scores by Enforcement Type list and details pages provide a side-by-side comparison of the effect different enforcement modes would have on Vulnerability and Exposure (V-E) scores. A toggle allows you to simulate the switch between Full Enforcement and Visibility Only enforcement modes.
For details, see Compare App Group V-E Scores by Enforcement Type.
About the Default Graph
In Core 22.5.x and earlier, the PCE cached the Illumination Plus queries (for the Map and Traffic tabel views) that you ran and saved them for 24 hours. Caching your query results allowed the PCE to display Illumination Plus pages quickly. To view and access your cached queries, you clicked Load Results at the top-right corner of the Map page. The Results page appeared.
Beginning in 23.2.0, if you don’t have a default graph in the PCE, the page below is your start page for the Map and Traffic pages.
When you click Start, the PCE creates a map or traffic table based on the values you have in the filters at the top of the page. The PCE saves this query with those filters as the default graph. The graph expires in 24 hours; however, the PCE saves the default graph as a scheduled report that runs every 24 hours (between 12:00 midnight and 8:00 AM).
Later, when you return to the Map or Traffic page, the PCE loads that saved default graph, unless you already have another graph (different filters) displayed. You won’t see this Start page again unless you delete the default graph.
When you open the Reports feature from the left navigation and select the Schedules tab, you see the scheduled report for the Default Graph.
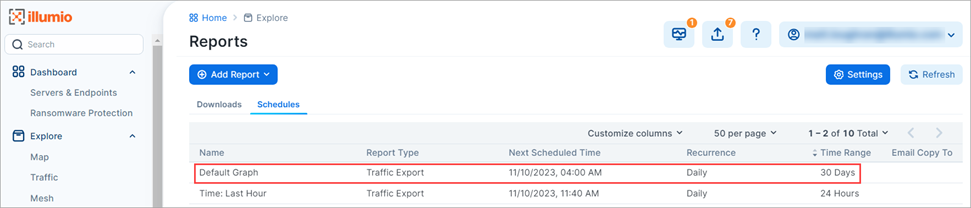
Important
Not all Illumio users can access the Default Graph scheduled report. You must have the correct Access permissions. See the PCE Administration Guide for information.
Tips for using the Default Graph
To change the query that the PCE runs for the Map and Traffic page:
Go to the Reports page and select a different saved query.
Delete the default graph by clicking Load Results in the Map or Traffic page and clicking Delete in the Load Results dialog box. Then, navigate to the Map or Traffic page so that the Start page appears. Click Start to create a default graph.
Click the Schedule Time field and select a new time to change when the default graph report runs each 24 hours. However, you must have the correct permission to edit the Default Graph (RBAC roles and permissions).
Asynchronous Queries
You can run asynchronous queries for your filters. You first set up your filters and then run an asynchronous query.
Asynchronous queries allow you to initiate multiple queries in parallel and view the results of the queries later. Going offline during a query does not result in lost query results. Whether you remain online or offline, the results of asynchronous queries will be preserved for a period of 24 hours. In addition, while a query is in progress, you can work in other areas of the product. You can export the query search results to either a comma-separated-value (.CSV) file or display them in the PCE UI. Depending on the size of the query, the results might take time to display.
In the visualization tools, you can run multiple queries and change or retain the default file name for exported results.
Multiple Queries: You can run multiple queries, including running some in the background.
If there is only one query, the results of that query will display when the query completes.
If there are multiple queries, you can select the result that you want to view by clicking the number beside the Load Results button.
If identical queries are run within a minute of each other, only one query will be processed. The results of the oldest query will be displayed.
Default File Name: The system assigns a default file name based on your query field names (Source, Service, or Destination) in the filter. The exported file will have the same name.
Giving filters a unique name will help you identify your filters when you want to rerun a query. This name will also appear as your report name.
You can also specify or change a filter name as needed.
Note
Handling Duplication Flows in Queries
A database query that spans multiple days can contain duplicate flows if the flow is repeated.
Run Asynchronous Queries
Asynchronous job queries are easy to initiate and can be run in parallel, which means that before the first query completes, a second query can be initiated. In the following example, two queries are initiated: the first, with Production-only entries, and the second, with Production and Staging entries.
From the left navigation, go to Map or Traffic from the Explore category.
Enter your query criteria in the fields. If you want to exclude criteria, select More > Show Exclusion Filters.
You can enter a Source, Destination, or Service, or merely indicate Production in the Destination column.
Click Run to begin the query process.
In the confirmation dialog box, click Hide.
Enter the next search criteria based on a new Destination; for example, Production and Staging.
Given support for asynchronous queries, you will see a number appear next to the Load Results button, indicating the number of simultaneous queries being processed
Note
Depending on the size of the queries, your second query could complete before your first query.
You will see the results of your two queries, one with Production-only entries and a second with Production and Staging entries.
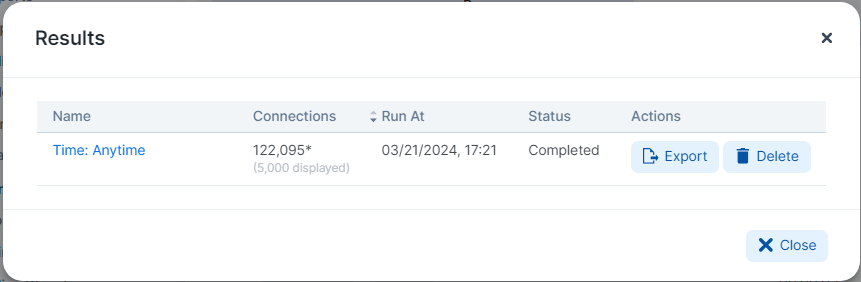
At any time, can click the Load Results button to view what queries were run.
Viewing results from past queries will not re-initiate a query. It displays cached query results. When you select a result, notice that the filter changes automatically, and displays new results.
Global Queries for Superclusters
Important
Configuration for a Supercluster deployment does not apply to Illumio Core Cloud customers; you must be an Illumio Core On-Premises customer to configure your Illumio deployment as a Supercluster.
Global queries leverage the capabilities of asynchronous job queries for every region in a Supercluster. When you have a Supercluster and you initiate a query from the Supercluster leader, the Table displays results from all its PCE members. Queries run from a Supercluster member only show flows reported by VENs paired to that member.
Note
In a Supercluster, a query run on the leader PCE can return 200,000 results for each PCE in the Supercluster, including the leader. For example, in a Supercluster with four regions, the maximum is 800,000, and in a stand-alone PCE, it is 200,000.
When logged in to a member PCE on a Supercluster, the limits are the same as for any SNC or MNC. In every case, the maximum number of results that can be shown in the PCE UI is 100,000 results. If more than 100,000 results are retrieved, the full results are available as a downloaded CSV file, and the first 100,000 are available in the PCE UI.
View Menu
Important
The View menu is available only in the Map and Traffic pages. There is no Draft View for the Mesh; Mesh only displays traffic flows in Reported View.
When used with the options in the adjacent Filter drop-down, the View menu allows you to configure how the PCE UI displays your traffic data so you can see the connections between your groups with greater flexibility. The options on this menu are unaffected by how you've grouped traffic in your Map and Traffic pages.
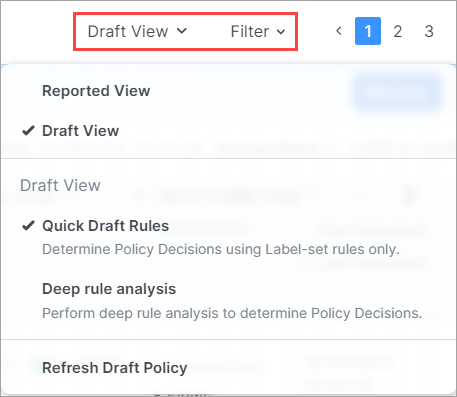
The View menu provides the following options:
Reported View
For a description, see Reported View below.
Draft View
For a description, see Draft View below.
Quick Draft Rules
This option provides a fast way to analyze your environment and display results in your views because it determines policy decisions based on label-set rules only.
Deep Rule Analysis
This option returns additional rulesets that the Quick Draft Rules option won’t detect. However, due to the deeper analysis it performs, results may display more slowly than they do when you use Quick Draft Rules. This option finds any rules written directly for workloads versus rules created by using labels. It can combine two rules that use IP lists; for example, workload “A” has connections to IP addresses in an IP list (“IP list B”). IP list "B" connects to another workload "C." Deep analysis reveals when rules have been optimized so that workload A can connect to workload C.
Refresh Draft Policy
This option allows you to refresh Draft View in the PCE UI to make sure it depicts how flows known to the PCE would be handled if traffic were subjected to a provisioned policy. This is typically necessary if you've changed your policy after it was last calculated.
Reported View
Reported View helps you understand the traffic patterns in your environment by showing the current state of your provisioned policy as reported by your workloads. It shows how traffic is being handled currently (versus the “what-if” or projected view provided by Draft View).
Note the following about Reported View:
Reported View is a read-only view. So, while you can view all the policies (rulesets) that apply to your workloads, you must change to Draft View to add rules from the Map.
Reported View loads more quickly than Draft View, especially when you have a large number of workloads and traffic flows.
Reported View always shows the actual action the VEN took on the traffic. For example, traffic from a managed workload to an unmanaged workload is accurately depicted in Reported View, whereas Draft View may not model all traffic projected to flow to unmanaged workloads.
For Reported View to show the latest changes to your policy, all of the following steps must have occurred:
You've updated your policy in a way that alters one or more flows that are subject to the policy.
You've provisioned the updated policy.
Traffic has then flowed through the connections defined by the updated policy and has been reported from the VEN.
For each flow with a unique port/protocol, if there is a policy service created for that port/protocol, the name of that policy service displays in addition to the names of the actual services that reported the flows. Reported View shows reported rule coverage for the latest reported flow with that port/protocol in the right side panel.
Different services can be running on the same port at different times or on different interfaces. Reported View shows reported rule coverage of each flow separately as well as its timestamp. In both cases, Draft View shows the calculated rule coverage for traffic. For Windows, it looks at the port, protocol, the process name (but not the process path) and the Windows service name. For Linux, it looks only at the port and protocol.
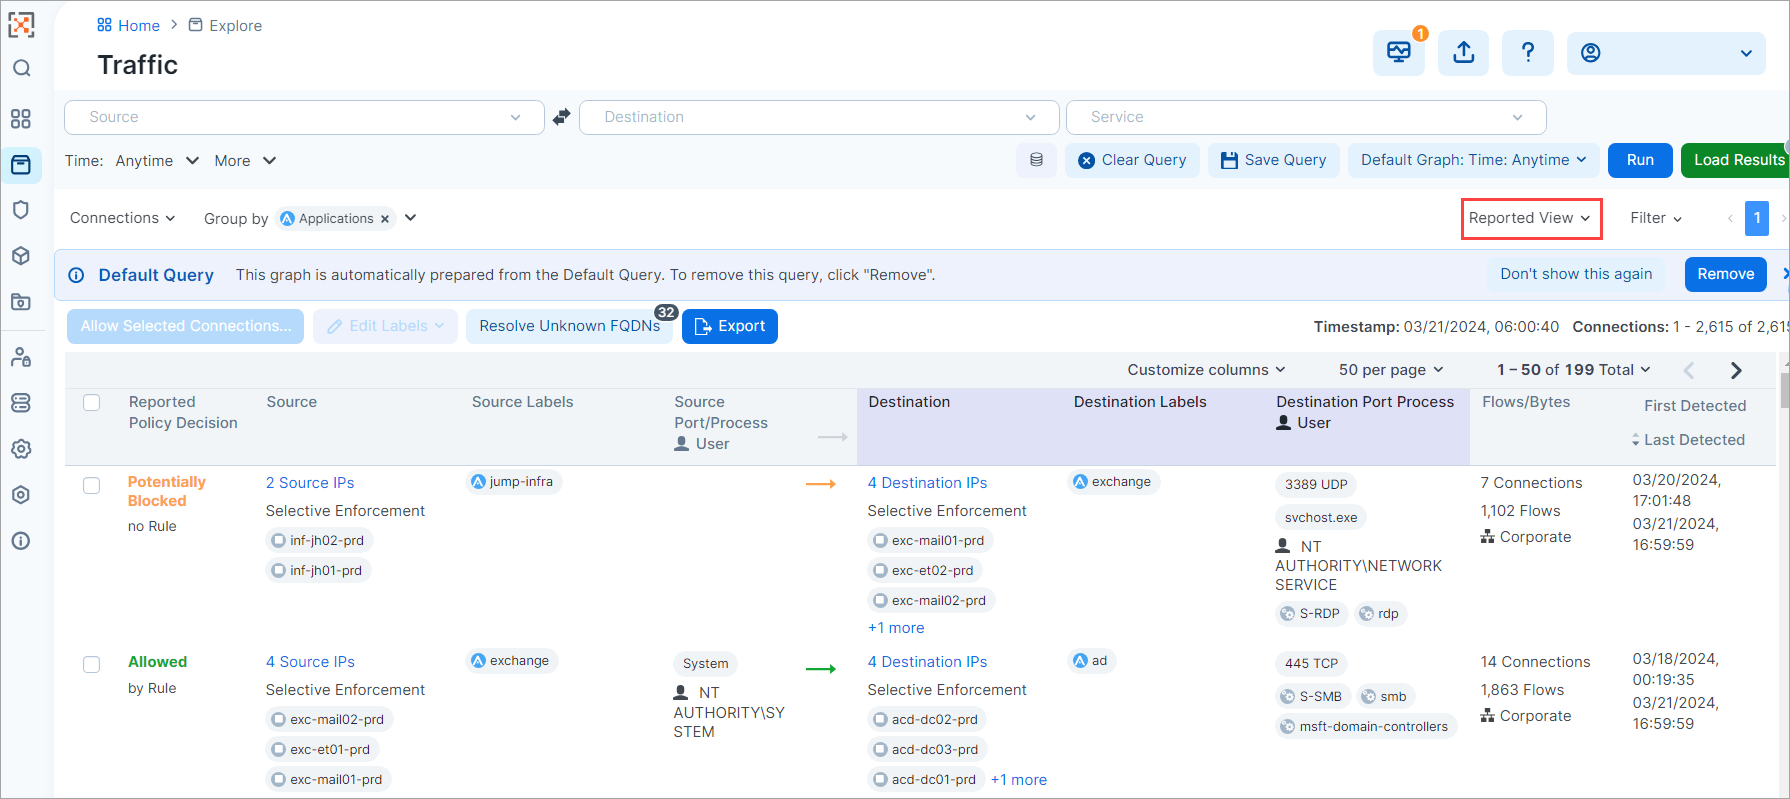
Reported View (Traffic)
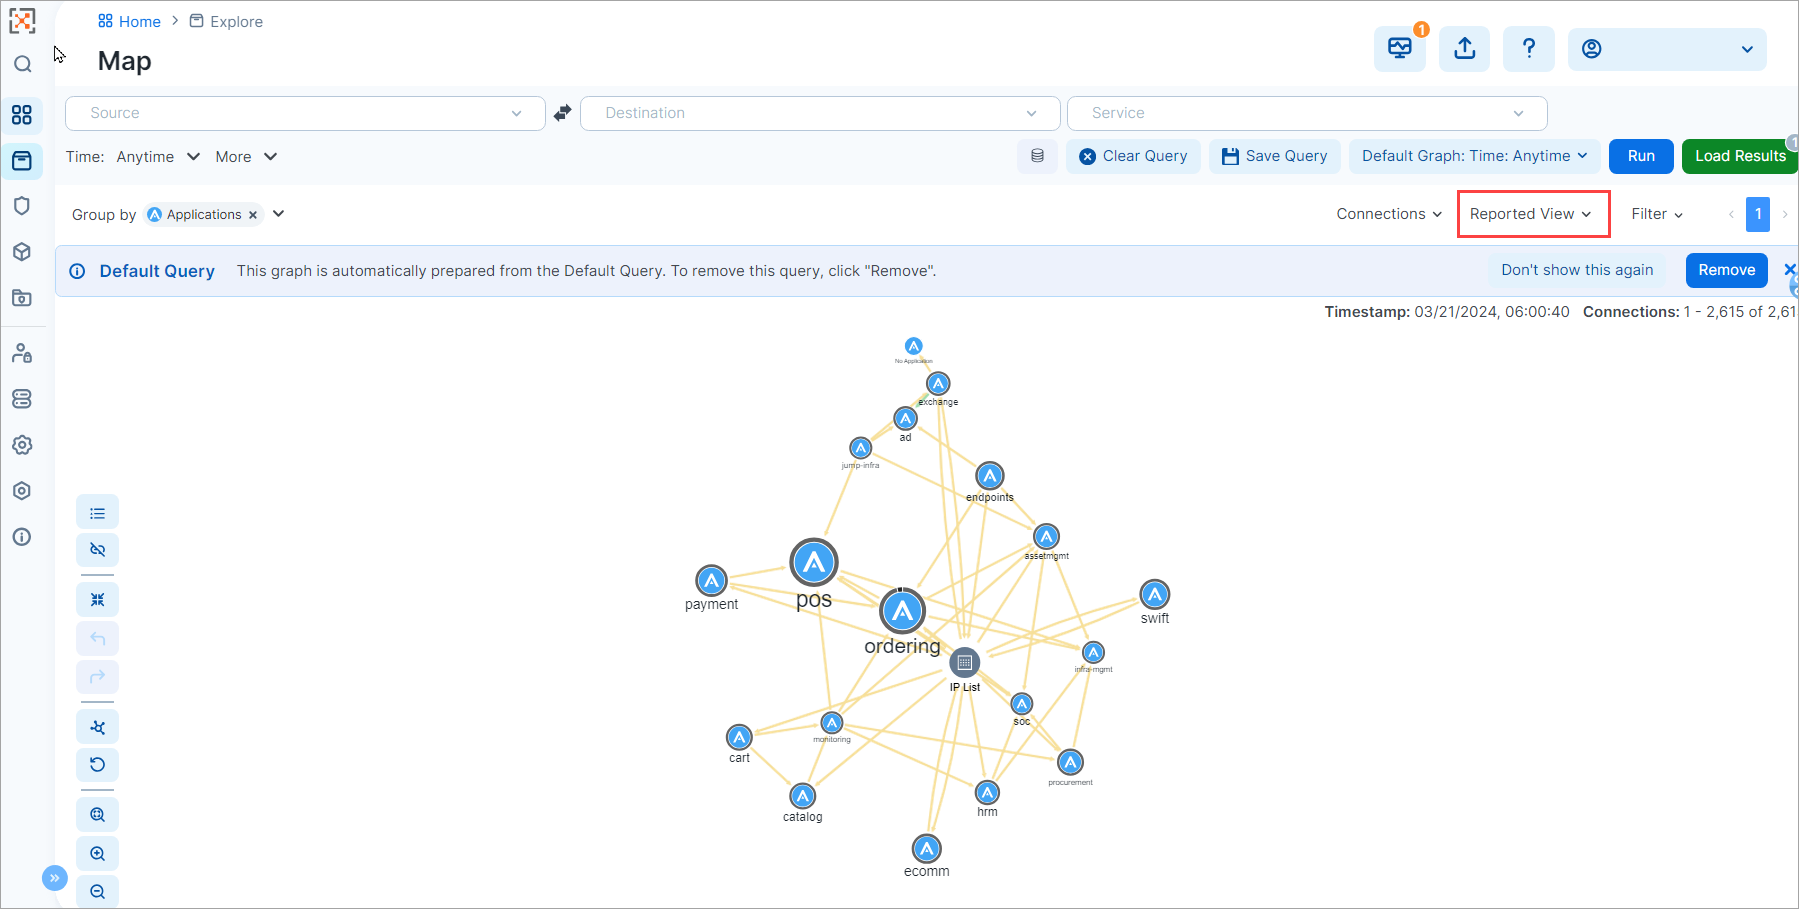
Reported View (Map)
Draft View
Draft View is a modeling tool that depicts how flows known to the PCE would be handled if subjected to a provisioned policy. Draft View is the result of a “what-if” analysis performed by the PCE. Contrast this with Reported View which shows the current state of your provisioned policy as reported by your workloads (also termed the "active" policy).
Because Draft View is a composite of both active policy and potential future (draft) policy, the PCE has to compute traffic flows for both. For this reason, Draft View can take longer to load than Reported View, especially when your organization has deployed a large number of workloads and traffic flows.
Draft View supports adding allow rules and unmanaged workloads from the Map (not supported in Reported View). This allows you to immediately see, from the context supplied by the Map, how these additions would impact the active policy if provisioned and subjected to the policy. You can further modify the view using options available in the adjacent Filters drop-down menu.
The Refresh Draft Policy option in the View menu lets you refresh Draft View to make sure it depicts how flows known to the PCE would be handled if traffic were subjected to a provisioned policy. This is typically necessary if you've changed your policy after it was last calculated.
Limitations of Draft View
In most cases, Draft View accurately depicts what will be allowed or blocked by the VEN when traffic is subjected to a provisioned policy, so it's highly useful for verifying policy updates before you provision them. However, Draft View's policy modeling might not be entirely accurate for the following types of rules configured on the PCE:
Process-based rules: Process-based rules are written using the process name or service name that sends or receives the traffic on the workload.
User-based rules: User-based rules allow administrators to leverage the Microsoft Active Directory User Groups to control access to computing resources.
Custom iptables rules: Custom iptables rules are configured on each workload and can include processes that are not known to the PCE.
System rules: The VEN has implicit rules to permit necessary traffic (for example, rules permitting DHCP and DNS outbound traffic on the workload).
IP List that includes unmanaged workloads: Reported View and Draft View differ in the way each will display how traffic flows to an unmanaged workload in the following case:
If your policy contains a rule allowing traffic from a managed workload to an IP List that includes an unmanaged workload, then:
Reported View: Traffic from the managed workload's VEN to the unmanaged workload will be depicted as Allowed.
Draft View: The same traffic will be shown as Denied because Draft View will model the traffic as though the unmanaged workload is managed.
Customize Columns
You can customize columns in the following areas using the Customize columns menu:
Explore > Traffic
Servers & Endpoints > Workloads
You can further customize most columns by selecting the data that you want to appear within them. Mouseover the up and down arrows to the left of a column checkbox and select or deselect data within that column:
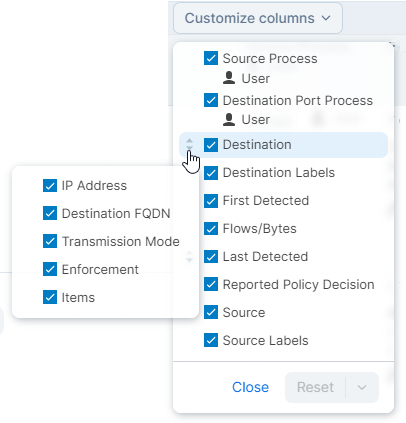
Customizing columns in this way doesn't impact how you create your rules or the data that they contain.
How the Map Works with FQDNs
The visualization tools map the outbound connections from workloads to unknown IP addresses to fully qualified domain names (FQDNs) or DNS-based names. For example, the Map could display that the outbound connections from a workload are going to maps.google.com instead of 100s of different IP addresses. The FQDNs used are reported by the VEN to the PCE in the flow summaries. The VEN learns about the FQDNs by snooping the DNS responses on the workloads, which is the FQDN for the IP addresses as seen by the workloads.
The Map visualizes the workloads that form logical groups (based on labels attached to workloads) and provides an understanding of the traffic flows between workloads.