Work with Vulnerability Maps
The Vulnerability Map is a separately licensed feature of Illumio Core. The licensing is based on the number of workloads. The license is required to import Qualys report data into the Illumio PCE.
For information about obtaining the Illumio Core Vulnerability Map license, contact Illumio Customer Support.
Enable the Vulnerability Map
When you obtain the license, you will receive information about how to apply the license on the PCE and enable the feature.
After the Vulnerability Map is enabled, access it from App Groups > Map as described in View and Mitigate Vulnerabilities.
Note
The Vulnerability Map is supported for VEN versions 16.9 and later.
Caveats
A maximum of 100,000 vulnerabilities can be detected per organization.
A maximum of 100 vulnerabilities can be detected per workload.
The Vulnerability Map is not supported in Supercluster implementations.
The exposure score is calculated on the first firewall sync for a given workload. When a PCE is restarted:
Vulnerability Score and Exposure Score are not available until the firewall sync occurs.
The scores are not available when a workload is offline.
Vulnerabilities can only be imported using the PCE CLI Tool.
View and Mitigate Vulnerabilities
The Vulnerability Map in your PCE is disabled by default. Vulnerability information is available for traffic flows, workloads, roles, and App Groups.
To view and mitigate vulnerabilities:
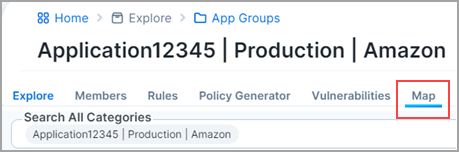
In the left navigation, under Explore, click App Groups.
Click an App Group in the list.
Click the Map tab.
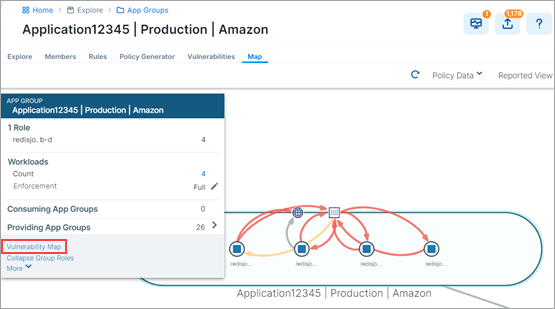
On the Map, click on the App Group.
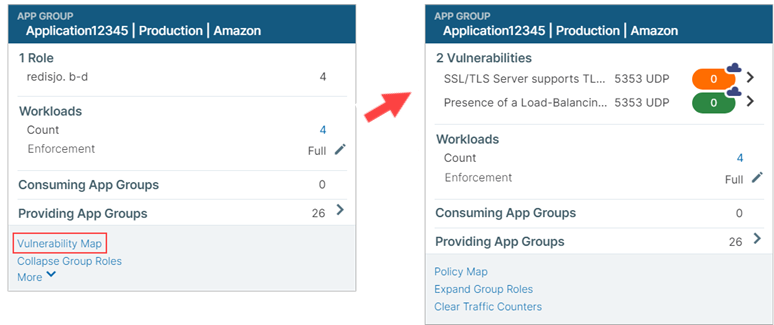
From the command panel, click Vulnerability Map.
The command panel shows the different vulnerability exposure scores for the selected App Group based on the ports, protocols, and workloads to which it is exposed. It is overlayed with the App Group Map. You see the Destination and Source App Groups and the vulnerable applications that are being accessed.
Note
The Cloud icon denotes Northern Exposure.
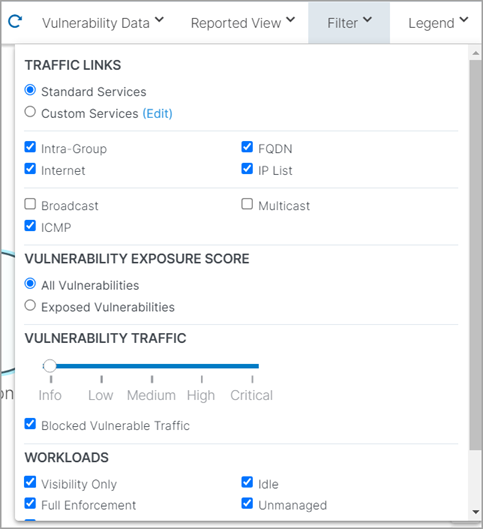
To refine how you view the vulnerabilities for the selected App Group, select the Filter in the top-right corner of the map.
The Filter includes settings for viewing Vulnerability Exposure Score and Traffic. Use the slider to change the criticality of the vulnerabilities you want to view.
After identifying the vulnerabilities, you can mitigate them by writing a security policies to reduce the risk to your datacenter .
Click the Policy Generator tab above the Map.

In Policy Generator, click either Replace Intra-Scope Rules or Start with Intra-Scope.
select Auto level to automatically generate policy and set the Severity (slider) to the level of vulnerabilities that you want to constrain to.
Note
To see the Auto Level option, you must first import the vulnerability license and vulnerabilities.
Auto Level allows you to write broad rules while minimizing the vulnerability exposure:
Roles with no vulnerabilities: Role < All Services < All Workloads
Roles with traffic to vulnerabilities: Role < All Services < Role
Roles without traffic to vulnerabilities: Role < Specified Services < Role
You can also see the number of vulnerabilities for each workload:
Reduced: Exposure to the port is minimized to a reduced set of workloads, which still keep your applications up and running.
Eliminated: The port is not exposed to any other workload.
You can pick and choose the flows for which you want to include the policy.
Complete the fields in the Policy Generator wizard.
The Preview Rules page shows the before and after Vulnerability Exposure Scores, where:
Before includes: Current provisioned policy
After includes: All draft policy
Click Save after reviewing your policy.
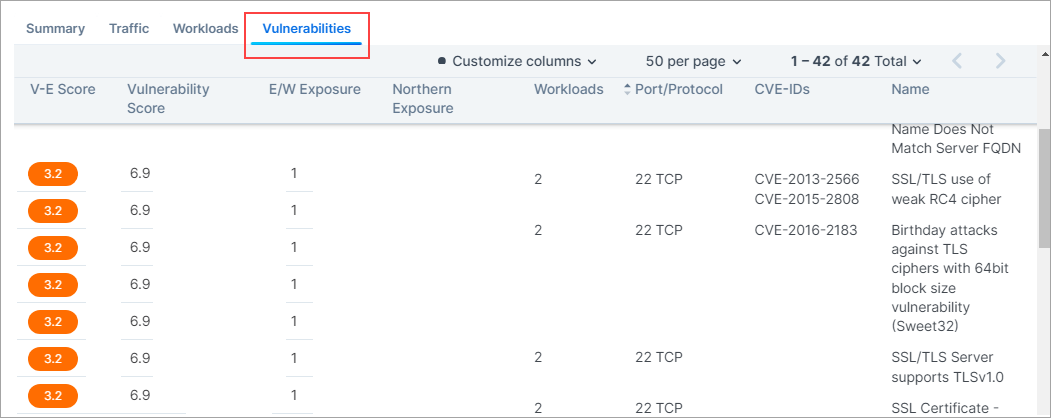
Vulnerabilities Tabs
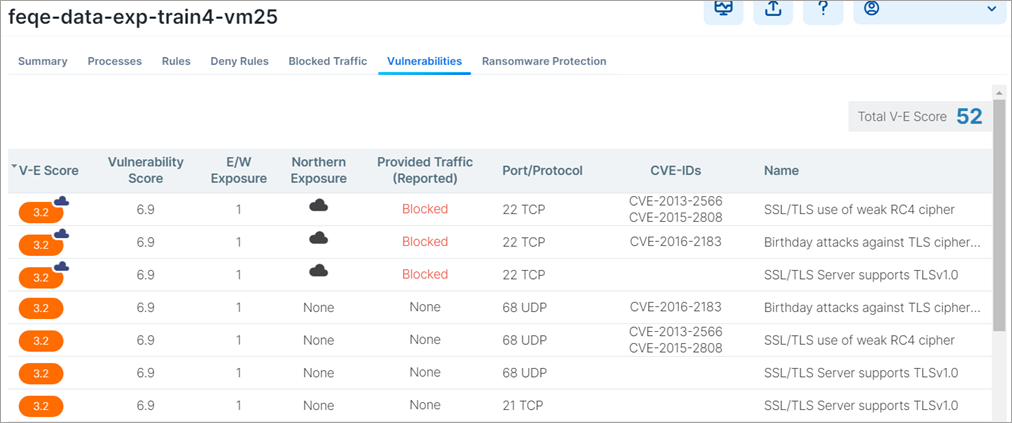
A Vulnerabilities Tab is provided in the Workload Details page, the App Groups page, and in the Map. In each location the tab displays risks due to vulnerabilities. The workload or App Group with the most vulnerabilities appears at the top of the list. You can sort the V-E score column by vulnerability score. You can then define your patch priority based on the most critical score.
You can see the highest severity type for the workload and the total number of vulnerabilities associated with the workload. The port and protocol is mapped to a vulnerability (if it exists). All vulnerabilities for the workload are sorted in order of severity. The following information is provided:
Total V-E score of the workload
V-E score of the highest accessible network port of the workload
Vulnerability score of the most severe network accessible vulnerability on the workload
East-West exposure. This score is recalculated whenever the rules associated with the workload are changed.
Internet exposure
Type of traffic on that port
Name of the vulnerability
In Workload Details
Click Workloads in the left navigation.
Click a workload in the Workloads List page.
Click the Vulnerabilities Tab on the workload's details page.
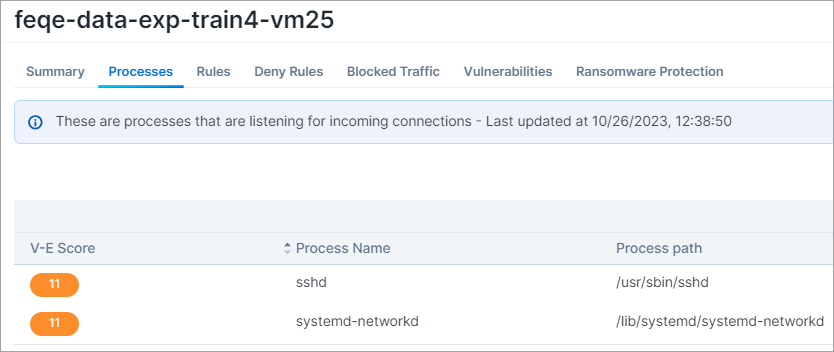
On the Workload Details page, the Processes tab shows the V-E score of each process that is communicating over the network port.
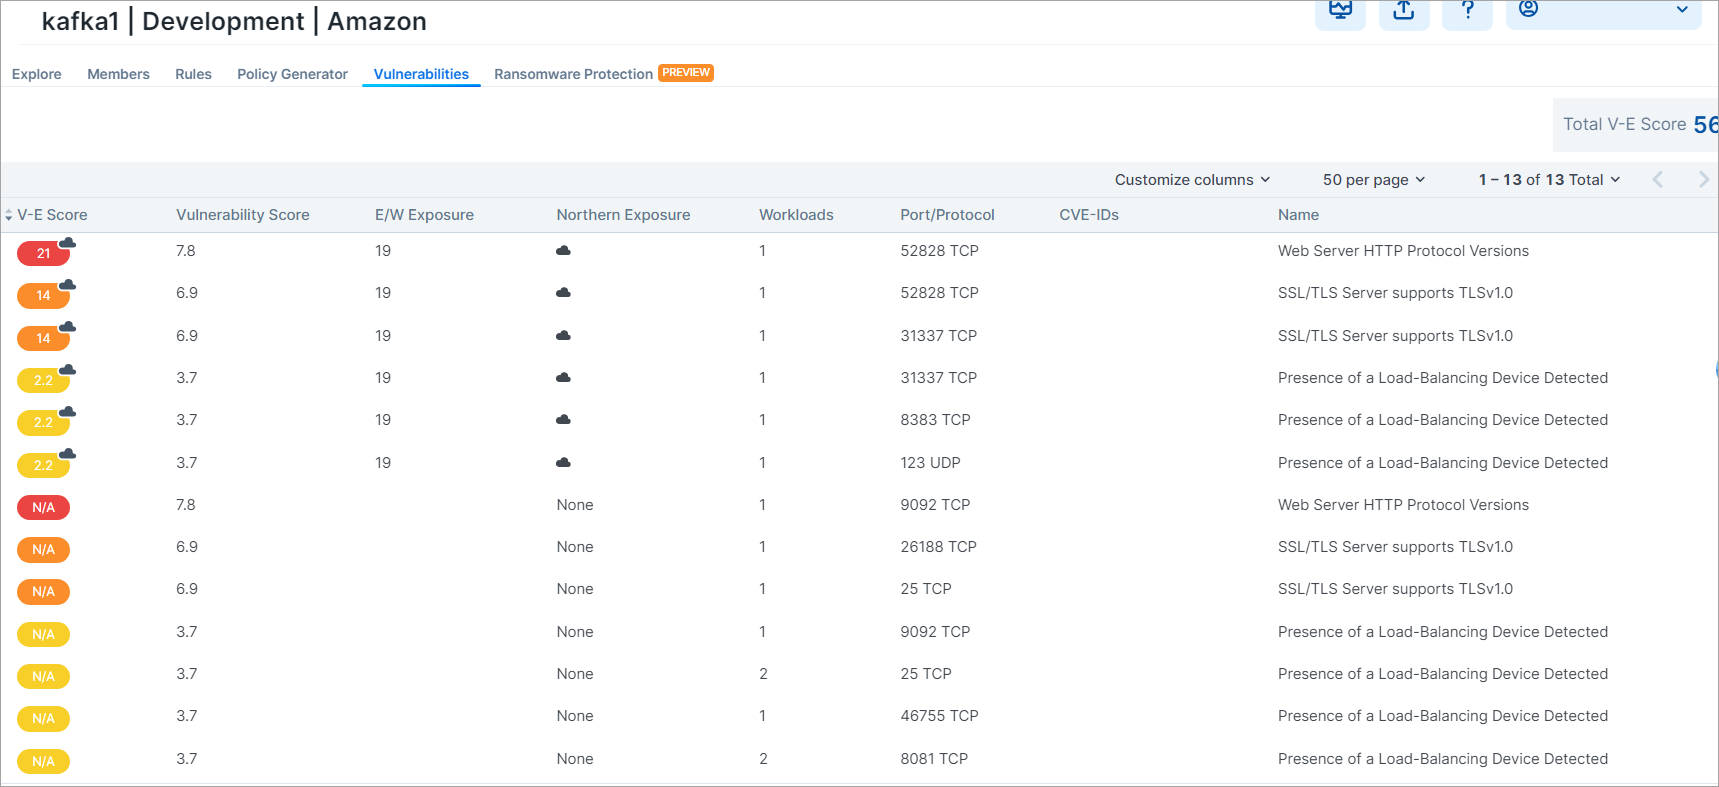
In App Groups
Click App Groups in the left navigation.
Click an App Group in the App Groups List page.
Click the Vulnerabilities Tab on the App Group's details page.
In the Map
Click Map in the left navigation.
Use the fields and/or the Group by feature to select the objects you want to visualize.
Click a node on the map to open the right panel.
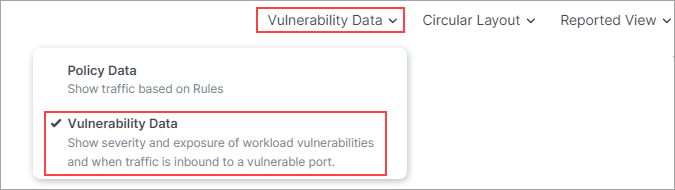
In the drop-down selector above the panel, select Vulnerability Data mode.
Click the Vulnerabilities Tab in the panel.