Endpoint Dashboard
Endpoint widgets on the Servers & Endpoints dashboard provide broad information to help you focus on the data you are interested in.
Working with the Endpoint Dashboard
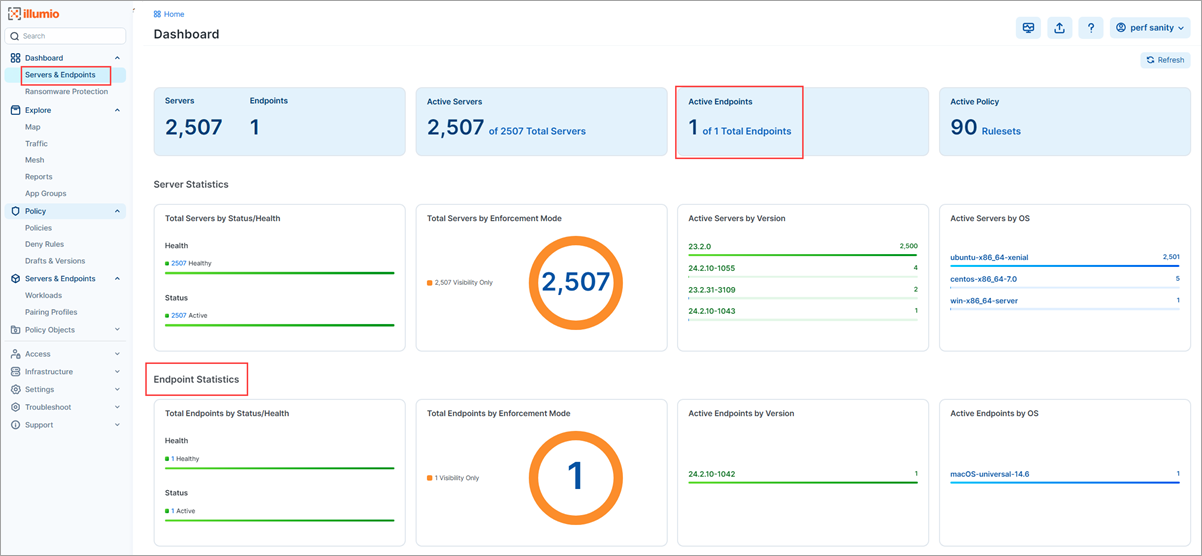
To access Dashboards, click Dashboard > Servers & Endpoints in the left menu.
The Endpoint Dashboard uses an API to aggregate various data from the system. For more information about the API support, see Endpoint Dashboard APIs in the REST API Developer Guide.
Note
Only the following two user roles are allowed to use the Endpoint Dashboard:
Global Org Owners
Global Administrators
Endpoint Statistics
The Endpoint Statistics section of the Dashboard contains several widgets to display summary statistics or status. To get fresh data, click Refresh at the upper right corner of the page. To see more details, click the widget and the list page appears.
Total active Endpoints (located at the top of the page)
Total Endpoints by Status/Health
Status (stopped, suspended, uninstalling, and active statuses)
Health (error, warning, and healthy)
Total Endpoints by Enforcement Mode
Idle
Visibility only
Selective Enforcement
Full
Active Endpoints by Version
Active Endpoints by operating system (OS)