About the Illumio App for Splunk
The Illumio App for Splunk integrates with the Illumio Policy Compute Engine (PCE) to provide security and operational insights into your Illumio secured data center. A dashboard view displays an overview of the security posture of the data center.
With improved visibility of east-west traffic, Security Operations Center (SOC) staff can detect unauthorized activity and potential attacks from traffic blocked by Illumio segmentation policy on workloads in "Enforcement" mode. Additionally, the Illumio App for Splunk provides visibility into potentially blocked traffic for workloads in "Test" mode. SOC staff can quickly pinpoint potential attacks and identify workloads with a significant number of blocked flows.
Distributed Splunk Architecture
The app only needs to be installed on the search tier of a distributed Splunk installation.
Dashboards
The Illumio app provides multiple dashboards to visualize important data from the Illumio PCE.
Security Operations Dashboard
The Security Operations dashboard provides an overview of the PCE security posture, allowing Splunk admins to monitor the state of the network at a glance.
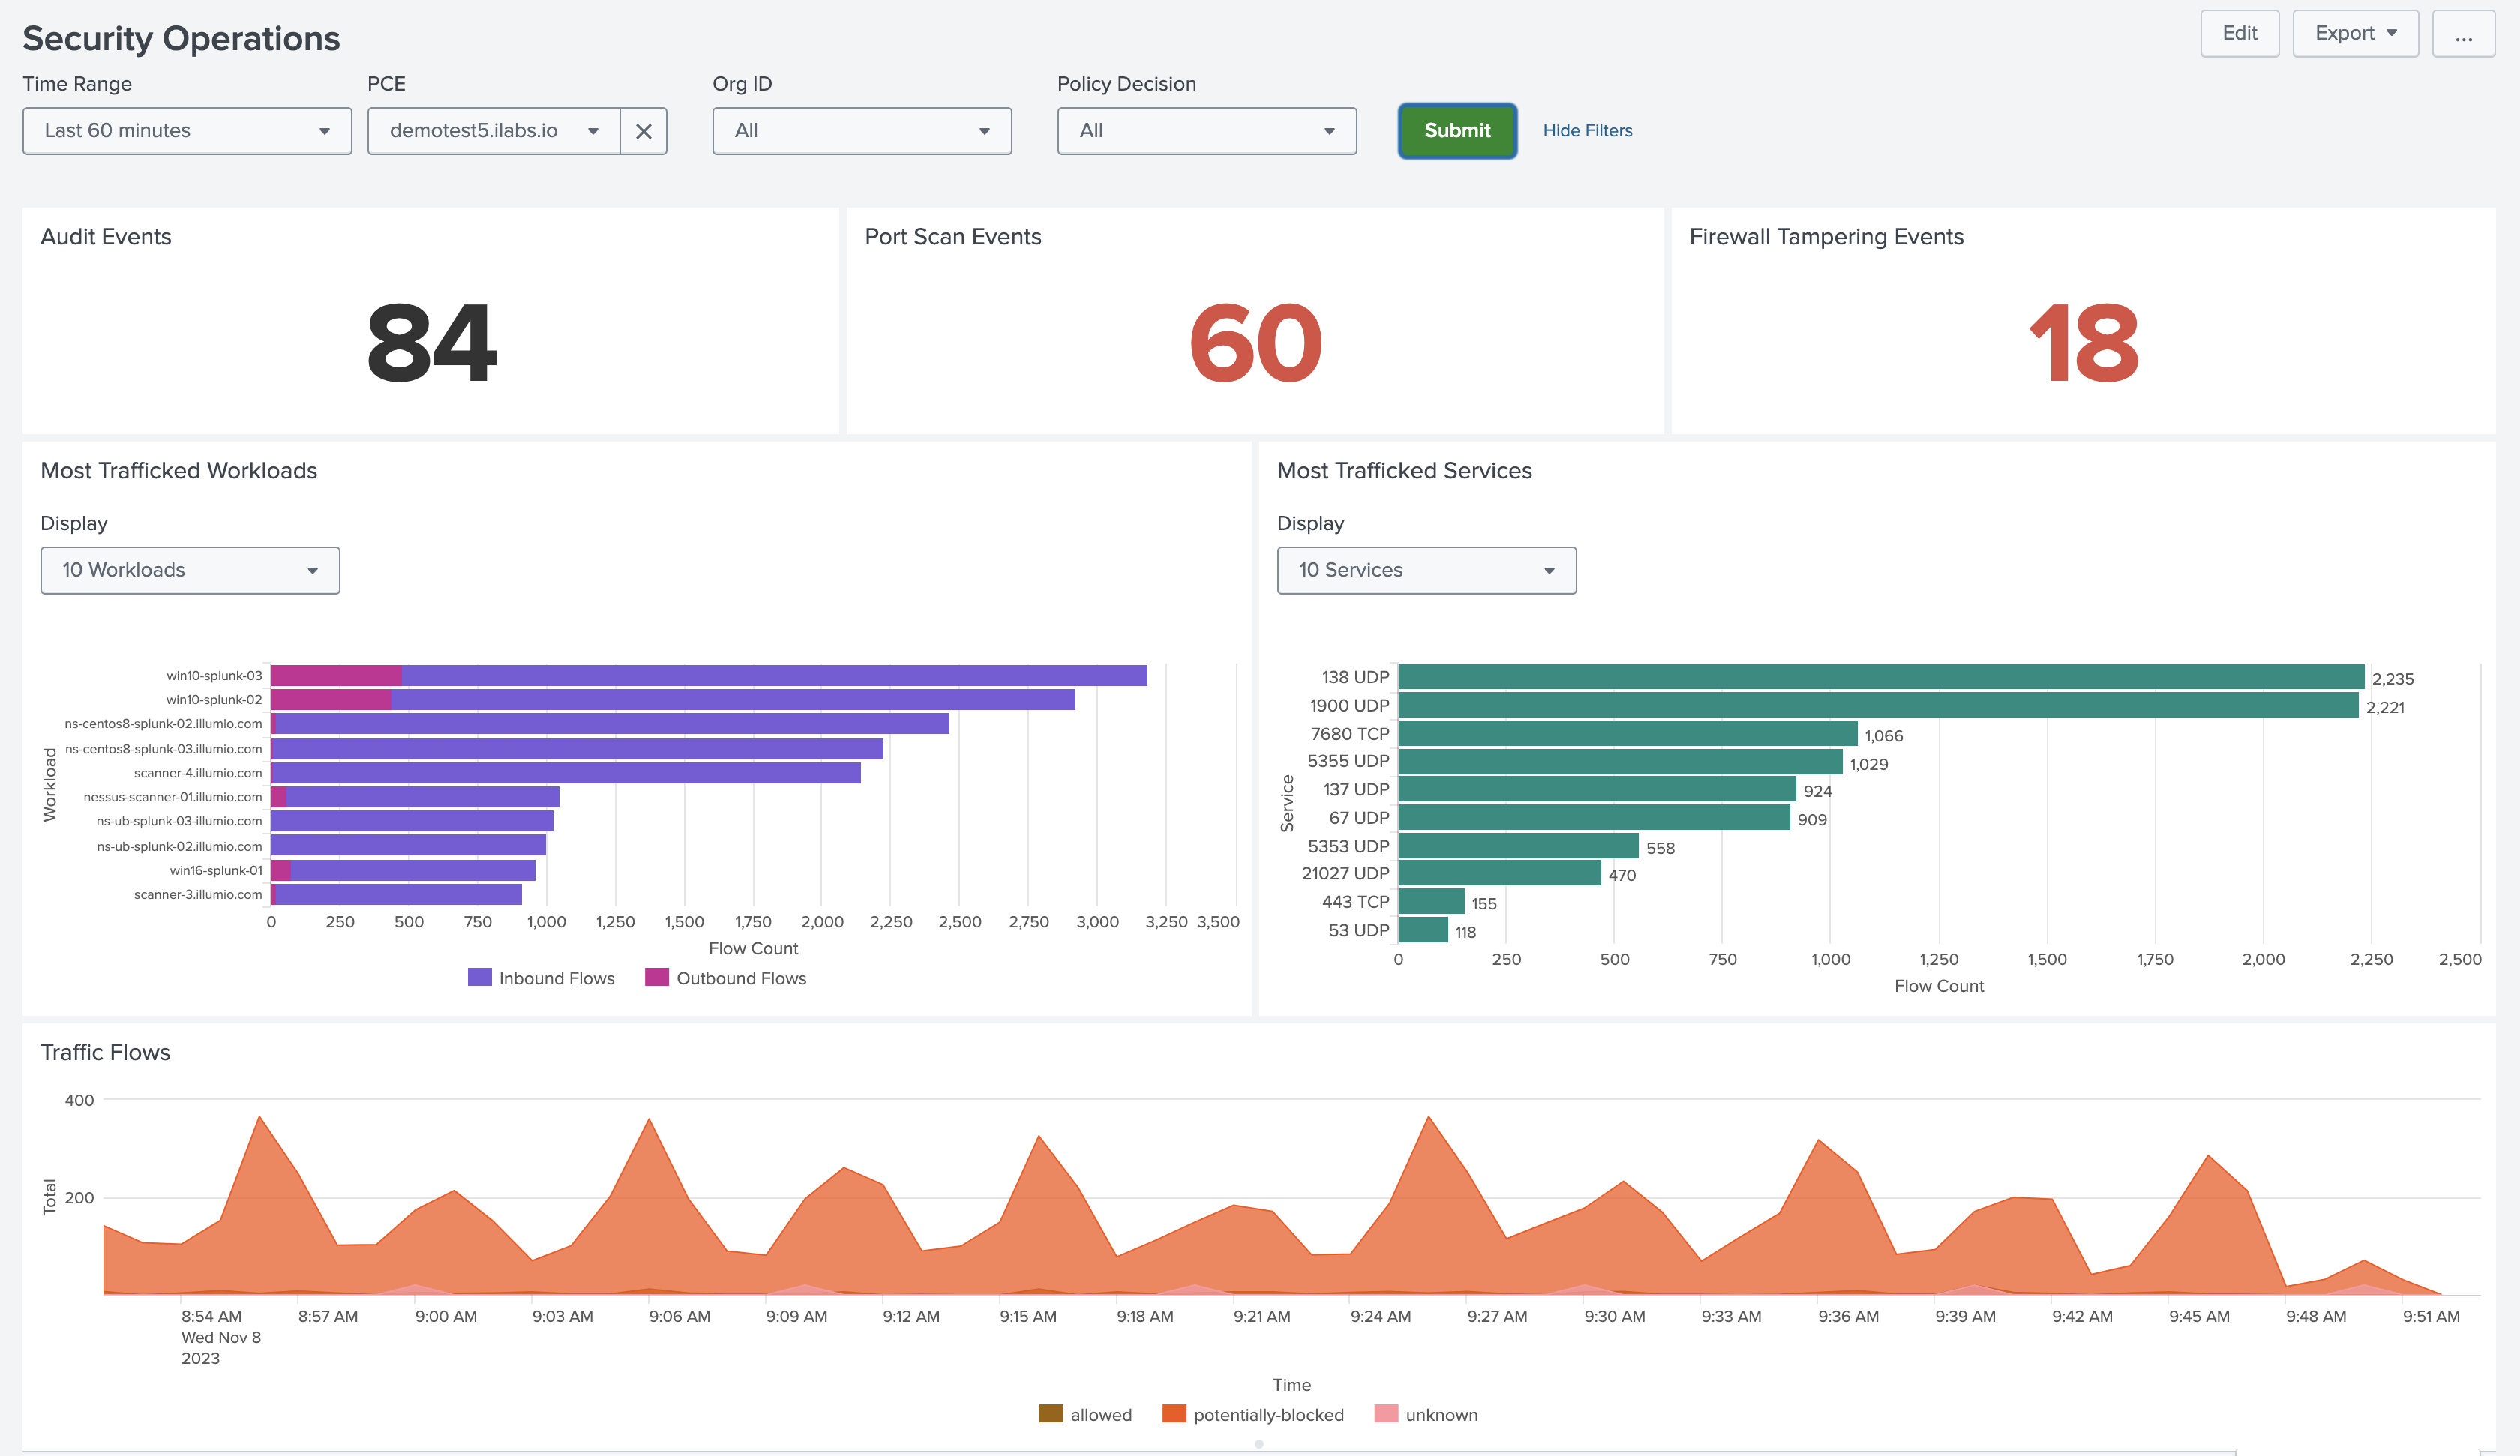 |
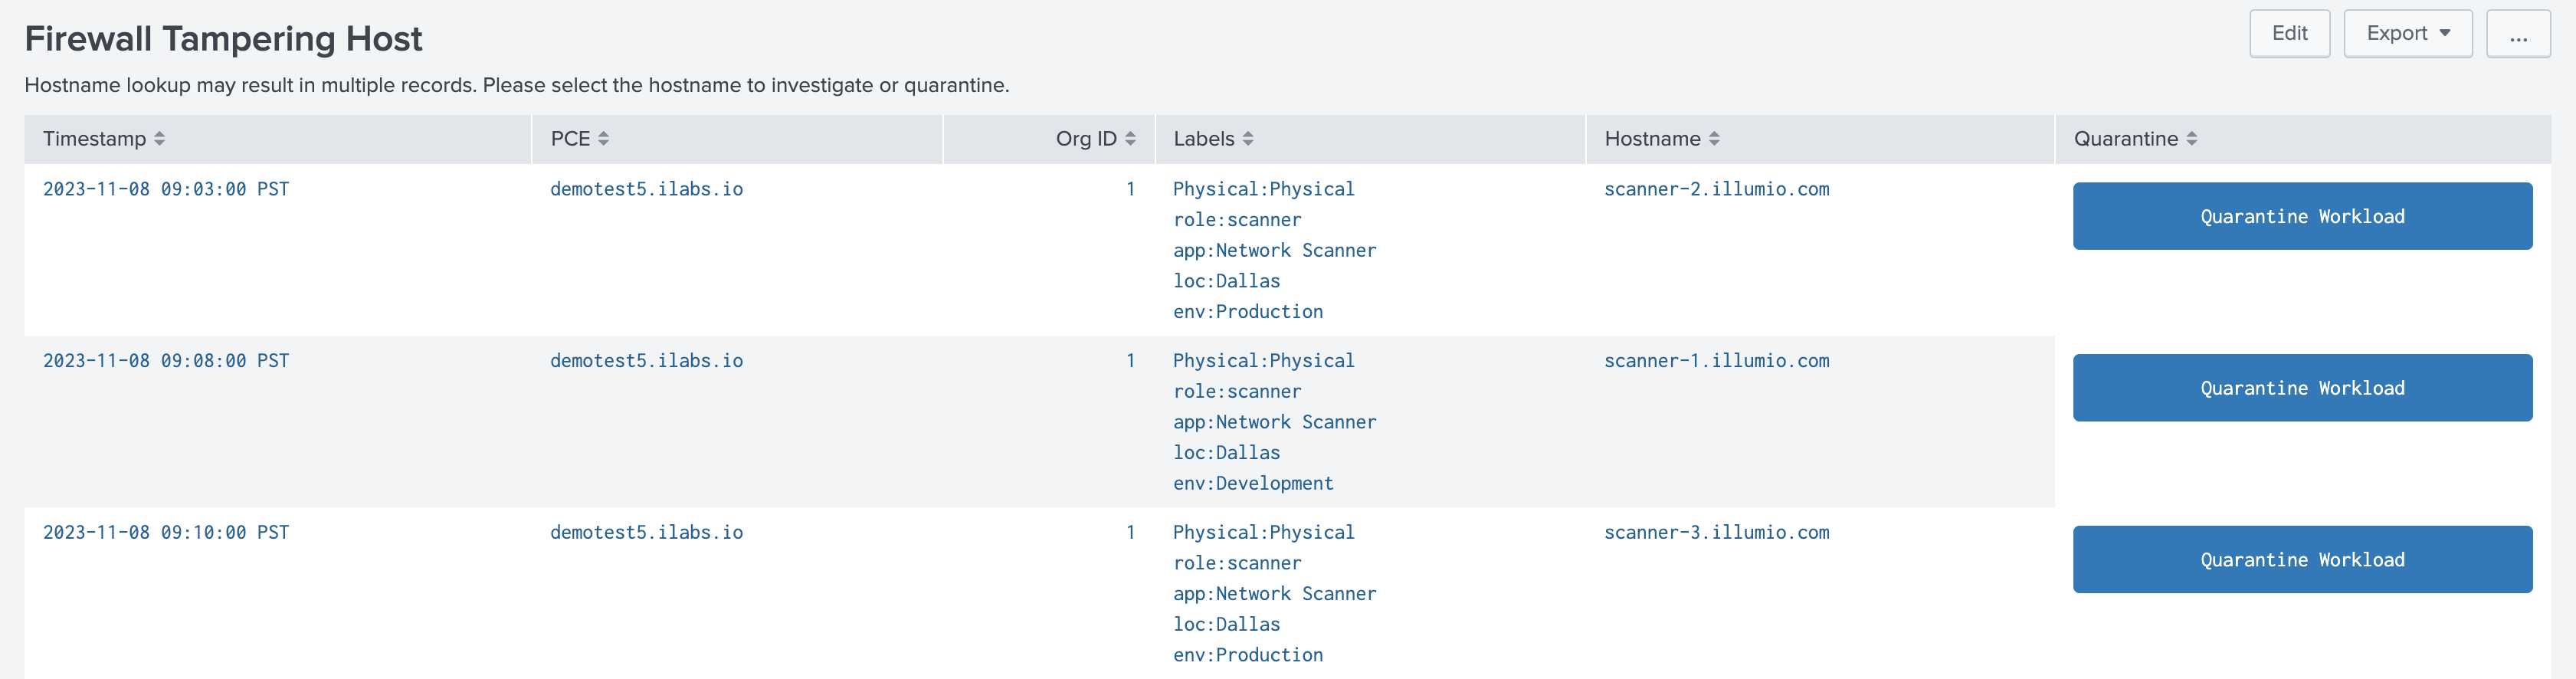
The Port Scan Events and Firewall Tampering Events panels provide drill-down into detailed views of potentially compromised workloads. From these views, the triggering events can be investigated, and the devices can be quarantined using the Illumio Quarantine alert action.
Note
Only users with the illumio_quarantine_workload role can trigger the quarantine action. Also, note that when the Illumio Quarantine action is performed, the workload will lose all labels and the action will apply the labels that were originally configured on the Illumio Data Input. The past labels are overwritten to avoid triggering policy rules and to maintain the Quarantine action.
 |
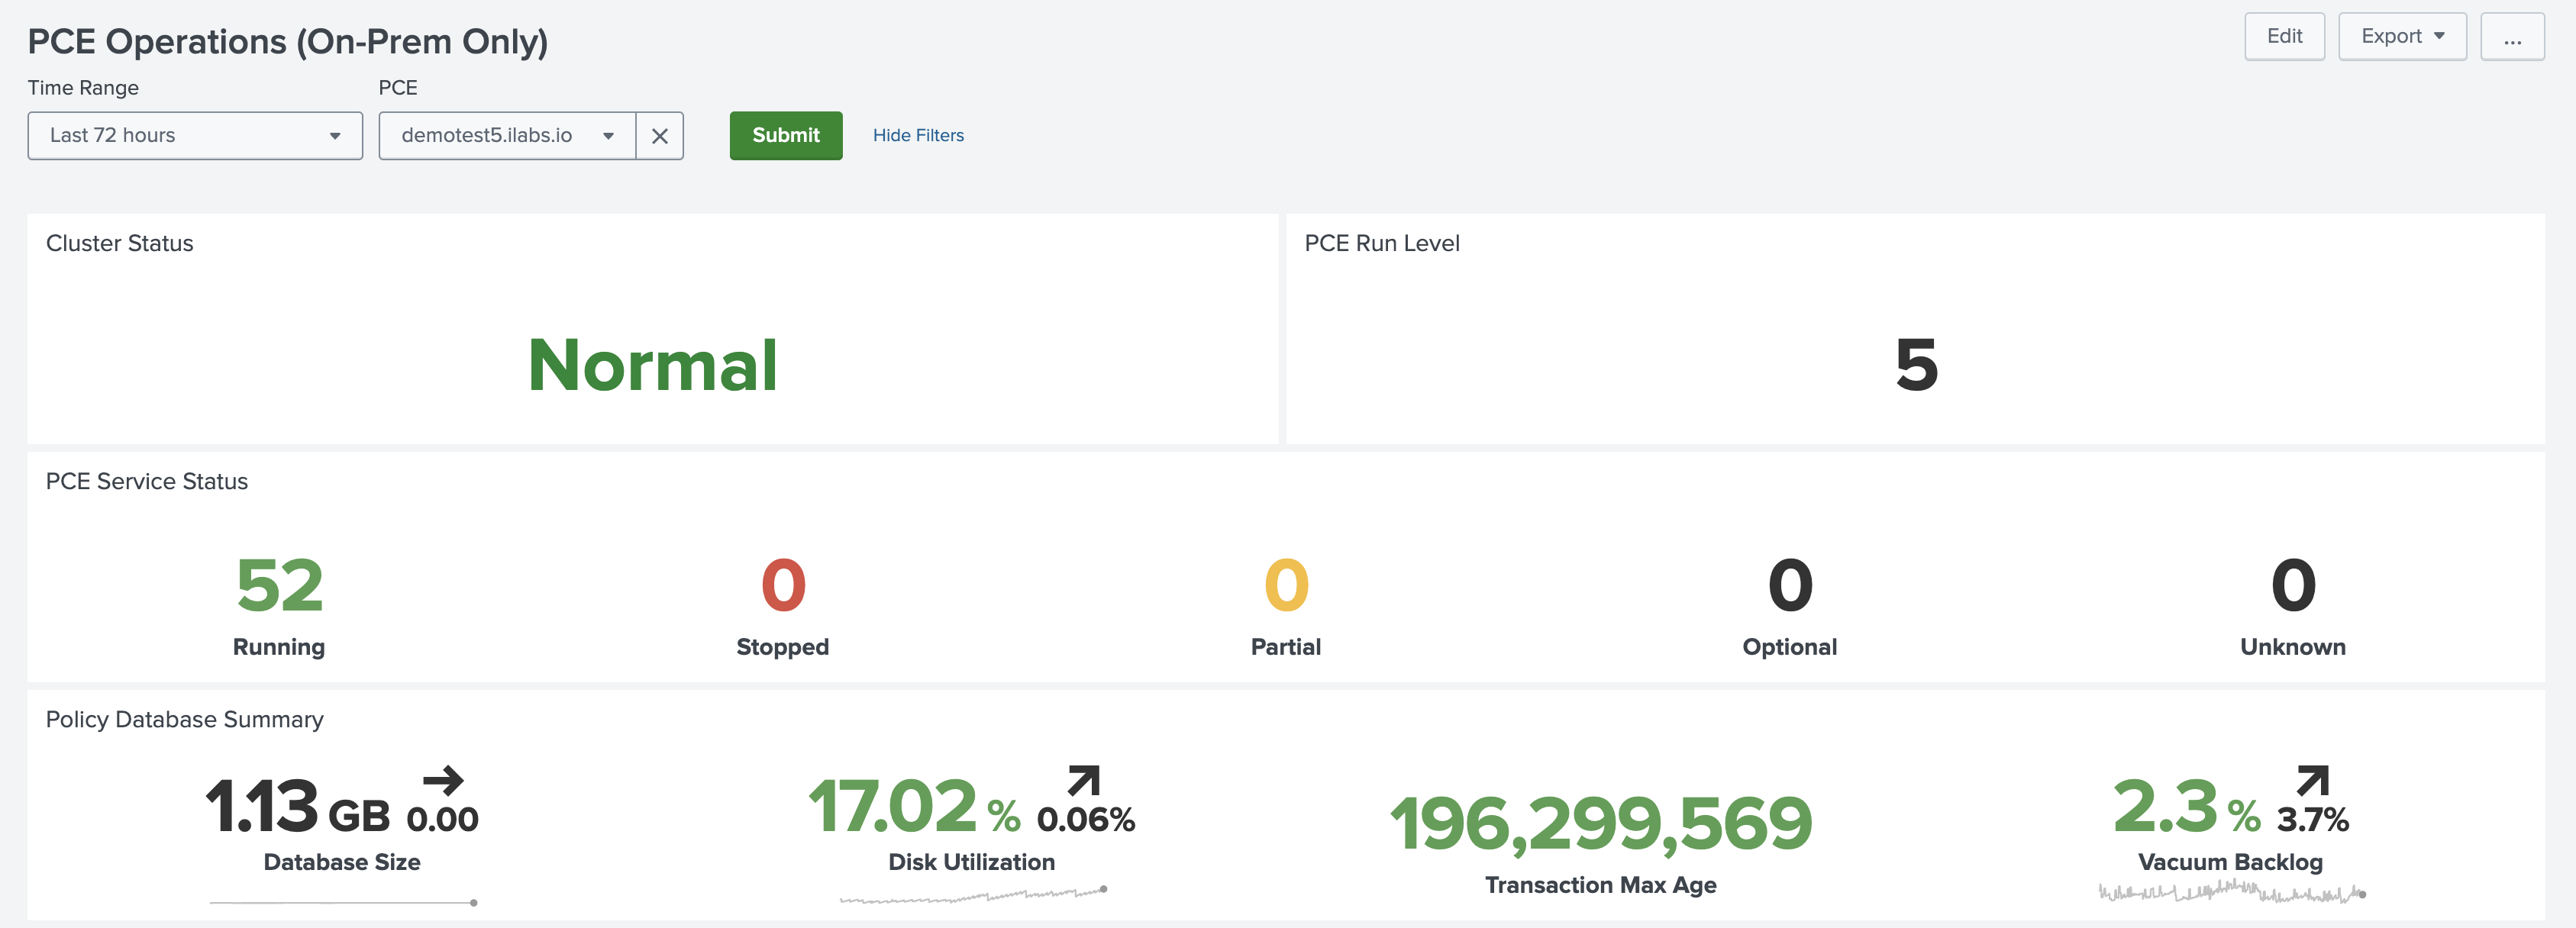
PCE Operations Dashboard
Note
The PCE Operations dashboard is only available for On-Premises deployments.
The PCE Operations dashboard shows the status of the PCE cluster. The top panels provide an overview of the whole cluster state, including the Unix run level, service statuses, and policy database metrics.
Refer to the PCE Administration Guide for your version of the Illumio PCE for detailed explanations of these metrics.
 |
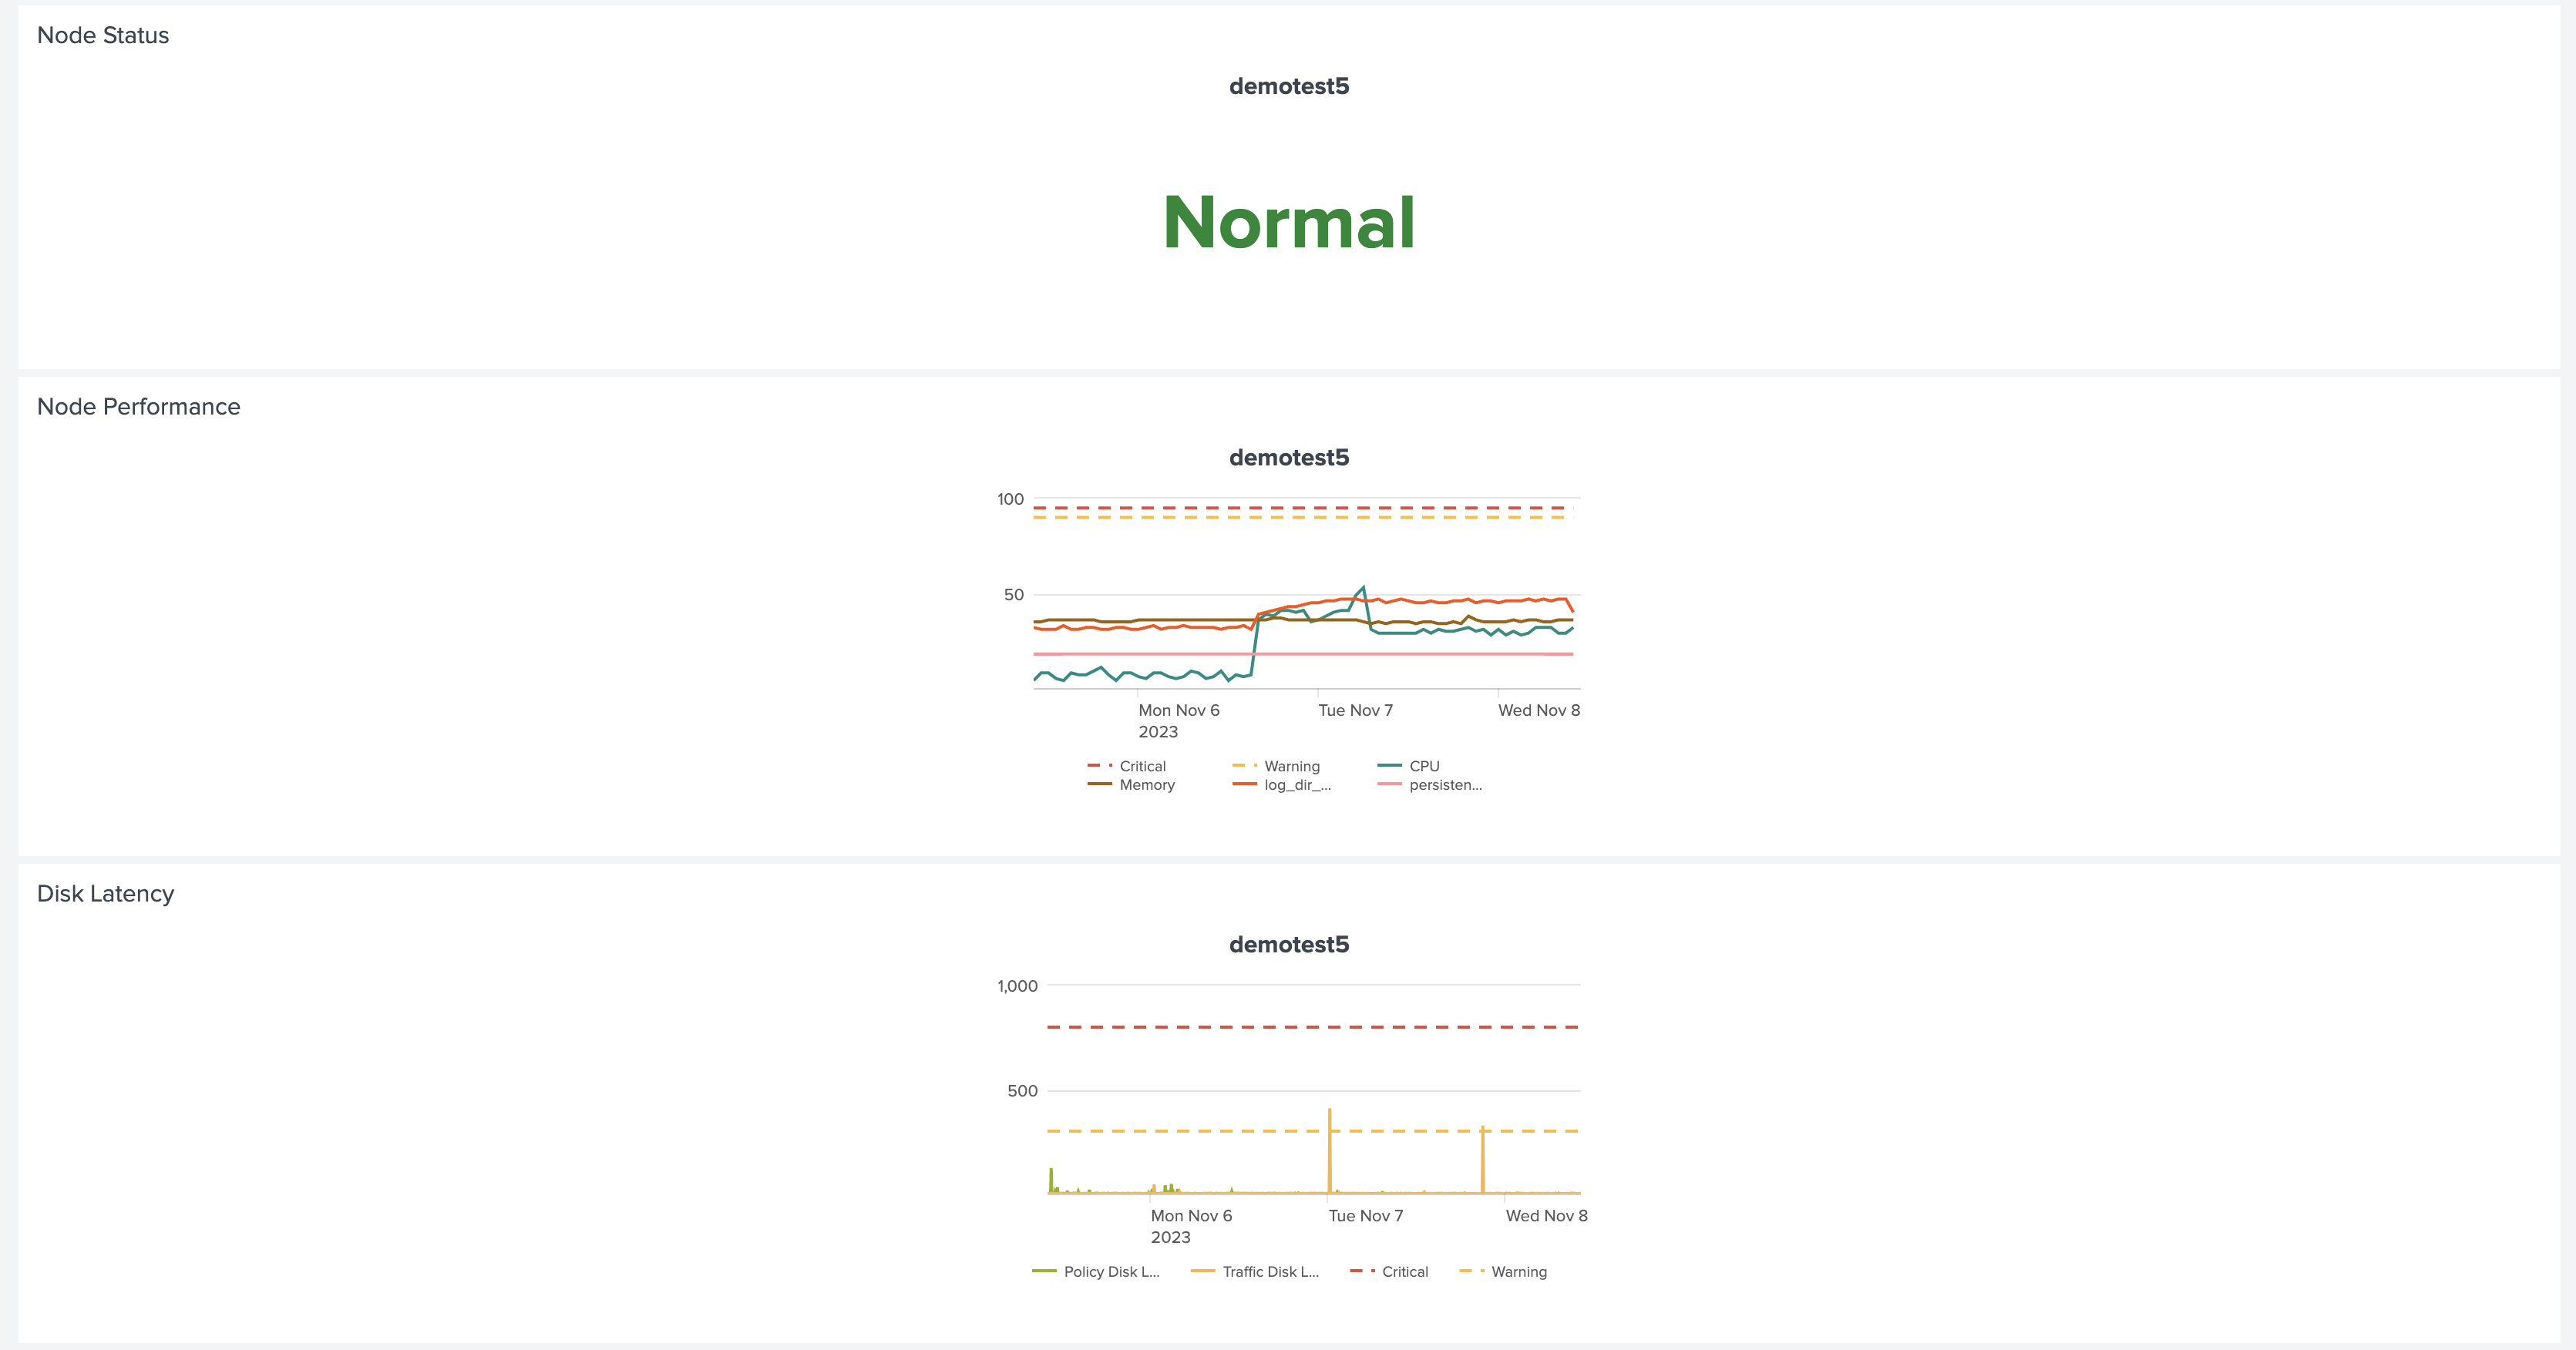
The Node Status, Node Performance, and Disk Latency panels show trellis charts for each host in the PCE cluster. The dashed yellow and red lines indicate warning and critical thresholds for the tracked metrics respectively.
 |
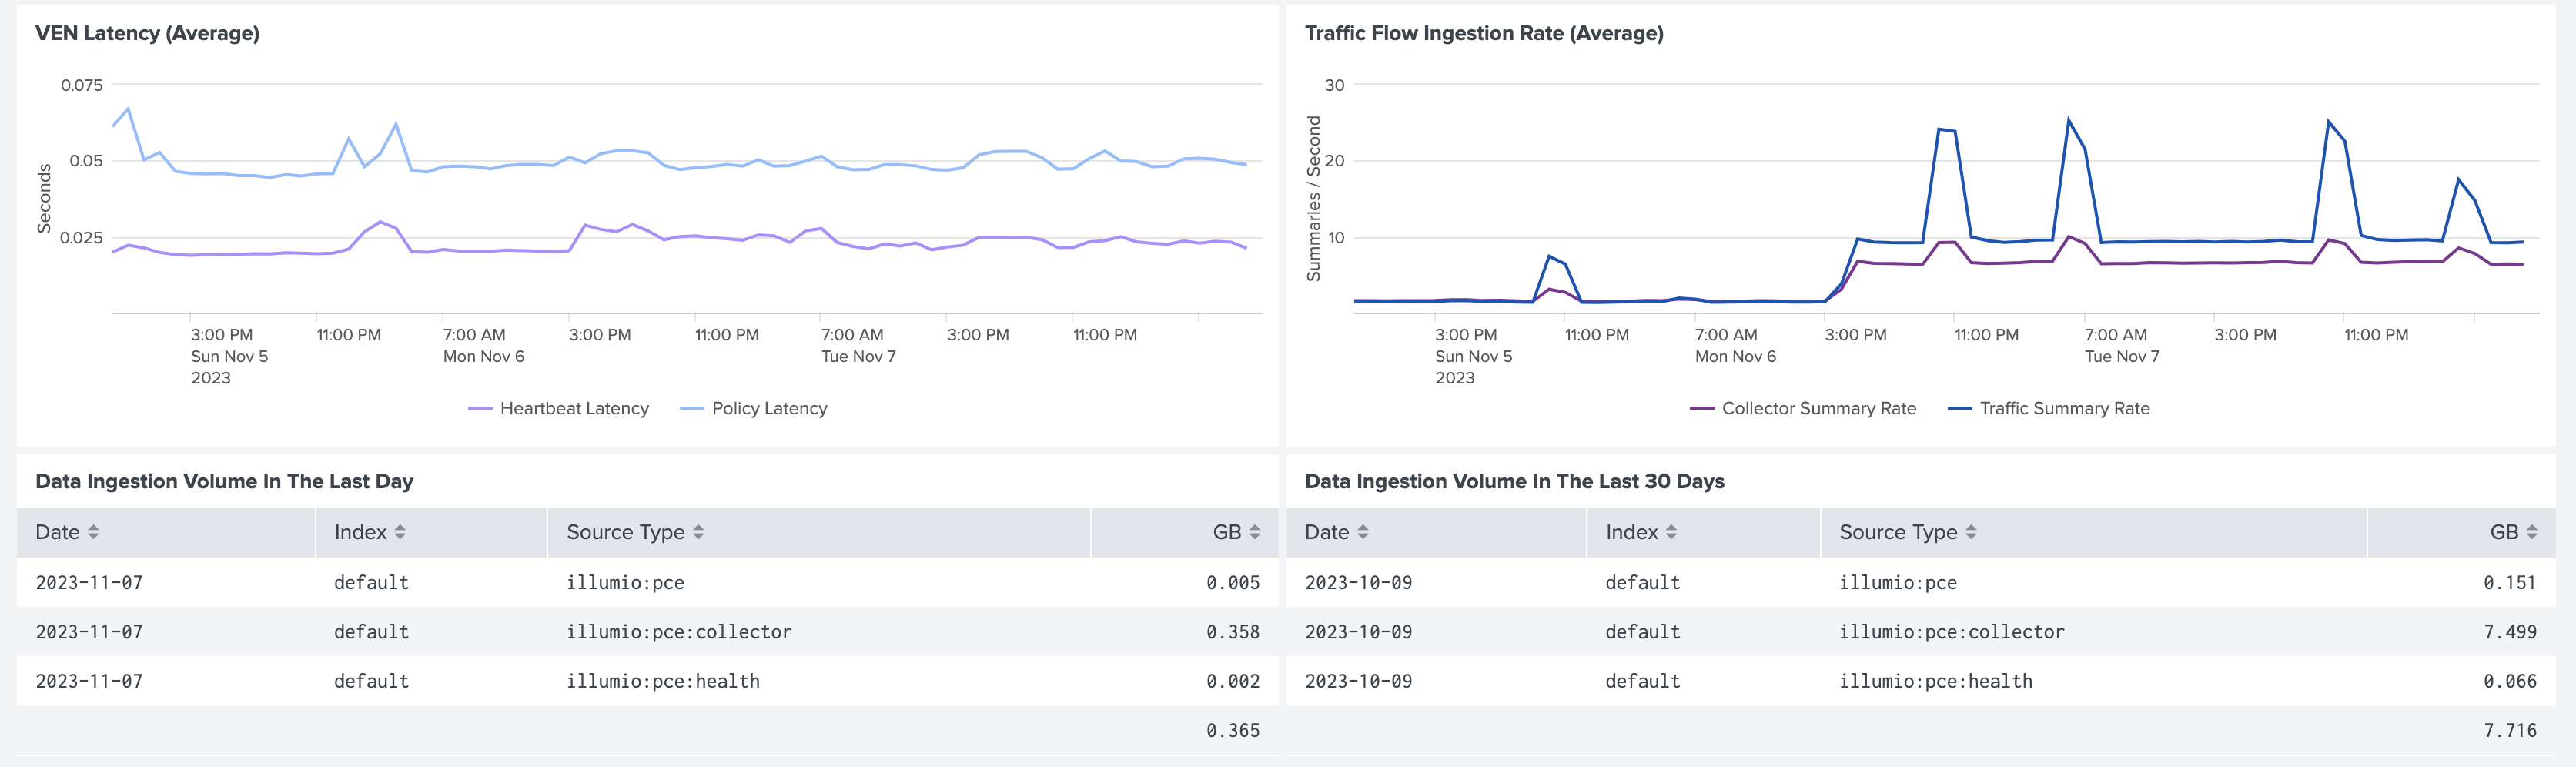
The VEN Latency panel provides an aggregate view of heartbeat and policy latency times for all VENs. The Traffic Flow Ingestion Rate panel shows average traffic flow collection rates to the PCE.
Finally, the Data Ingestion panels at the bottom of the dashboard show the index volume, in gigabytes, broken down by sourcetype.
Note
Only users with the admin or sc_admin roles can view the data ingestion panels.
 |
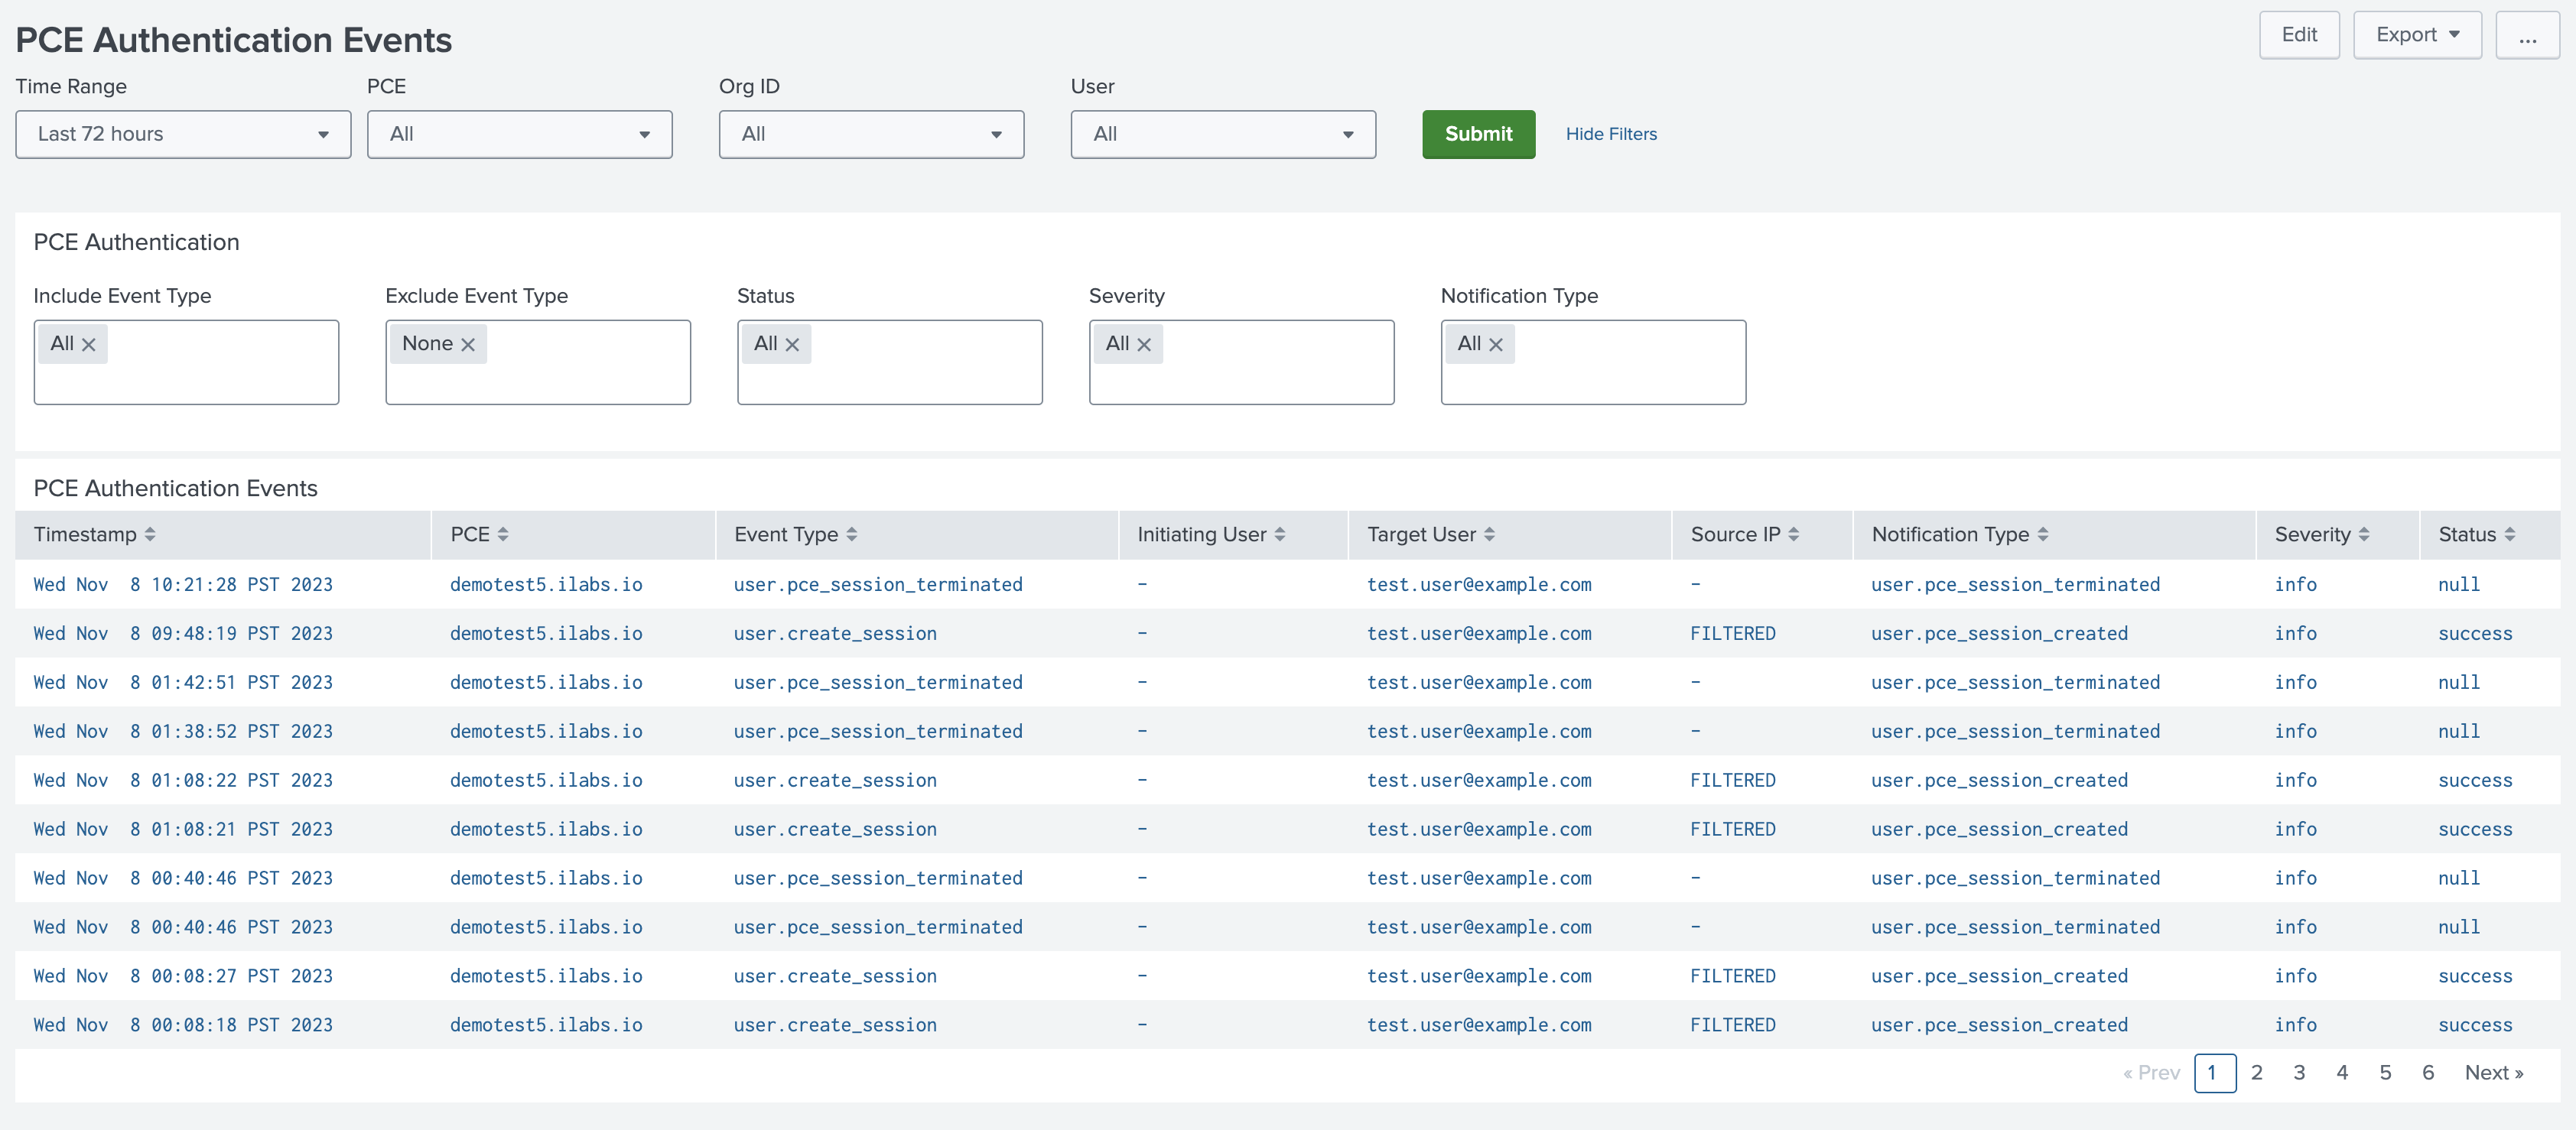
PCE Authentication Events Dashboard
The PCE Authentication Events dashboard shows all authentication and authentication-related events that were made to the PCE. Events can be filtered by user, type, and severity.
 |
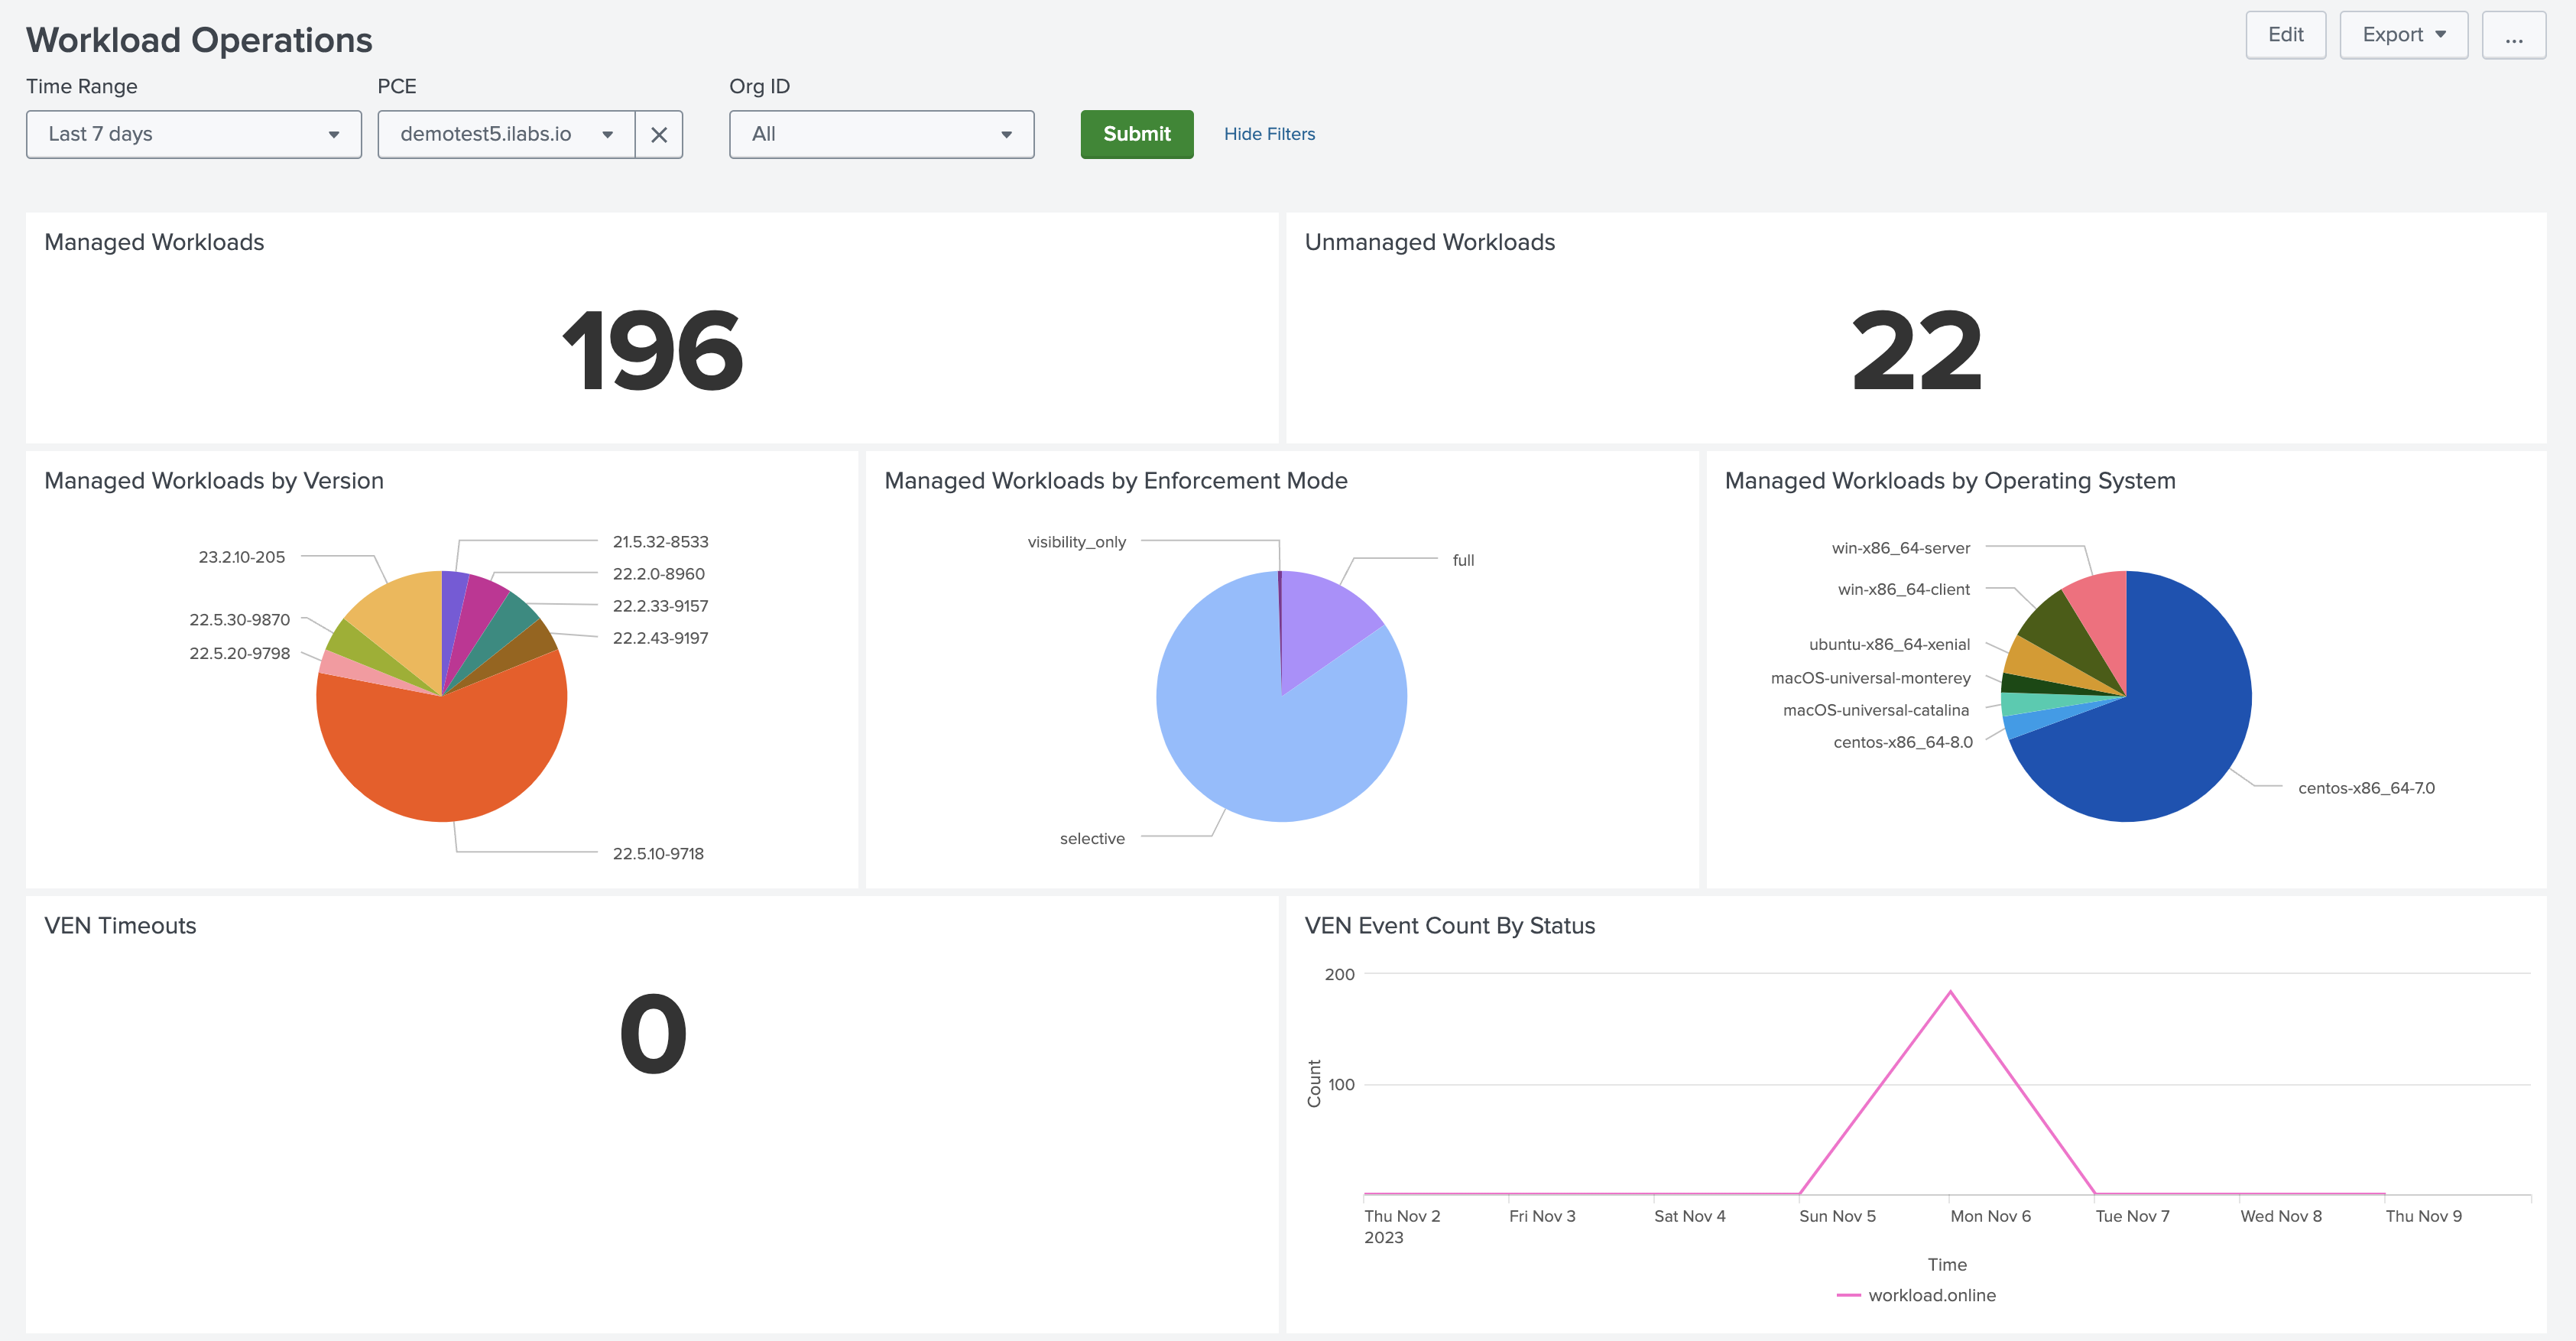
Workload Operations Dashboard
The Workload Operations dashboard shows breakdowns of managed and unmanaged workloads by VEN version, enforcement mode, and operating system. It also shows VEN timeouts and VEN/workload events over time.
 |
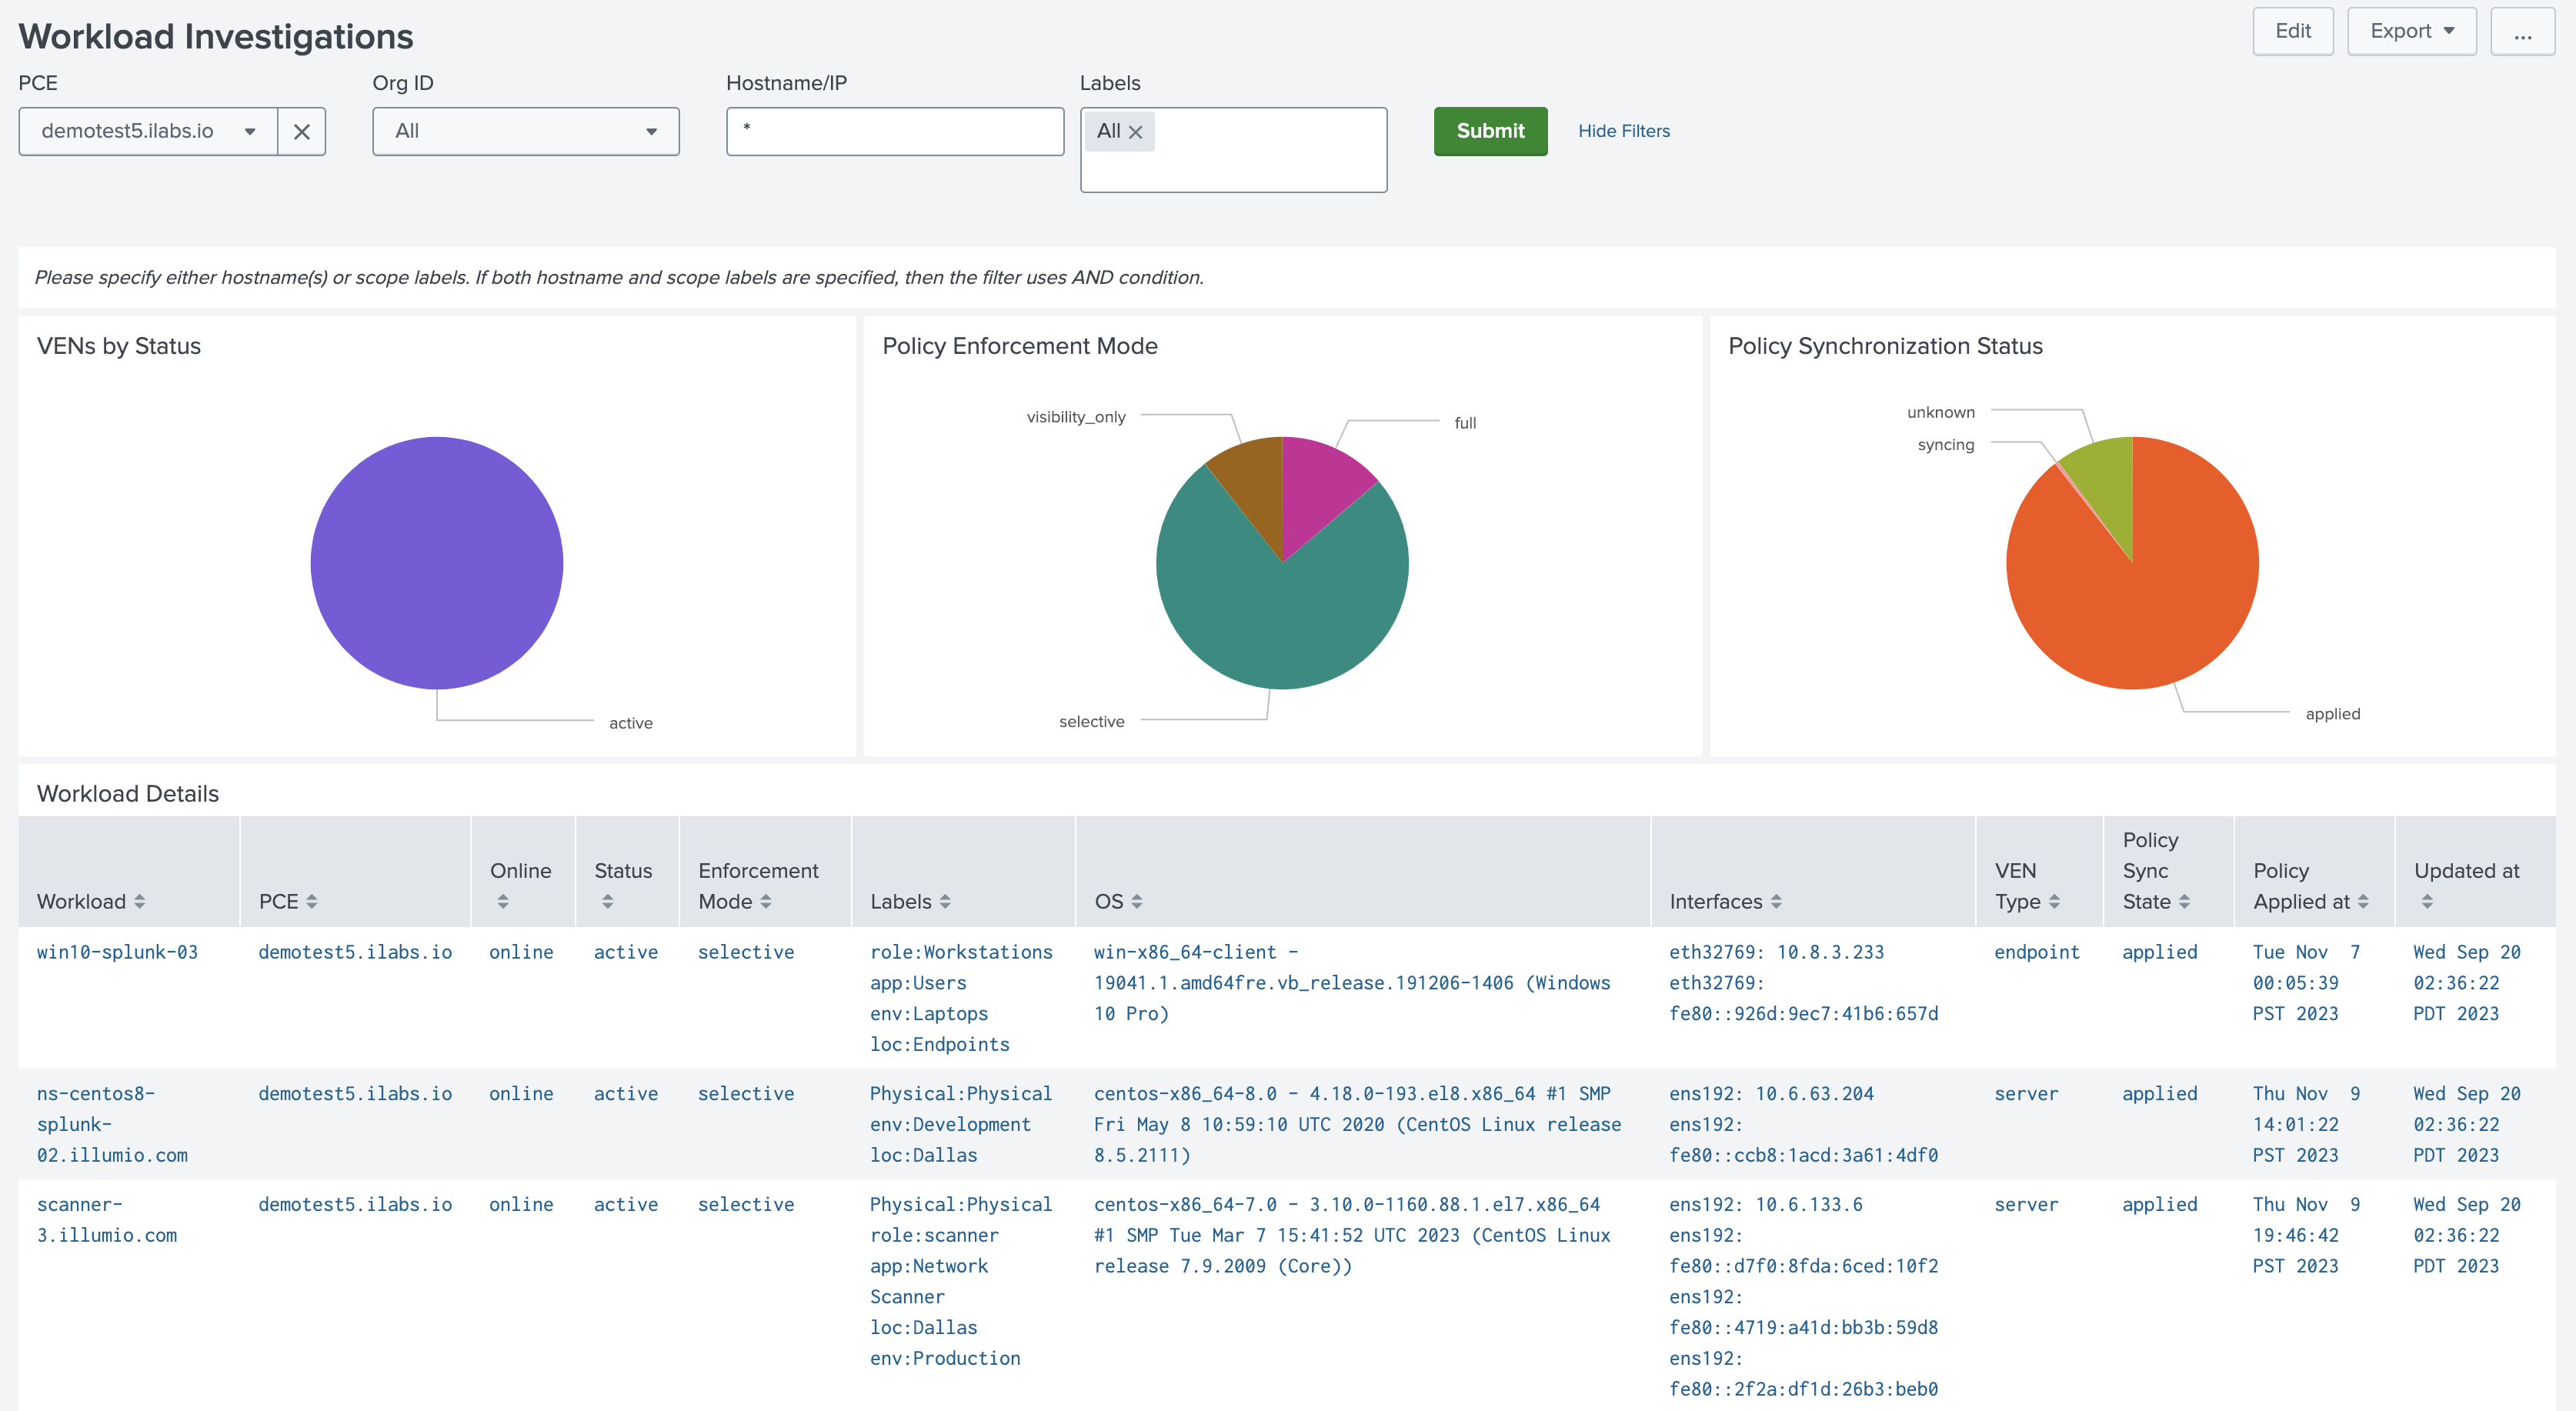
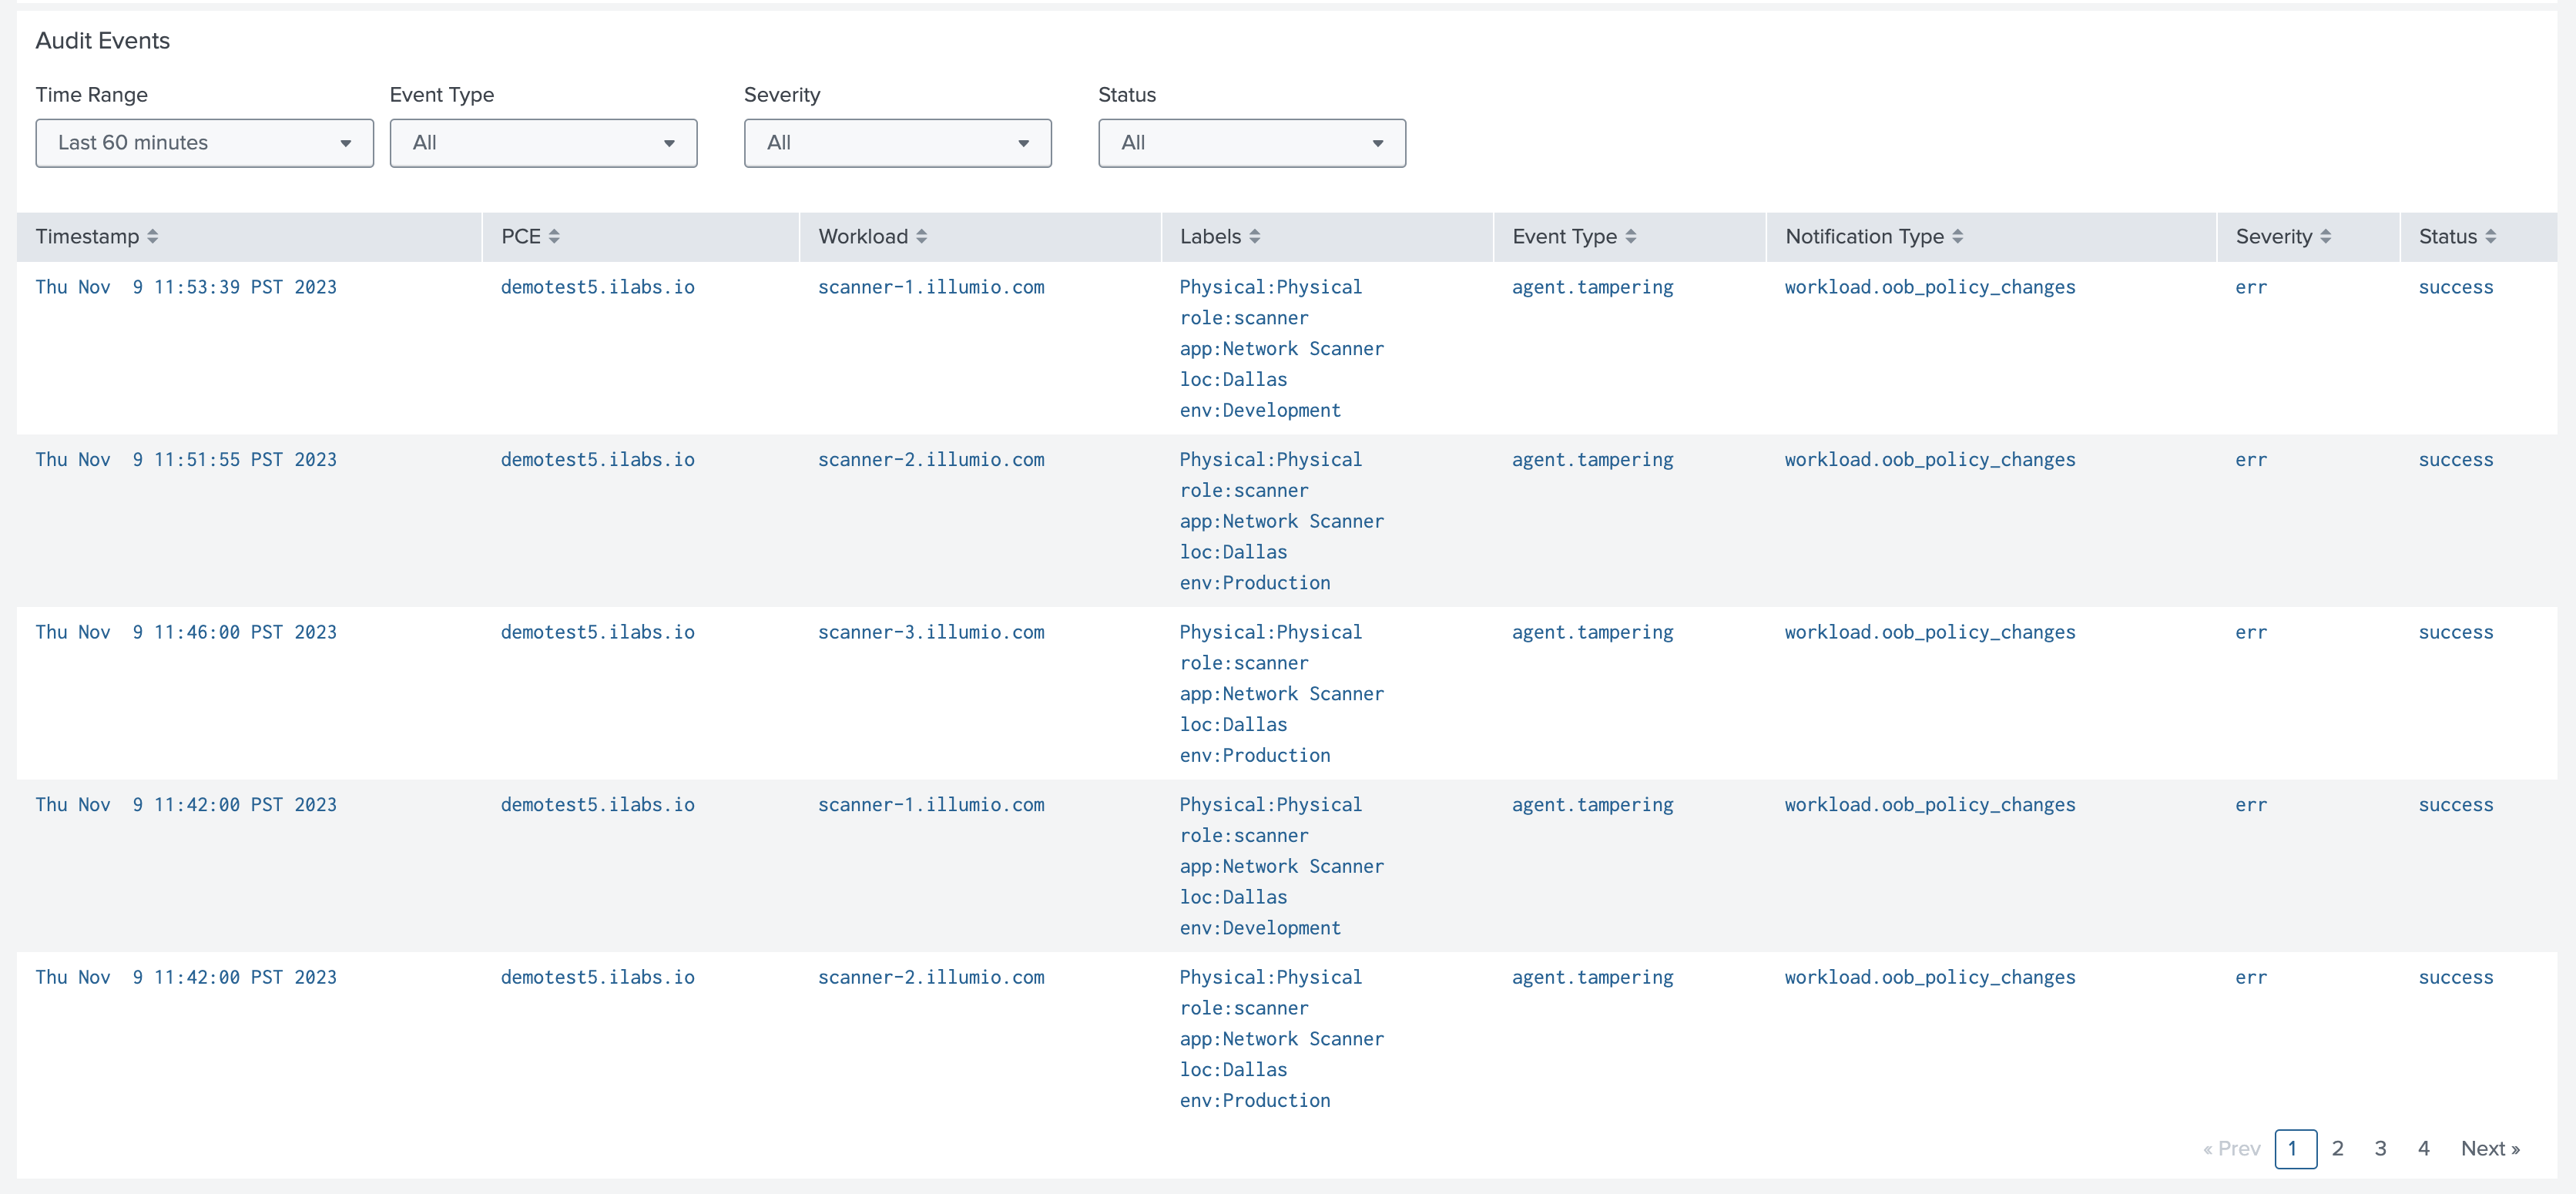
Workload Investigations Dashboard
The Workload Investigations dashboard shows a more detailed breakdown of workload metadata and events, as well as VEN status and policy synchronization status.
 |
The Audit Events table at the bottom of the dashboard highlights the most recent VEN and workload events on the PCE.
 |
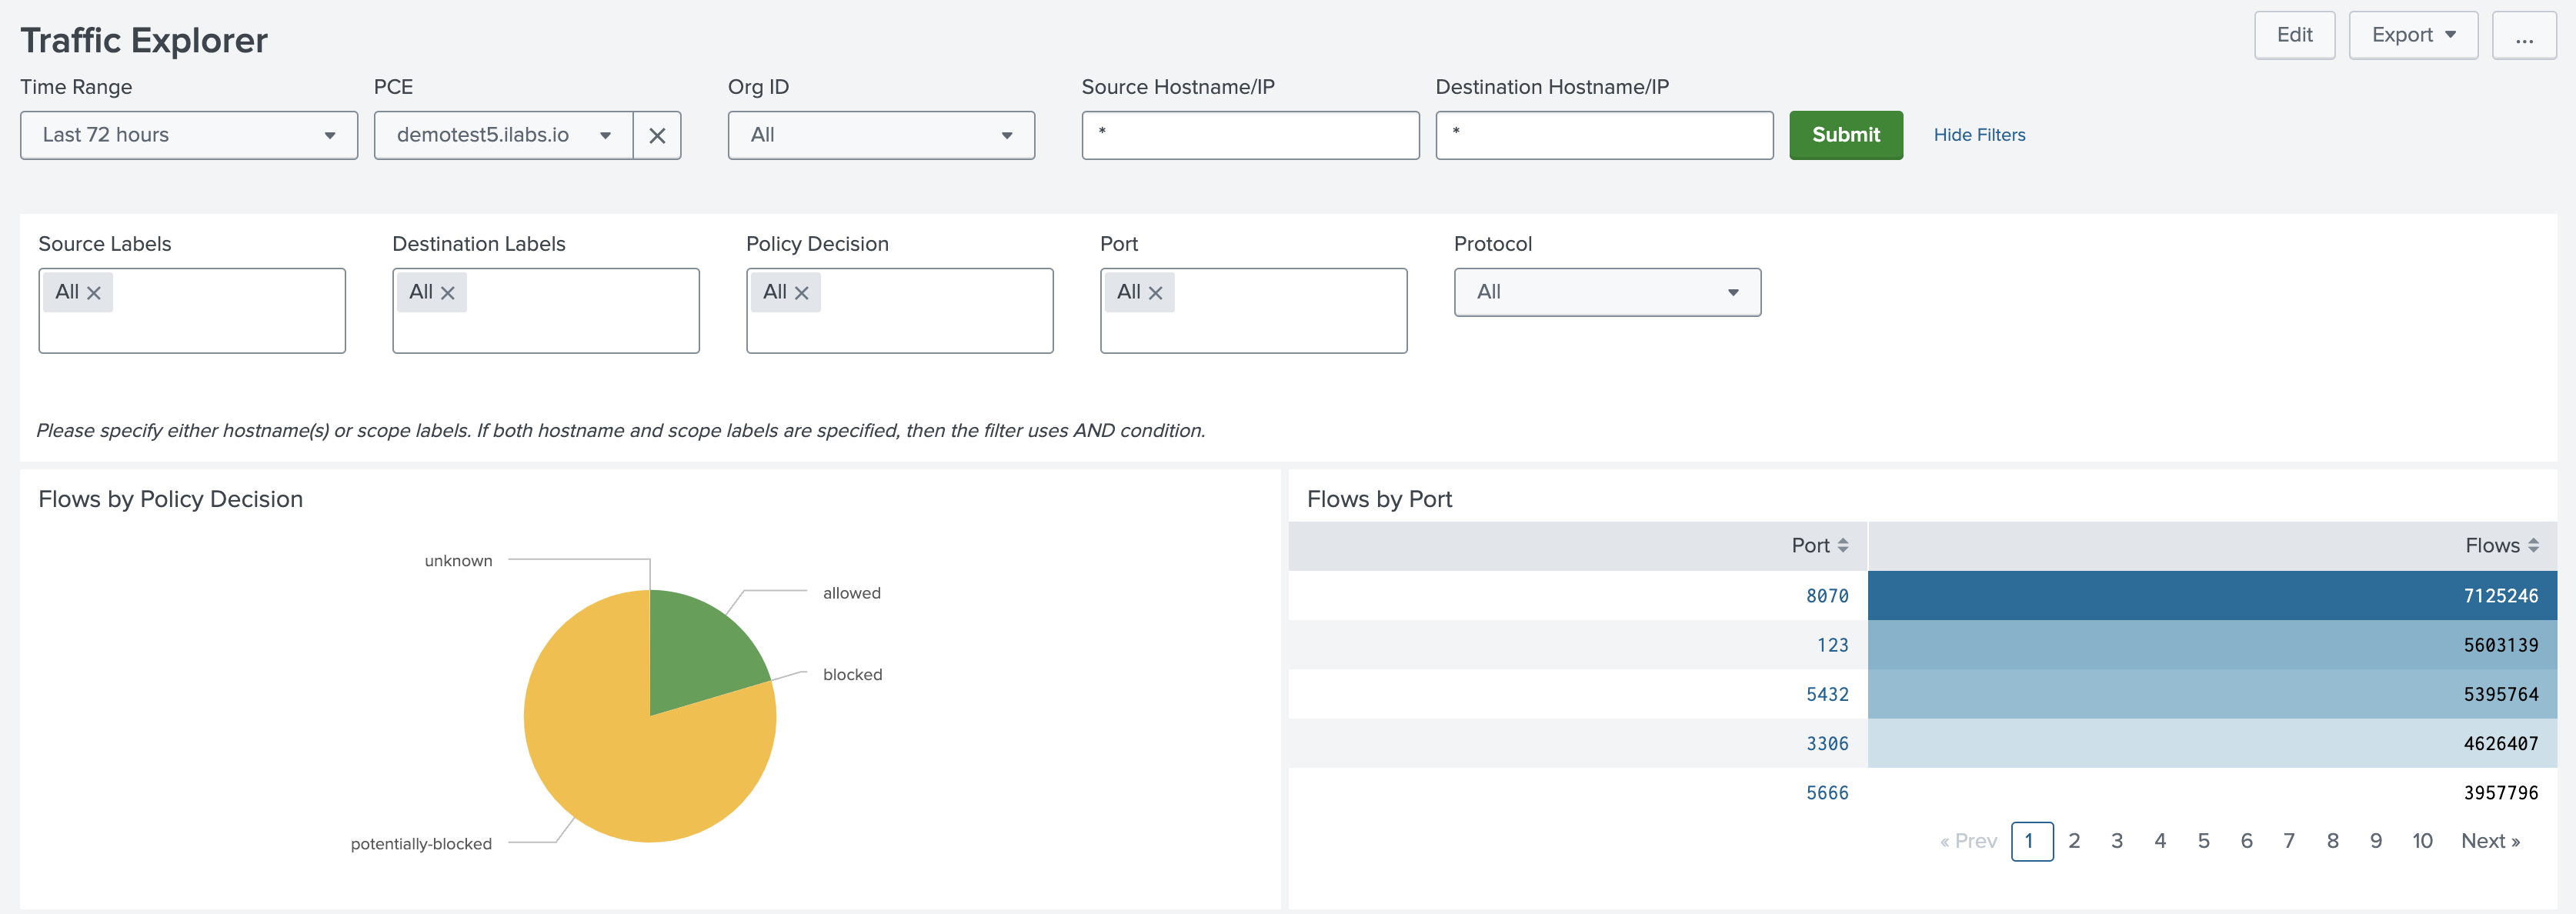
Traffic Explorer Dashboard
The Traffic Explorer dashboard visualizes traffic flows reported from managed workloads or otherwise uploaded to the PCE. The visualizations show traffic grouped by policy decision, port, and source/destination.
Traffic can be filtered by source/destination hostname or IP address, assigned labels, policy decision, port, and transport protocol.
 |
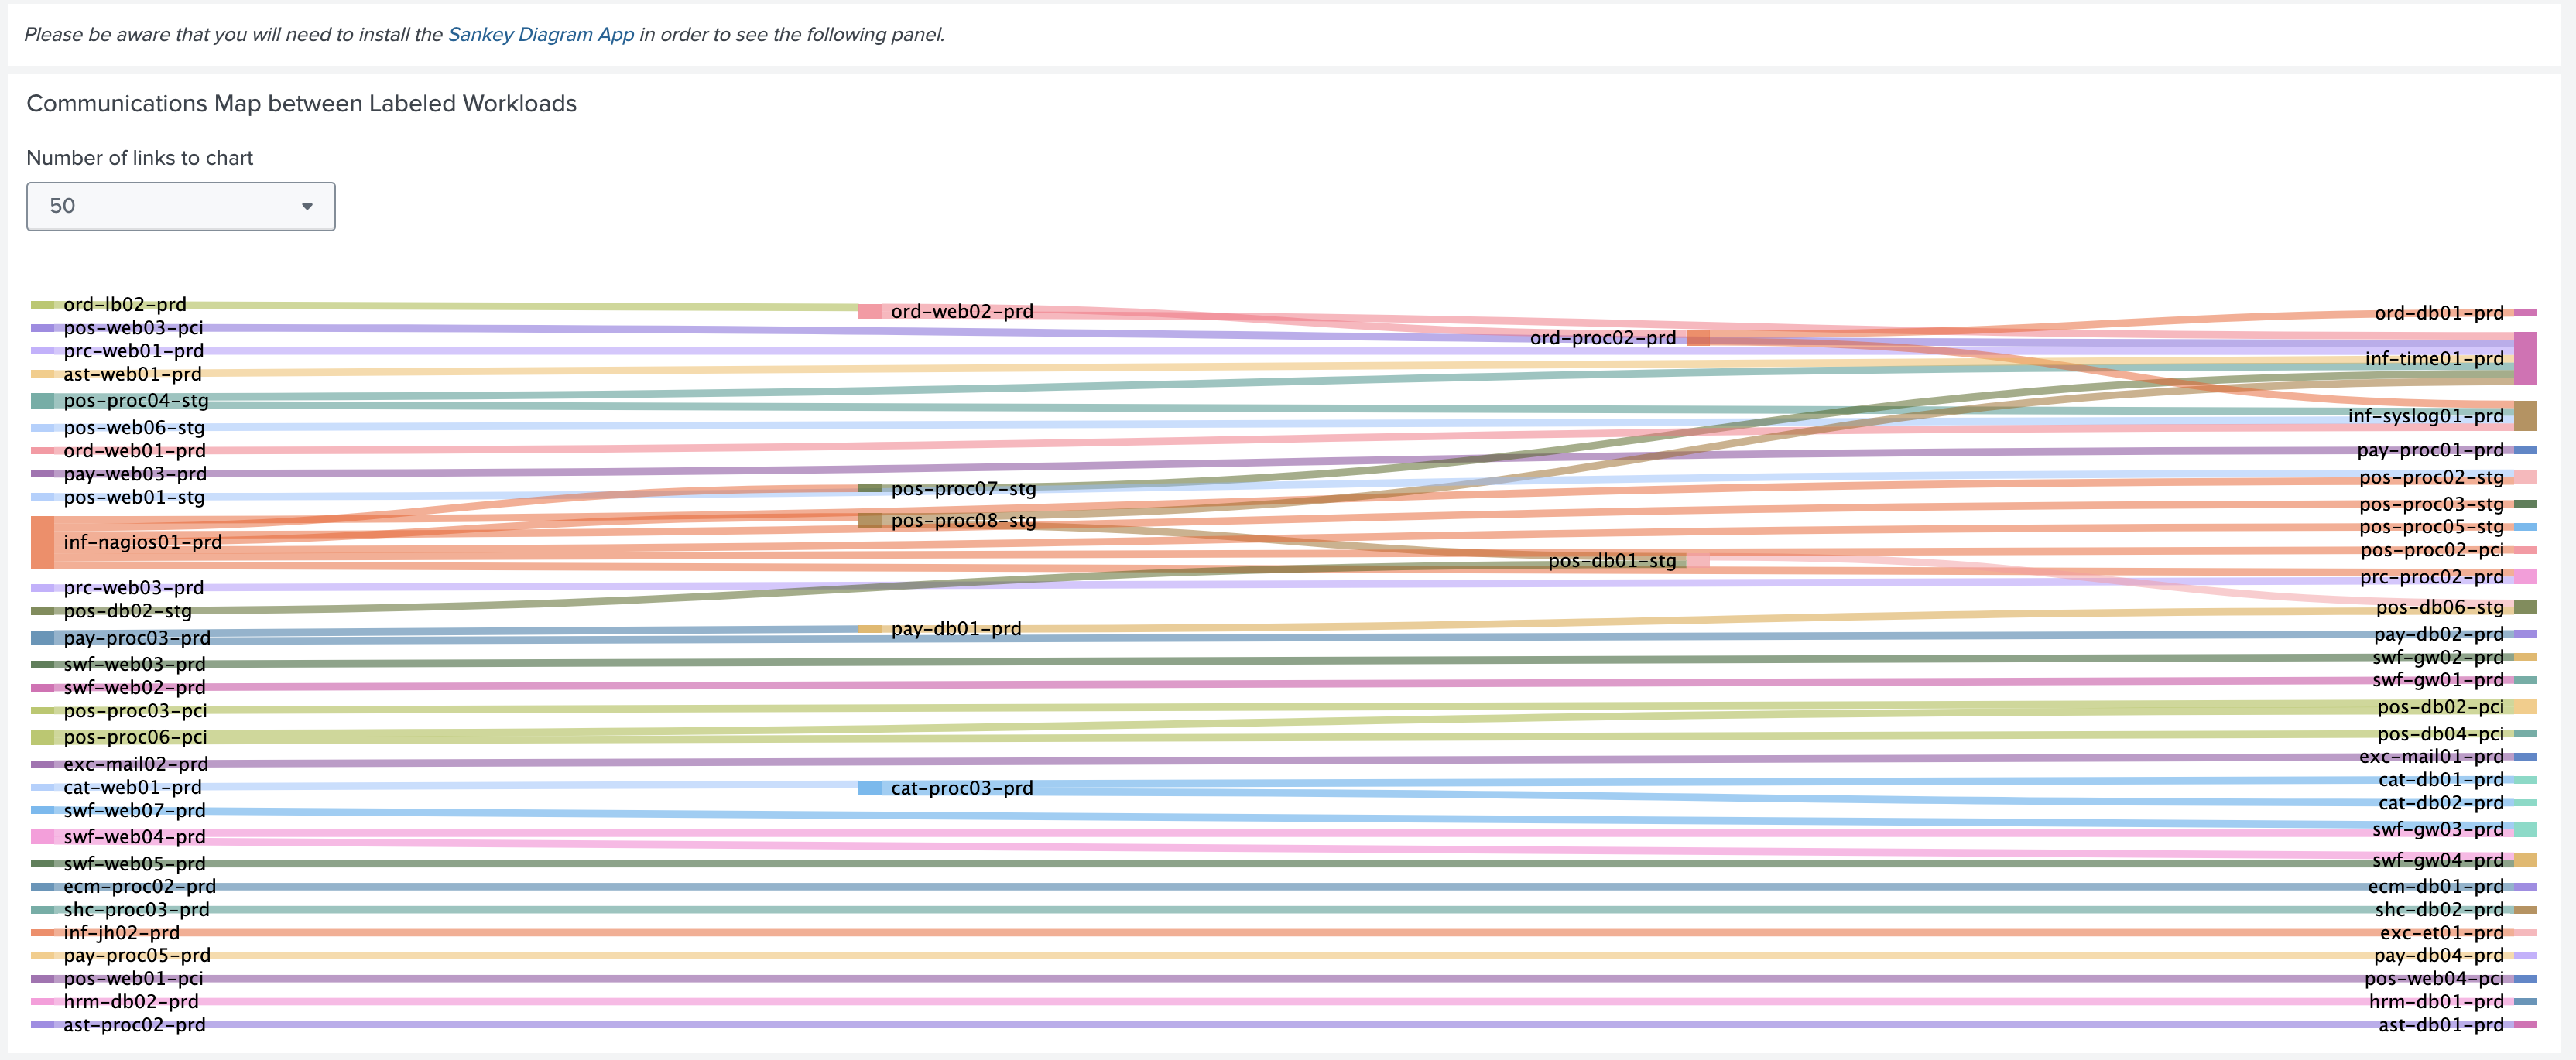
Note
The Communications Map between Labeled Workloads chart shown below uses the Splunk Sankey Diagram Custom Visualization app. You must install the app to render the chart.
Each link in the chart is grouped by source, destination, and destination port. The thickness of the link represents relative flow count.
 |
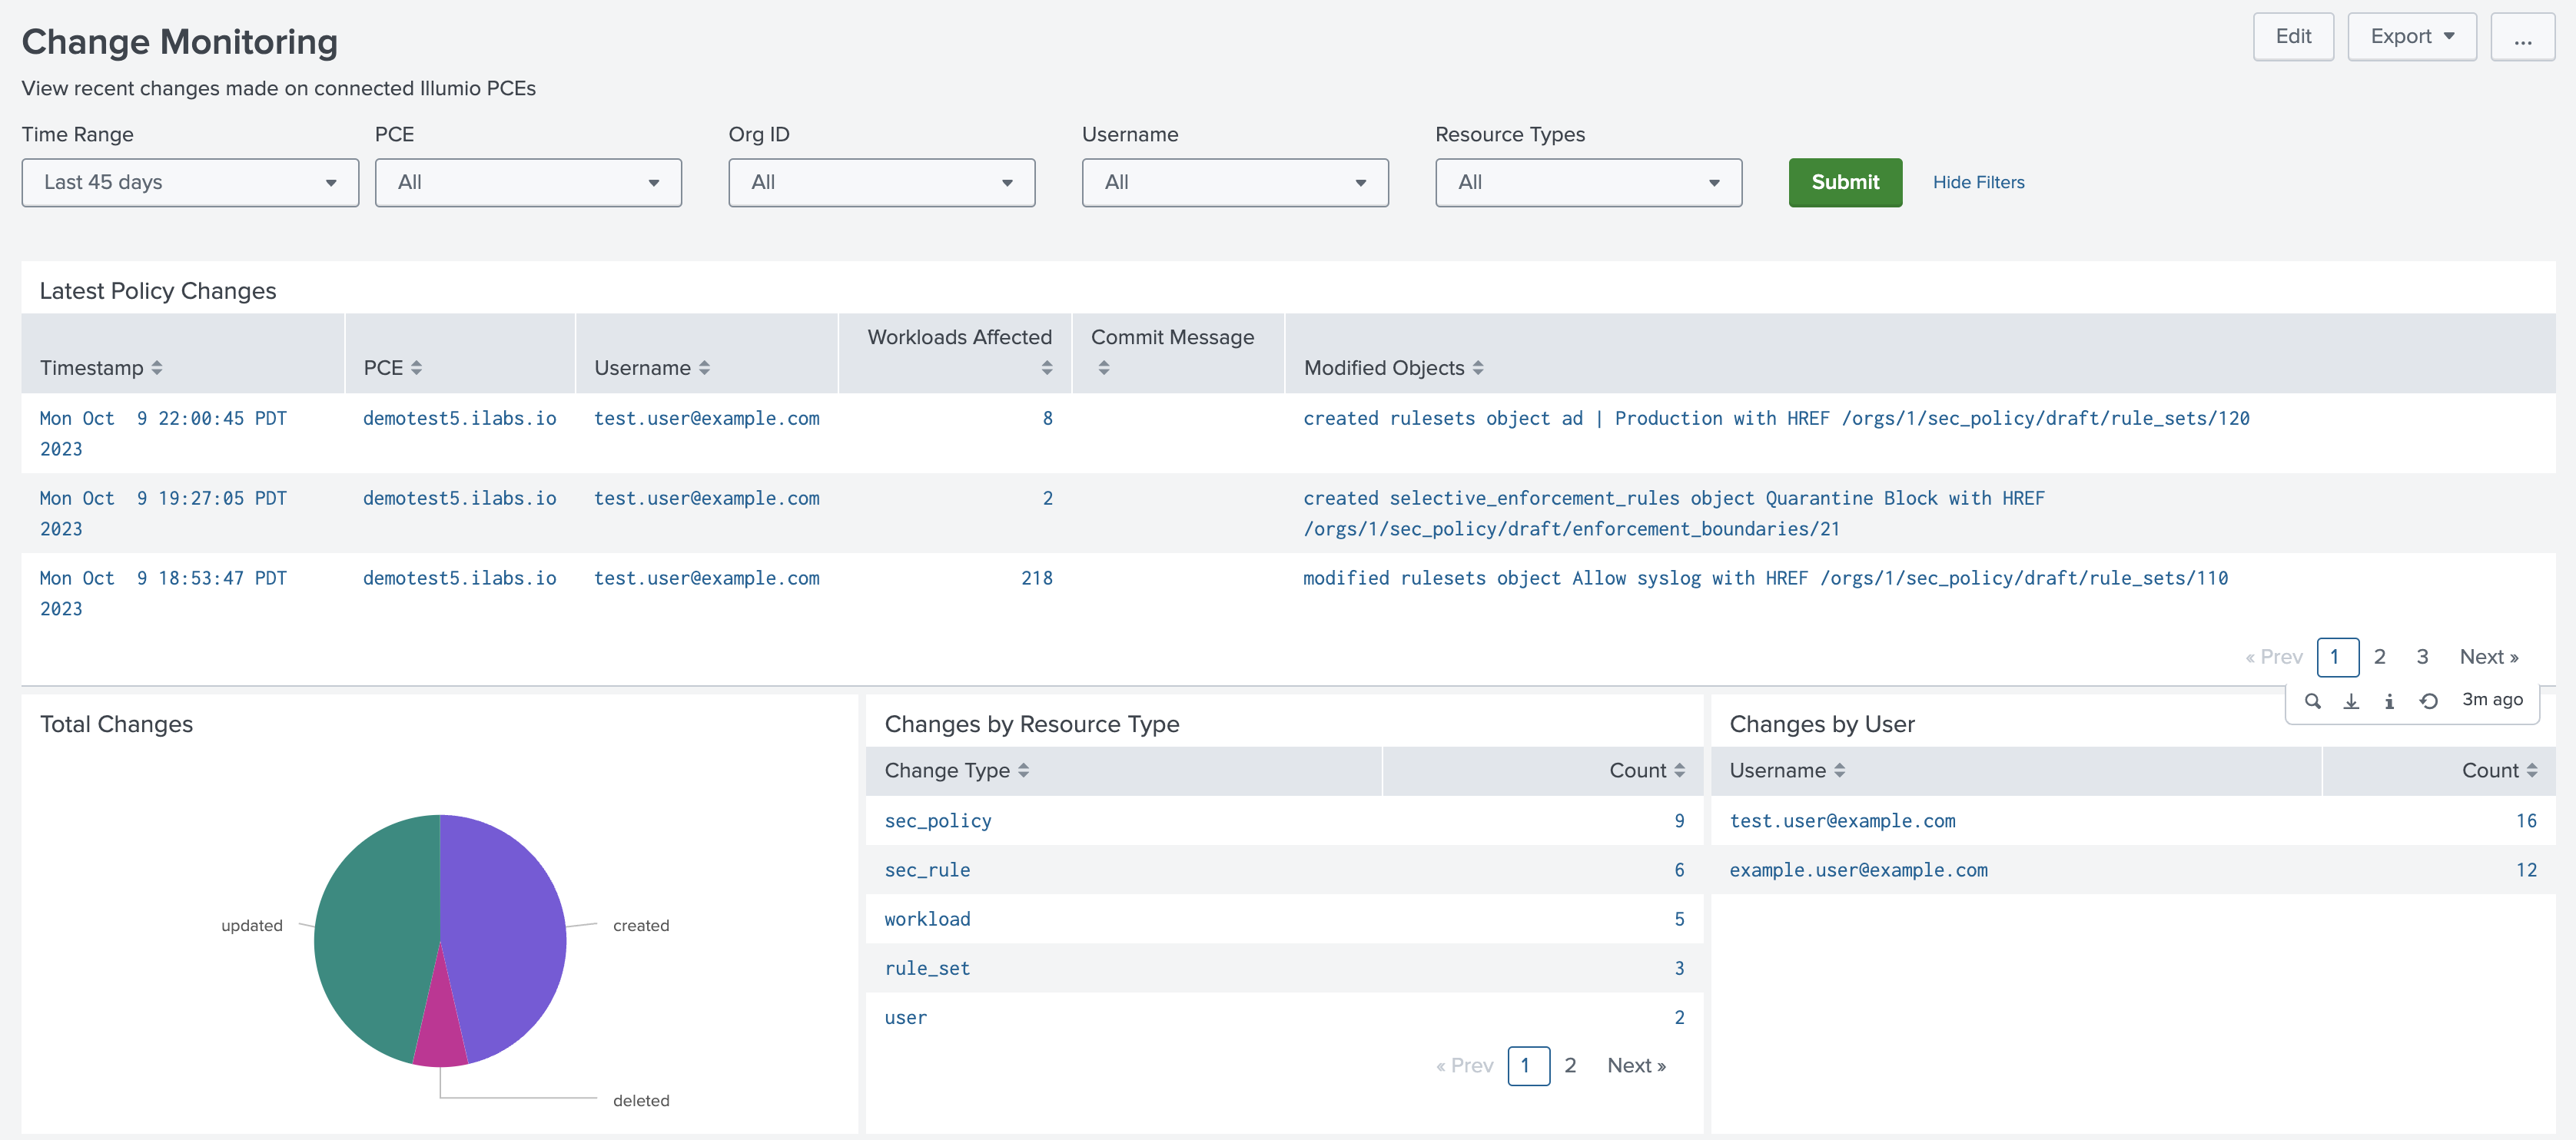
Change Monitoring Dashboard
The Change Monitoring dashboard shows recent security policy changes, and groups auditable change events (creates, updates, and deletes) by count, resource type, and initiating user.
 |
Data Model
The Illumio App for Splunk provides an Illumio data model that can help to improve search performance at the cost of disk space by building a limited index of PCE syslog event fields.
Note
According to Splunk app guidelines, model acceleration is disabled by default.
The model provides the following objects:
Name | Type | Parent | Base Search | Description |
|---|---|---|---|---|
Audit | Root event node | - | illumio_get_index sourcetype="illumio:pce" | Auditable syslog events |
Traffic | Root event node | - | illumio_get_index sourcetype="illumio:pce:collector" | Traffic flow events |
Status | Root event node | - | illumio_get_index sourcetype="illumio:pce:health" | PCE system health and status events |
Status.Policy | Child event node | Status | event_source="policy" | Policy service events |
Status.Collector | Child event node | Status | event_source="collector" | Collector service events |
Status.FlowAnalytics | Child event node | Status | event_source="flow_analytics" | Flow analytics service events |
Illumio data model nodes can be referenced using the tstats command. For example, the following search uses the Traffic node to sum flow counts from a given PCE over time by source/destination IP:
| tstats sum(Traffic.count) AS flows FROM datamodel=Illumio.Traffic WHERE
Traffic.pce_fqdn="my.pce.com" BY Traffic.timestamp, Traffic.src_ip, Traffic.dest_ip
Data Model Acceleration
Note
Enabling or disabling acceleration for the Illumio data model requires the accelerate_datamodel capability. The admin or sc_admin roles have this capability by default.
To enable acceleration for the Illumio data model:
Navigate to Settings > Data models.
Select Illumio App for Splunk from the App dropdown menu.
Click the Edit dropdown under Actions for the Illumio data model.
Click Edit Acceleration.
Check the Acceleration toggle in the dialog and adjust the Summary Range and advanced settings as needed. See the Splunk documentation on data model acceleration for a more detailed explanation of the individual parameters for configuring acceleration.
Click Save. It may take a while to build the summary for the accelerated model.
Click the arrow to the left of the model name to view the progress in the ACCELERATION section.
Note
If you are using a distributed search head cluster, see Sharing data model acceleration summaries among search heads to avoid rebuilding the summary on each search head in the cluster.
To rebuild the Illumio data model summary:
Navigate to Settings > Data models.
Select Illumio App for Splunk from the App dropdown menu.
Click the arrow to the left of the Illumio data model name.
Click Rebuild under the ACCELERATION section.