Install the Illumio Splunk Apps
You can install the Illumio Splunk integration apps in either a distributed or a standalone Splunk environment.
Note
Recommendations for the configuration and topology of a distributed Splunk environment are outside of the scope of this document. See About Splunk Validated Architectures for suggestions on topology for distributed deployments.
Install the Illumio Splunk Apps in a Distributed Environment
For a distributed environment, install the TA to a Splunk Heavy Forwarder, as well as the indexer/indexer cluster and search head/search head cluster. Configure the Illumio modular input to run on the Heavy Forwarder. You need to install on the search head tiers if you want to use index-time and search-time transforms in the app.
Note
You only need to install the Illumio App for Splunk on the search tier.
Note
You cannot install the Illumio Technology Add-On for Splunk on a Universal Forwarder.
Install the Illumio Technology Add-On for Splunk in a Standalone Environment
The following procedures describe how to install the TA through the Splunk UI and manually.
Use the following procedure to install the TA through the Splunk UI.
In the Splunk UI, navigate to the Manage Apps page using the Apps drop-down in the top-left corner or by clicking the gear icon next to Apps on the Splunk homepage.
Click Browse More Apps, and search for TA-Illumio.
Click Install.
Enter your Splunk login credentials when prompted, and then click Agree and Install.
When prompted, restart Splunk.
Use the following procedure to install Illumio TA manually.
Navigate to the Illumio-TA app in Splunkbase.
Log in using your Splunk credentials.
Click Download.
Read through and accept the EULA and Terms and Conditions, and then click Agree to Download.
Transfer the downloaded .tgz or .spl file to the Splunk server.
Install the app manually:
Using the Splunk binary:
$SPLUNK_HOME/bin/splunk install app /path/to/TA-Illumio.splOr by extracting directly under /apps:
tar zxf /path/to/TA-Illumio.spl -C $SPLUNK_HOME/etc/apps/Restart Splunk.
Configure the Illumio Technology Add-On for Splunk
After installing the Illumio TA, you will need to configure the Illumio modular input and a TCP receiver for Syslog events from the PCE.
Start by creating a PCE API key to use when setting up the input.
Create a User-Scoped API Key
In the PCE, open the user menu drop-down in the top-right corner of the page, and select My API keys.
Click Add, note the Org ID shown in the dialog, and enter a display name for the key.
Click Create, and then copy or download the API key credentials and store them somewhere secure.
Create a Service Account API Key
The Org ID value is not shown when you create a Service Account key. It is displayed when you create a User API key, as described in Create a User-Scoped API Key.
Note
The Org ID value is not shown when you create a Service Account key. It is displayed when you create a User API key, as described in the preceding procedure.
In the PCE, open the Access submenu on the left side of the screen and select Service Accounts.
Click Add, and enter a display name and one or more Roles to assign to the key. The TA-Illumio Add-On requires only read-only access to policy object endpoints, so the Global Viewer role should be sufficient.
Note
To use the workload quarantine action, the API key that is used for the input must have write permissions for workloads.
Click Save, and then copy or download the API key credentials and store them somewhere secure.
Warning
Service Account API keys have a default lifetime of 90 days. Take note of the expiration data for your key and replace it before it expires.
Working with Alert Actions and Quarantines
Configure the Illumio Modular Input
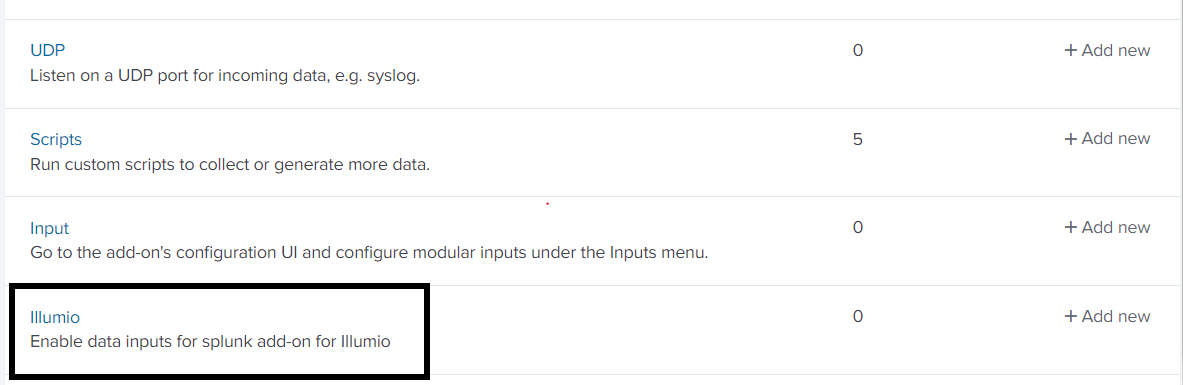 |
Navigate to Settings > Data inputs and find the Illumio input type.
Click the + Add New action to create a new input.
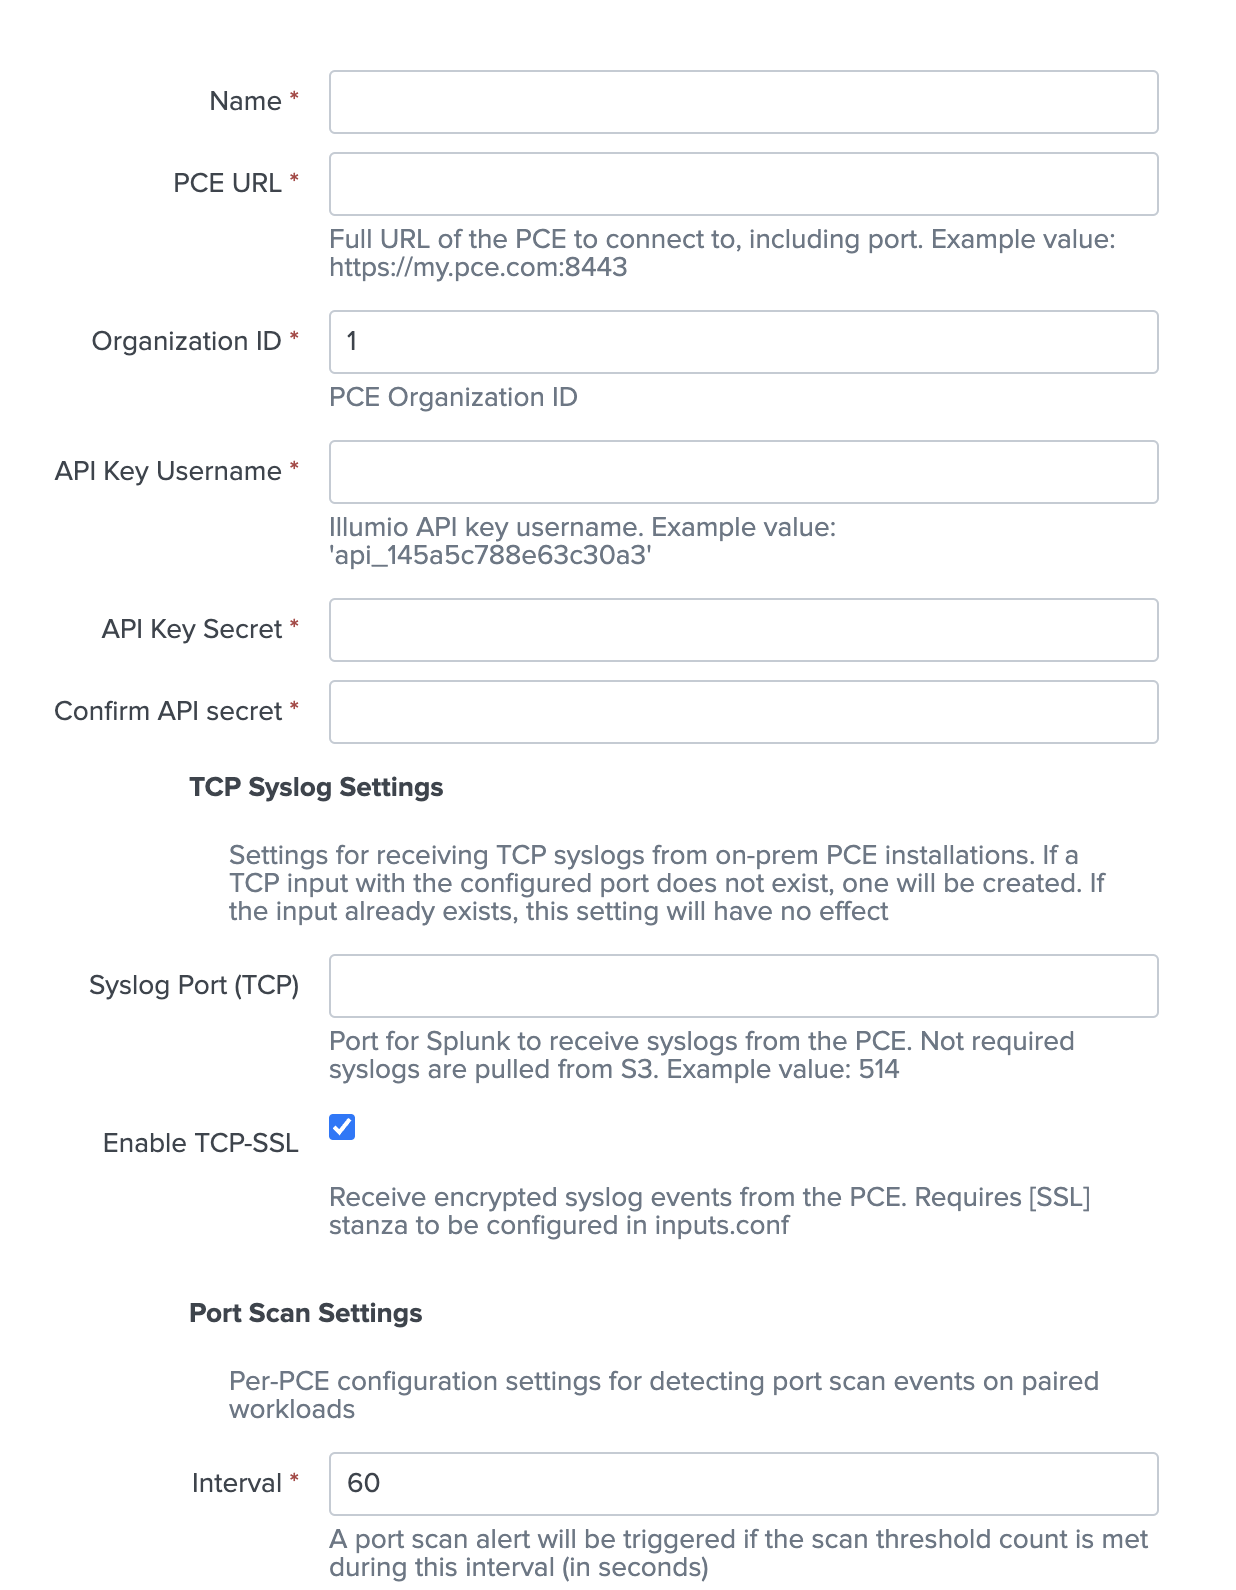
Enter a display name for the input and the connection details for your PCE. Enter the Organization ID and API key username and secret values copied from the steps above.
(On-prem only) To receive syslog events forwarded from an on-prem PCE, a TCP input must be configured in Splunk. Setting the Syslog Port (TCP) value will automatically create one when the input runs if it does not already exist. The Enable TCP-SSL option determines whether a [tcp-ssl] or [tcp] stanza will be created (See Configure TCP SSL for more information.)
Adjust any of the remaining parameters as needed. Make sure that the index is set correctly. (Check the More settings checkbox to display additional settings.) To enable automated quarantine using the illumio_quarantine action, specify one or more labels that make up a quarantine policy scope in the PCE in the Quarantine Labels field.
Click Next. If an error dialog appears, double-check the field values and refer to the Troubleshooting section.
Parameter | Description | Required | Default Value | Example Value |
|---|---|---|---|---|
Name | Modular input display name. Must be unique. | Y | - | mypce_input |
PCE URL | The full URL of the Illumio PCE to connect to. If a scheme is not provided, https:// is used by default. If a port is not provided, it is assumed to be the default for the given scheme (80 for HTTP, 443 for HTTPS). | Y | - | https://my.pce.com:8443 |
Organization ID | The ID number of the PCE organization to connect to. | Y | 1 | - |
API Key Username | The API key ID to use when connecting to the PCE. | Y | - | api_145a5c788e63c30a3 |
API Key Secret | The API key secret to use when connecting to the PCE. | Y | - | - |
Syslog Port (TCP) | Designates a port on the Splunk server to receive syslog events from the Illumio PCE. There must not be an existing TCP input for the given port. Only used for direct forwarding from the PCE. Syslog events pulled from Amazon S3 must be configured separately using the AWS S3 TA. | N | - | 514 |
Enable TCP SSL | Toggles SSL for the created TCP syslog input. The [SSL] stanza must be configured separately. | N | True | - |
Port Scan Interval | The interval, in seconds, within which Port Scan Threshold scanned ports will trigger an alert. | Y | 60 | - |
Port Scan Threshold | Defines a threshold that will trigger an alert when more than the configured number of ports are scanned within Port Scan Interval seconds. | Y | 10 | - |
Port Scan Allowed IPs | Comma-separated list of source IP addresses to exempt from port scan alerts. | N | - | 10.0.0.1,10.0.0.2 |
Quarantine Labels | Optional comma-separated list of label key:value pairs that represent a quarantine zone scope in the PCE. Configured labels are applied to selected workloads when the illumio_quarantine action is run. The labels must exist in the PCE and any policy that restricts access to the quarantine zone must be defined separately. It must be of the form key1:value1,...,keyN:valueN Keys and values are case-sensitive. | N | - | app:A-Quarantine,env:EQuarantine, loc:L-Quarantine |
CA Certificate Path | Optional path to a custom CA certificate bundle | N | - | $SPLUNK_HOME/etc/ apps/TA-Illumio/certs/ ca.pem |
HTTP Proxy Address | HTTP proxy address. | N | - | http://my.proxy-server. com:8080 |
HTTPS Proxy Address | HTTPS proxy address. | N | - | https://my.proxy-server. com:8443 |
HTTP Retry Count | Number of times to retry the connection to the PCE. | N | 5 | - |
HTTP Retry Interval | The total HTTP request timeout for the PCE in seconds. | N | 30 | - |
Interval | Input run schedule in seconds or as a cron expression. | Y | 1800 | */30 * * * * |
Index | Splunk index for the input to write events to. | Y | default (main) | - |
Configure TCP SSL
To configure syslog forwarding encrypted with TLS, both a [tcp-ssl] stanza and an [SSL] stanza must be configured in $SPLUNK_HOME/etc/apps/TA-Illumio/local/inputs.conf.
The TCP-SSL stanza will be created automatically as described above, but the `[SSL]` stanza must be created manually. This step only needs to be done once for any number of Illumio inputs.
When using an existing certificate authority, generate a server certificate for Splunk with the CN or SAN set to the Splunk instance hostname or IP address.
When using a self-signed certificate, refer to the Splunk documentation on generating and configuring self-signed TLS certificates. Make sure that the root CA certificate is created with extensions and the ca flag is set to true (checked by syslog-ng validation).
Create the SSL stanza with the following fields:
[SSL]
serverCert = /path/to/my/splunk_server.crt
sslPassword = splunk_server_cert_pass
Restart Splunk.
Note
Do not use the Splunk default certificates when configuring SSL.
Configure Syslog Forwarding for On-Prem PCEs
In the PCE, open the Settings submenu on the left side of the screen and select Event Settings.
Click Add to create a new Event Forwarding rule.
Select the event types to forward to Splunk.
Click Add Repository.
Enter a description for the repository and the Splunk hostname/IP and the port value of the TCP stanza created for the Illumio input. Leave the protocol value as TCP.
If TCP-SSL is configured in Splunk for the target port, set the TLS field to Enabled and upload a certificate bundle containing the root and any intermediate certificates in the chain for your CA.
Note
If you are enabling TLS, the address value must match the CN or SAN of the Splunk server certificate.
Select the Verify TLS option to ensure that your certificates and TLS configuration are valid.
Click Add and select the option for the created repository.
Click Save.
A test event will be sent to Splunk to verify the connection.
In Splunk, run the following search to make sure that the test event arrived:
index=illumio_index sourcetype="illumio:pce" "Testing syslog
connection from PCE"
Configure Syslog Forwarding for Cloud PCEs
Reach out to Illumio Customer Support to configure Syslog event forwarding to AWS S3. The target bucket can be internal or managed by Illumio.
After the bucket is configured, make sure the Syslog files are being sent.
Install the AWS S3 TA from Splunkbase.
Follow the configuration instructions for Generic S3 inputs in the AWS S3 TA documentation.
Create two inputs, one for auditable events and one for collector (traffic flow) events.
In each input, specify a Log File/S3 Key Prefix with the path to either auditable or collector event logs within the S3 bucket.
Install the Illumio App for Splunk
Note
The Illumio Add-On is required for the Illumio App for Splunk to work.
Installing the Illumio App for Splunk Using the Splunk UI
In the Splunk UI, navigate to the Manage Apps page using the Apps drop-down in the top-left corner or by clicking the gear icon next to Apps on the Splunk homepage.
Click Browse More Apps and search for IllumioAppforSplunk.
Click Install.
Enter your Splunk login credentials when prompted, and then click Agree and Install.
If prompted, restart Splunk.
Installing the Illumio App for Splunk Manually
Navigate to the Illumio App for Splunk app in Splunkbase.
Log in using your Splunk credentials.
Click Download.
Read through and accept the EULA and Terms and Conditions, and then click Agree to Download.
Transfer the downloaded .tgz or .spl file to the Splunk server.
Install the app manually:
Using the Splunk binary:
$SPLUNK_HOME/bin/splunk install app /path/to/IllumioAppforSplunk.tgzOr by extracting directly under /apps:
tar zxf /path/to/IllumioAppforSplunk.tgz -C $SPLUNK_HOME/etc/apps/Restart Splunk.
Configure the Illumio App for Splunk
Use the procedures in the following topics to configure the Illumio App for Splunk.
Create an Index for Illumio Events
Note
This is an optional step, but it is recommended. If you already created one or more indexes when you configured the Illumio Technology Add-On for Splunk, skip this step.
Navigate to Settings > Indexes.
Click New Index in the top-right corner.
Enter an index name and select Illumio App for Splunk from the App drop-down menu.
Set the other index parameters based on your expected event volume and retention policy.
Click Save.
Note
Make sure to configure the index based on your organization's compliance requirements and data retention policies. See Managing Indexers and Clusters of Indexers.
Update the illumio_get_index Macro
Navigate to Settings > Advanced Search > Search Macros.
Select Illumio App for Splunk from the App drop-down menu.
Click the illumio_get_index macro name to open the edit form.
Update the definition to reference one or more indexes, such as
(index="illumio_pce1" OR index="illumio_pce2").Click Save.
Accelerate the Illumio Data Model
This step is optional, but it is recommended. See Data Model Acceleration.
Install the Sankey Diagram App
The Traffic Explorer dashboard renders traffic flows using the Sankey diagram custom visualization app. The app is required for displaying the panel but it is not required.