Troubleshooting Splunk Integration Apps
Use the information in the following topics to troubleshoot your Splunk integration apps.
Illumio Technology Add-On for Splunk
If you encounter a problem with the TA, check the logs in splunkd.log by running the following search in the UI:
index=_internal sourcetype=splunkd TA-Illumio
Or by searching the log directly from the filesystem:
tail -c100000 $SPLUNK_HOME/var/log/splunk/splunkd.log | grep -i TA-Illumio
If the Illumio input is not running:
Make sure that the python.version value for the server and input are set to python3.
Check that the input interval is not too high.
Make sure that the input is enabled under Settings > Data Inputs > Illumio.
Check the Splunk logs for any issues that could cause modular inputs to fail.
Check that you aren't hitting your Splunk license limits.
Restart Splunk to force the input to run.
Event Forwarding (On-Premises PCE)
If you see a validation error while configuring Event Forwarding using TLS:
Make sure that the CA certificate being used contains the entire CA chain, including the root and any intermediate certificates.
Check that the PCE can resolve the Splunk server using a tool like
nslookupordig.Make sure that the [tcp-ssl] stanza in Splunk is correct and the Splunk server is listening on the specified port. For example, to check that Splunk is listening on port 514:
sudo lsof -i -n -P | grep TCP | grep 514
Verify that the hostname or IP address used for the connection is set as the CN or a SAN in the Splunk server certificate:
openssl x509 -text -noout -in $SPLUNK_HOME/etc/certs/splunk.pem
Test the TLS connection from the PCE to Splunk:
openssl s_client -connect my.splunk.com:8443 -CAPath /path/to/ca/certificates/
Forwarded Events Do Not Show Up In Splunk
Make sure that the index value configured for the Illumio input is correct.
Check that all desired event types are selected in the PCE's Event Forwarding settings.
Check for errors in the
syslog-nglogs in/var/log/messageson the PCE.If TLS is enabled for the connection, make sure that the
[tcp-ssl]and[SSL]stanzas are configured correctly ininputs.conf.Make sure that the TCP input has
sourcetype = illumio:pce.
Data Not in kvstore
If data is not showing up in the illumio_* metadata stores:
If you are using a distributed Splunk environment, make sure to set replicate = true for all collections in
$SPLUNK_HOME/etc/apps/TA-Illumio/local/collections.confto enable replication across all indexers.Check
$SPLUNK_HOME/var/log/splunk/mongodb.logfor any start-up or runtime errors with mongoDB.Call the Splunk API endpoint for the collection to check if objects are being stored.
Check that the
transforms.confstanza for the collection lookup is configured correctly.
Test the PCE Connection
When an Illumio modular input is created, the connection to the PCE is validated, and any connection issues will be presented to the user in the error dialog on the input configuration page. Check splunkd.log for additional error logs. If you can't determine the cause from the logs, try the following:
Use a tool like
nslookupordigfrom the Splunk server to make sure that the PCE host is resolvable and that there is no issue with the DNS nameserver.Use curl or wget to establish an HTTP connection from the Splunk server to the PCE:
curl -L -U "<api_key>:<api_secret>" "https://my.pce.com:8443/api/v2/health"Make sure that the API key used for the connection is valid and has read access to policy objects.
If you are using internal or self-signed certificates, make sure that Splunk is using the correct CA chain.
You can also use the illumio_connection_test.py script to validate the PCE connection from the command line:
> python $SPLUNK_HOME/etc/apps/TA-Illumio/bin/illumio_connection_test.py

Enter PCE hostname: my.pce.com

Enter PCE port: 8443

Enter PCE org ID: 1

Username or API key ID: api_...

Password or API key secret: ...
You can also set these values using the following environment variables:
export ILLUMIO_PCE_HOST=my.pce.com

export ILLUMIO_PCE_PORT=8443

export ILLUMIO_PCE_ORG_ID=1

export ILLUMIO_API_KEY_USERNAME=api_...

export ILLUMIO_API_KEY_SECRET=...
The script output should help to narrow down the cause of the connection failure.
Troubleshooting the Illumio App for Splunk
Make sure that TA-Illumio is installed and configured. Check that events and metadata are being received from the PCE.
If the app dashboards are not being populated:
Check that the illumio_get_index macro has been set and make sure that it points to the correct index.
Make sure that the configured index or indexes contain data within the given time range by running the following search:
`illumio_get_index` | stats count by sourcetype
The results should contain one or more sourcetypes with their respective event counts.
Check if the search time range extends further back than the index retention policy.
Check that you aren't hitting your Splunk license limits.
If the dashboards or visualizations appear to load incorrectly or behave in expected ways:
Try to clear the static cache using your Splunk instance's
https://my.splunk.com/en-us/bumpendpoint.
If the dashboard visualizations are slow to load or searches are delayed:
Try reducing the time range of the search.
Enable acceleration for the Illumio data model (see Data Model Acceleration).
Check if searches are lagging or being delayed because of other jobs or processes running in the background.
Check if the time range your search is being run in accesses cold buckets in your index. If your daily volume is high, you may need to increase the
maxWarmDBCountinindexes.confto delay the roll-over from warm to cold.Increase the compute resources allocated to your Splunk instance or cluster.
Troubleshooting Illumio Technology Add-On for Splunk Version 4.0.2
Check splunkd.log for the logs for kvstore operations.
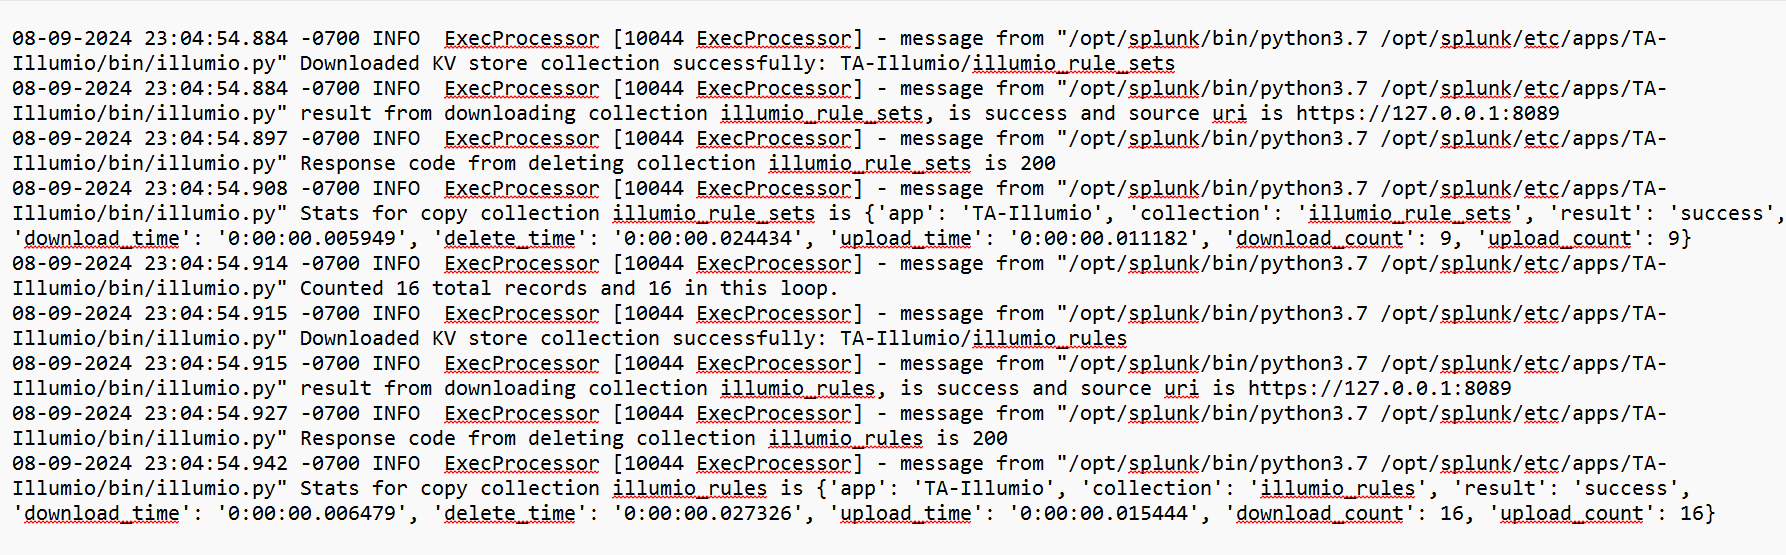
Do the following:
Create a local copy of all collections defined in TA-Illumio.
Delete the collections on remote nodes.
Upload local files to the remote nodes.
If dashboards are not loading as expected and are empty, on the HF, verify that the lookups contain data using the following command:
| inputlookup illumio_labels_lookup
If the results are empty, then verify that the data inputs that were defined using modular input and verify that the HF is able to reach the search head using the credentials that you added in the modular input.
Also verify events coming into Splunk, because sometimes the HF forwards data to the search head but the search head fails to render any dashboards. The HF contains an option to keep a copy of the data that is being forwarded. Select the copy to verify that the data was input.
Refer to splunkd.log to see if uploading or copying kvstore files to the remote nodes is erroring out.
