Troubleshooting
This section provides tips to diagnose and fix common issues.
Data Collection Not Working
After installing the application, all dashboards should start populating data. If you don’t see data in the dashboards, use the following steps for troubleshooting:
If you specified a non-default index in the Data Input, confirm that you have modified the
`illumio_get_index`macro with indexes selected while creating Data Inputs (Modular inputs) and that you have modified the Advanced search for either the default index or your custom index. See Index, Source, and Source Types.Run the following query to verify that data is being indexed into Splunk:
search `illumio_get_index` | stats count by sourcetypeVerify that
SPLUNK_HOMEis pointing to the correct Splunk directory.Look for errors in the
ta-illumio.logfile. This file is in the$SPLUNK_HOME/var/log/TA-Illumio/folder.Check to see whether the selected time range covers the time when the traffic flow summaries were generated.
If data model acceleration is disabled, graphs will not display. Enable data model acceleration. See Accelerate Data Model.
Can’t Use Same Port in New Data Input (Modular Input)
Symptom: After deleting an existing configured data input (modular input), you can’t create a new modular input on the same port.
Cause: The port number is still in the Data Input TCP ports list.
Fix: Remove the port from the Data Input “TCP” ports list before you try to use the same port again. This enables you to reuse the port which was configured in the previous data input (modular input).
Data Not Available Immediately After Configuring Data Inputs (Modular Inputs)
Symptom: Upon successful creation of data inputs (modular inputs), 5 minutes elapse before data starts indexing.
Cause: 5 minutes is the default time interval configured.
Fix: No action is required. This is expected behavior.
Authentication Failure on Data Input (Modular Input) page
Check the network connectivity in between applications to ensure that there are no connectivity issues.
Ensure that the API Key and API Secret stored in the setup page are in sync with the API key generated by the Illumio PCE. As required by App certification, these secrets are stored in a secure key store. If the data input (modular input) is modified, they will need to be entered again, because they cannot be read back from the secure key store.
If the Illumio application is deployed on a non-trusted CA or using a self-signed certificate, you need to provide the certificate directory path. You also need to provide the correct certificate validation trust chain to the certificate.
Quarantine Button Grayed Out or Does Not Work As Expected
Cause: For a user to be able to use the Quarantine button, the Splunk user needs to have both the admin role and the illumio_quarantine_workload role. If the button is green but does not work as expected, it is likely because of a missing admin role. To investigate the cause, check the ta-illumio.log file for error messages.
Fix: To grant the required roles, use the steps in Access to Quarantine Workload Action.
Invalid Certificate File Error on Data Input (Modular Input) Page
Cause: The PCE may present an SSL certificate issued by different authorities such as a primary CA, a secondary CA, a local CA authority or even a self-signed certificate. For correct SSL operation, the Splunk server must be able to fully trust the PCE’s certificate and verify the certificate’s trust chain.
Fix: When a local CA Authority issued SSL certificate or a self-signed SSL certificate is used with the PCE, you need to upload the CA Certificate bundle onto the Splunk Server and provide the full path to the directory that contains the certificate in the data input.
If using a local CA Authority or a certificate issued by a secondary CA, the Splunk server CA trust chain must be updated to verify the certificate presented by the PCE.
For example, on Linux, use the update-ca-trust tool. Copy the certificate chain to /etc/pki/ca-trust/source/anchors/ and then run the following commands:
update-ca-trust force-enable
update-ca-trust extract
update-ca-trust check
See Splunk documentation for further information.
PCE labels Are Not Updated in the Security Operations Dashboard
Symptom: If there are new labels, or workloads are added to the PCE, the new labels and workloads will not be visible right away.
Cause: The default interval to sync workloads and labels from the PCE is set to a minimum of 60 minutes. This period is configurable through the data input. The newly added labels or workloads on the PCE should be available in the Splunk App after an interval of 60 minutes.
Fix: To force a resync of labels to the PCE, you can disable and enable the TA. This forces the TA to make API calls to the PCE. This operation should be used with caution because of the additional API calls to the PCE.
Security Operations Shows “Search is waiting for input”
Symptom: When upgrading an older version of the app, the Security Operations panels do not display graphs. Instead, they display "Search is waiting for input ...".
Cause: Old dashboard files are stored locally on the Splunk server.
Fix:
Delete the
$SPLUNK_HOME/etc/apps/IllumioAppforSplunk/localfolder.Restart Splunk.
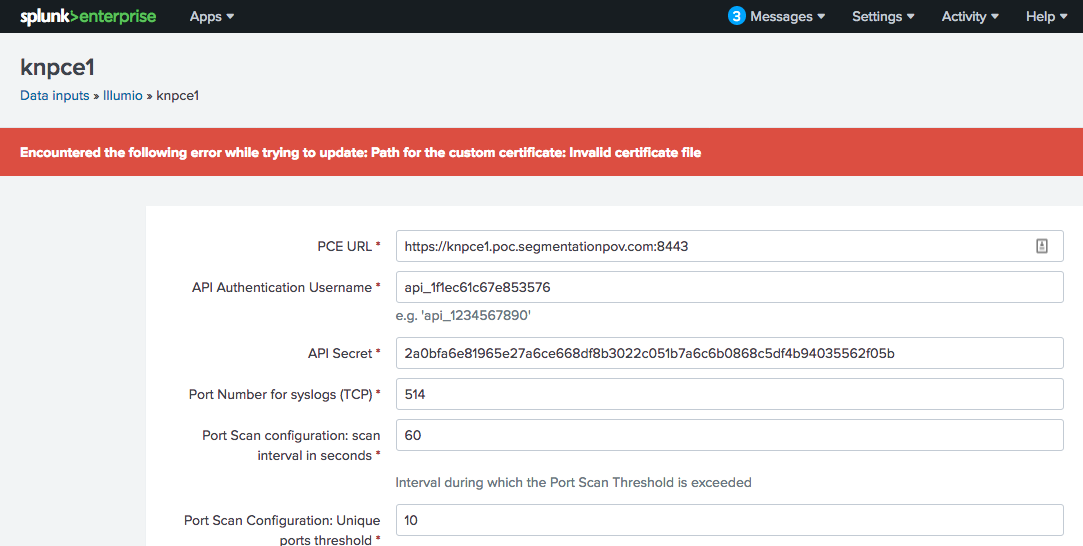
Path for the Custom Certificate: Invalid Certificate File
Symptom: An error is generated in the Policy Compute Engine (PCE) ta-illumio.log file when attempting to add Illumio Data Inputs. Saving any information for the Data Inputs is not allowed.
Error from the /opt/splunk/var/log/TA-Illumio/ta-illumio.log file:
2018-10-24 16:33:48,844 - Illumio_MODINPUT - ERROR - Path for the custom certificate:
Invalid certificate file
A Splunk error, due to PCE certificate trust, is also displayed:
 |
Cause: This error is an indication that a PCE certificate was not trusted, even though the certificate has already been added to the local system certificate store.
Fix: Adding Illumio Data Inputs allows the Illumio App for Splunk to connect to a configured PCE to extract data for PCE health and workloads information. When the Illumio App for Splunk attempts a connection to the PCE, it can fail due to a certificate trust even when a local browser trusted the PCE certificate, since it was already added to the local system certificate store. Splunk uses a Python library that is local to the Splunk application, so it carries its own local certificate authority file that it trusts.
There are two ways to add a secure trust to the PCE:
Add both intermediate and root certificate authority to the local Python
cacert.pemfile:In Windows:
C:\Program Files\Splunk\Python-2.7\Lib\site-packages\requests\cacert.pemIn Linux:
/opt/splunk/lib/python2.7/site-packages/requests/cacert.pem
You can also create a certificate file that includes the PCE server certificate, intermediate certificate, and root CA certificate in that order, and then place the file in the Splunk home directory. The certificate should be in PEM format. Use the following steps:
Use a text editor to cut and paste the certificate chain and avoid extraneous characters. The Splunk home directory is as follows:
Windows Splunk home directory:
C:\Program Files\Splunk\Linux Splunk home directory:
/opt/splunk/
Export the certificates using any browser, and then cut and paste them together. The following is an example of what should be in a certificate file:
-----BEGIN CERTIFICATE----- < Server Certificate base64 encoded >
-----END CERTIFICATE-----
-----BEGIN CERTIFICATE-----
< Intermediate Certificate base64 encoded >
-----END CERTIFICATE-----
-----BEGIN CERTIFICATE-----
< Root CA Certificate base64 encoded >
-----END CERTIFICATE-----
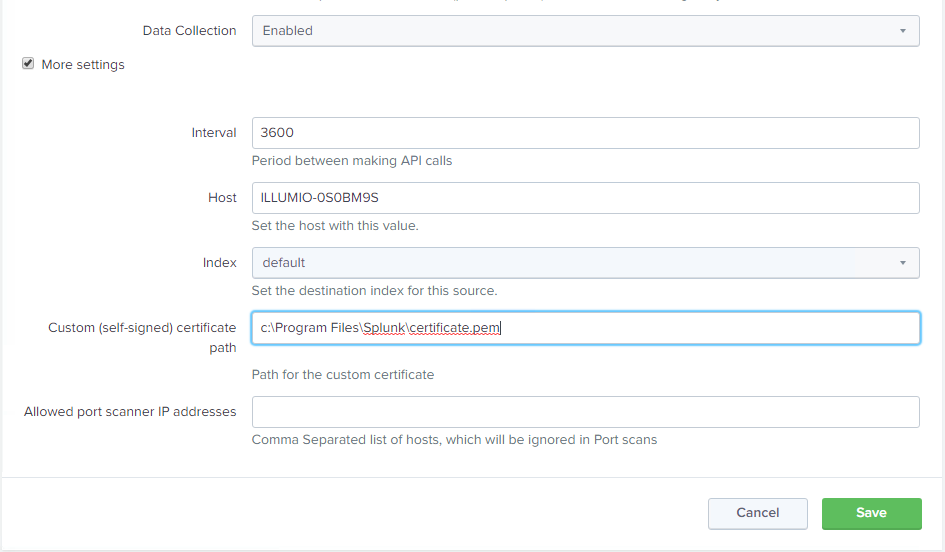
To set the path in the Illumio Data Inputs, navigate to Settings > Data Inputs > Illumio, select the input, check the More settings checkbox, and provide the path to the certificate in the Custom (self-signed) certificate path field.
Authentication Failed: Invalid PCE URL or API Key Id or API Secret
Symptom: When applying data inputs in Splunk for the Illumio App for Splunk, you receive the following error from the Splunk UI: “Authentication Failed: Invalid PEC URL or API key id or API Secret.”
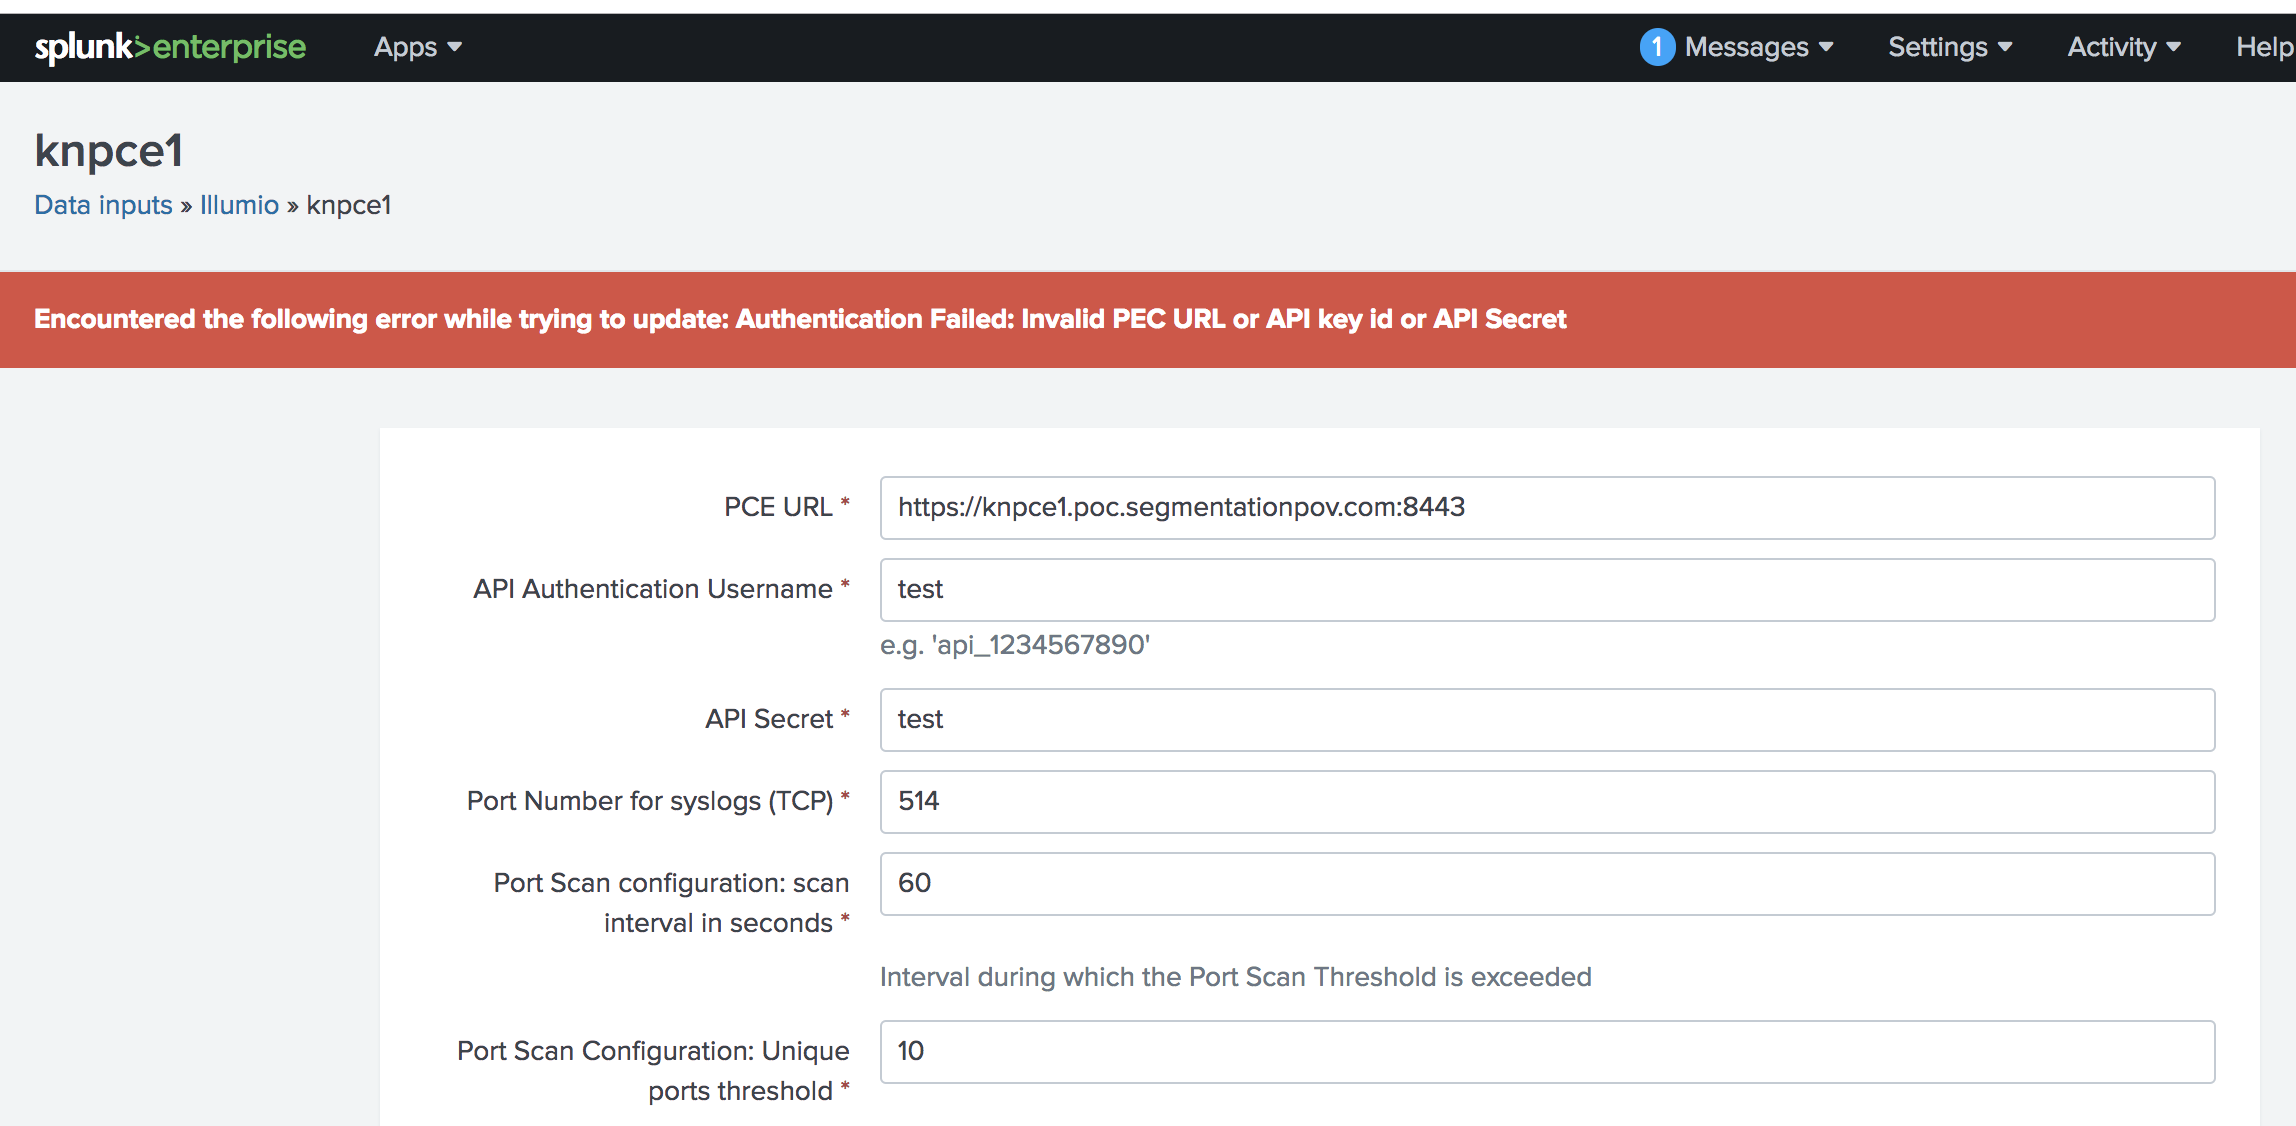 |
The error also appears in the /opt/splunk/var/log/TA-Illumio/ta-illumio.log file.
Cause: This error is caused by an authentication issue to the Policy Compute Engine (PCE). When this occurs, data inputs will not be saved until a valid API response is received from the PCE with the correct API Authentication username and API secret.
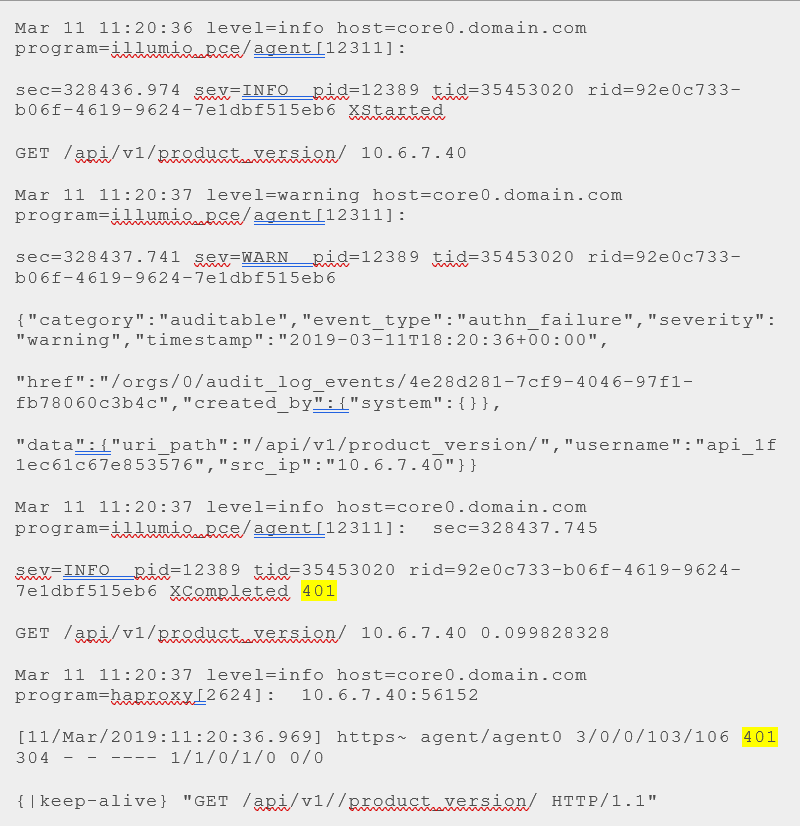
Fix: To validate an authentication failure, look at the PCE core node haproxy logs, which will show a 401 auth failure HTTP response (highlighted in yellow in the example below):
To see whether the API username/secret is correct, use the cURL command below and validate it with the logs from PCE core nodes:
Copy and paste the curl command below with the correct API username/secret:
- - - Begin copy (change api username/secret) - - -
curl \
-u \
api_1f1ec61c67e853576:2a0bfa6e81965e27a6ce668df8b3022c051b7a6c6b
0868c5df4b94035562f05b
\-H Content-Type:application/json \
-X GET \
'https://pcecore0.domain.com:8443/api/v1//product_version/' \
| python -mjson.tool
- - - End copy - - -


Successful curl request logs from PCE core nodes with 200 http response code:

Mar 11 11:45:44 level=info host=core0.domain.com
program=illumio_pce/agent[23340]:  sec=329944.610 sev=INFO

pid=23408 tid=24064620 rid=063accb6-7036-46f0-96a1-8726f14436ea
XStarted GET /api/v1/product_version/ 10.6.7.40

Mar 11 11:45:44 level=info host=core0.domain.com
program=illumio_pce/agent[23340]:  sec=329944.734 sev=INFO

pid=23408 tid=24064620 rid=063accb6-7036-46f0-96a1-8726f14436ea
XCompleted 200 GET /api/v1/product_version/ 10.6.7.40
0.124496975

Mar 11 11:45:44 level=info host=core0.domain.com
program=haproxy[2624]:  10.6.7.40:56446
11/Mar/2019:11:45:43.966]
https~ agent/agent0 643/0/0/126/769 200 442 - - ---- 2/2/0/1/0
0/0 {115|keep-alive} "GET /api/v1//product_version/ HTTP/1.1"
On the Splunk server, a successful request will allow the data inputs to be saved without any errors in the PCE web console or the /opt/splunk/var/log/TA-Illumio/ta-illumio.log file. Tail the ta-illumio.log when configuring the data inputs to see the latest logs. Enabling and disabling the data inputs will trigger the request to the PCE, which is a good way to test it.
The data input information should be saved in the location below without the API username/password:
/opt/splunk/etc/apps/IllumioAppforSplunk/local/inputs.conf

[illumio://knpce1]
api_key_id =
api_secret =
cnt_port_scan = 10
enable_data_collection = Enabled
interval = 3600
pce_url = https://pce.domain.com:8443
port_number = 514
self_signed_cert_path = /opt/splunk/custom_certificate.cer
time_interval_port = 60
disabled = 0
Sankey Diagram Is Not Displayed in the Traffic Explorer Dashboard
You need to install the Sankey Diagram App to be able to visualize the diagram in the Communications Map Between Labeled Workloads panel.
Label Filters Are Not Populated
The App, Env, and Loc label filters are not populated.
Try to run the "Illumio_Workload_Mapping" saved search via expanding time range.
Make sure that the interval configuration for inputs is less than 24 hours.
Failed to Start KV Store Process Error Occurs
Use the following steps to resolve this issue:
Open the CLI of the search head and go to the Splunk bin directory or cd to
/opt/splunk/bin and type ./splunkfor all of the following commands.To see the status of the KV store, enter the following command:
# splunk show kvstore-status -auth <user_name>:<password>.Use the following command to check the FQDN of your server:
# hostname - fqdnCopy the FQDN.
Create a new SSL certificate in the
/opt/splunk/etc/authdirectory and run the following command to create an SSL certificate for this server using the FQDN that you copied:(Run this command if the search head is in a distributed environment and not in a cluster environment.)
# splunk createssl server-cert 3072 -d /opt/splunk/etc/auth -n server -c <FQDN>You will see that one new .pem file has been generated.
Restart Splunk to load the certificate.
Check the status of kvstore again using the following command:
#./splunk show kvstore-status -auth <user_name>:<password>The status should show as ready.
After you perform these steps, when you log back into Splunk, the error messages will no longer display and your app will most likely be working again.