Search traffic
This topic describes the steps for searching the Illumio Segmentation for the Cloud traffic, found in Cloud > Explore, and provides a general example of how you would use it. For an overview of the Traffic page, including Risk Report generation, see Traffic. For information on how to use the search function, see the in-application pop-up on the Traffic page.
Navigate to the Traffic page to get a view into your traffic patterns over a specified time period.
Searching Traffic Guidelines
Use Time Slider and the Filter to view traffic patterns during specific time periods.
About the Traffic Time Slider
The Traffic Time Slider provides a visual representation of traffic spikes over the last 24 hours, 7 days, 14 days, or a custom-defined time range. It displays the total number of flows within the selected period, allowing for in-depth traffic analysis. You can zoom into a specific timeframe to examine flow activity in greater detail. For instance, selecting a single bar reveals traffic data for that moment, while selecting a range of bars enables deeper analysis over the chosen period.It also provides detailed flow information, including flow status, source and destination, and the timestamps when flows were detected.
Using the Traffic Time Slider
For best results, Illumio recommends viewing videos in Chrome.
Apply any filters. See About the Filter.
Click and drag to select one or more bars to zoom.
The Traffic Time Slider view and the traffic list table update simultaneously.
Hover over a bar to see the time frame and the number of flows. Right click to zoom or download a .png of all the visible bars.
Click Reset Zoom to reset the view.
About the Filter
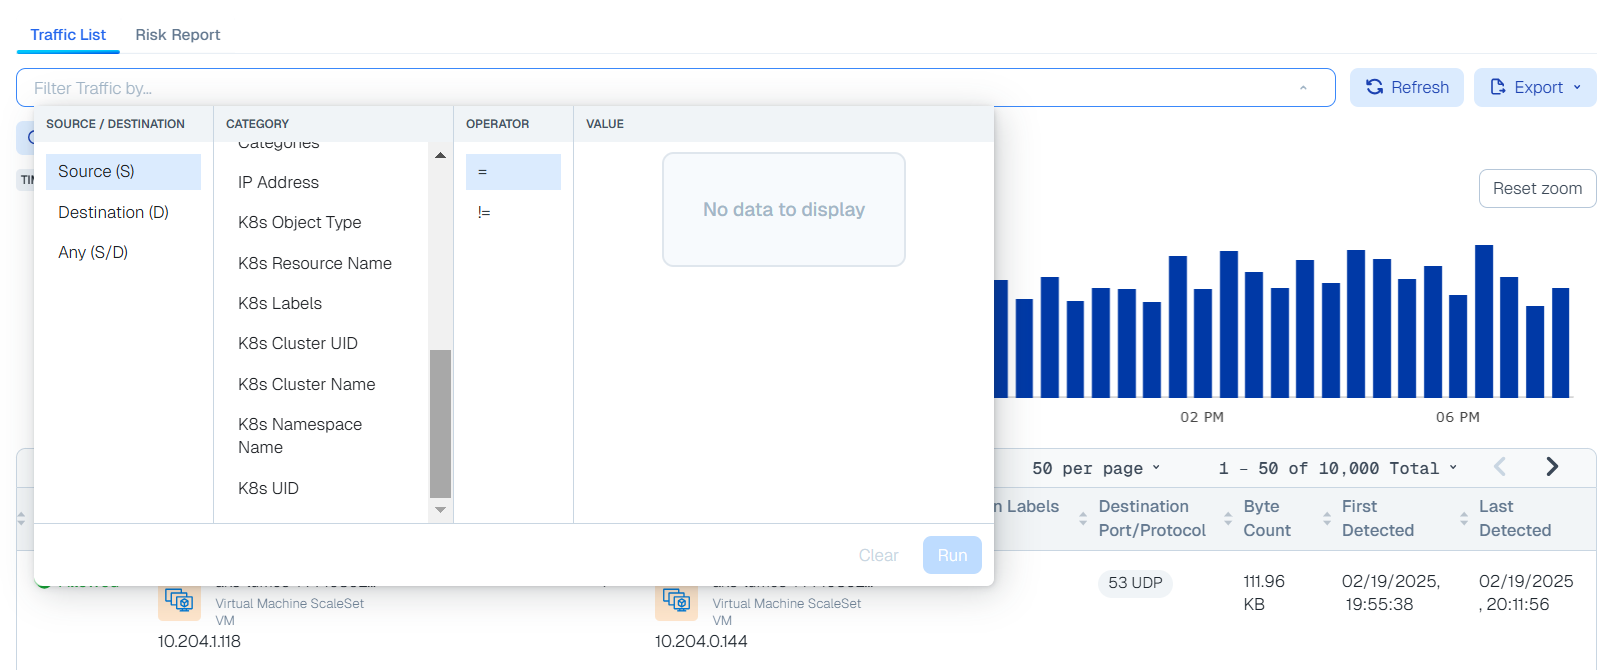
Use these guidelines to define filters and search for traffic patterns. Click in the filter field to start narrowing your search parameters.
Use operators such as '!=' and '='
Select the Match All Conditions (AND) or Match Any Conditions (OR) dropdown to switch the automatically inserted joiners from OR to AND. You can add additional search terms without deleting existing terms.
Filter by:
Source/Destination (can change depending on Category selection)
Category
Categories include the following:
Cloud
Account
Label
Flow Status
IP Address
Port
Subnet
VPC
Known Network
Resource Type
Kubernetes categories include the following:
K8s Object Type
K8s Resource Name
K8s Labels
K8s Cluster UID
K8s Cluster Name
K8s Namespace Name
K8s UID
Operator (can change depending on Category selection, such as the Label category, which has '=' but not'!=')
Value (these include label name, port, and IP address). Note that if you type an IP address, the numerals appear in the search bar before they appear in the value field in search menu.
When filtering by Known Networks, the Inventory page Known Networks tab provides the values that populate your filter. See Inventory.
Click Run to apply your filter and display the results
Hover over your result entries to see a brief list of details. Click on your result entries to see more details. For example, click on a resource to go to its Inventory details page, or click on labels, ports, and the like to see a details panel about the flow.
Click Refresh to refresh the traffic data.