Illumination Plus Table View
The Table view of Illumination Plus displays search results in a traditional table format. You can use the Table view in the following ways:
To write rules for specific connections; see Add Rules for Traffic Using Illumination Plus
Create unmanaged workloads from IP addresses; see Create Unmanaged Workloads from IP Addresses
Traffic exploration
View the details about policy affecting each connection
About the Table View
Using the Table view, you can query the PCE's traffic database to analyze traffic flows for auditing, reporting, and troubleshooting. You can search for traffic flows between workloads or hosts, labeled workloads, or IP addresses, and you can restrict the search by specific port numbers and protocols.
The VEN decorates the flow summary logs with DNS names when it sends them to the PCE. In the Table, the PCE appends the DNS names to the flow logs so that auditors and SOC analysts can look at these DNS names instead of performing reverse look-ups on random IP addresses.
When you want to search for traffic flows on a regular basis, you can save that filter and it appears under your Saved filters in the Load Filter drop-down list. You can save up to 100 filters. You can make changes to an existing Saved filter and save the modified query. The Table view also displays your ten most recent searches.
Searches
When you search data in the Table view, you are searching traffic flows between providers and consumers over a specific time period over a specific port and protocol. A search consists of the following elements:
Consumers: Enter workloads, IP addresses, or labels that are consuming the service provided in the traffic flow. The entries you add in the filter that includes the data are used as a search criteria and the ones you add in the a field that excludes data are not used in the search.
Providers: Enter workloads, IP addresses, or labels that are providing the service in the traffic flow. The entries that you add to include the data are used as a search criteria and the ones you add to exclude the data not used in the search.
Note
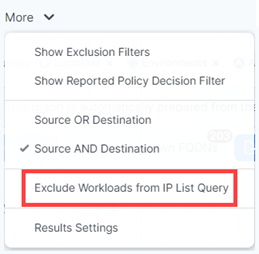
You can choose to search either “Consumers And Providers” or “Consumers Or Providers” by selecting the option from the More menu.
Services: Enter port and protocol, port ranges, process, Windows services, or policy services. Enter port numbers and protocol types to search for traffic flows whose destination port values and protocols match the search criteria. The entries you add to include in the search are used as a search criteria and the ones you add to exclude data are not used in the search. If you do not specify a value, all ports, protocols, port ranges, processes, and services are included in the search.
Time: Select how far in the past (last hour, day, week, month, or anytime) or specify a custom time range. The custom time filter displays all the flows between the selected from-to date-time stamp.
Reported Policy Decision: Select the type of policy decision to search for flows with a specific policy decision reported by the VEN.
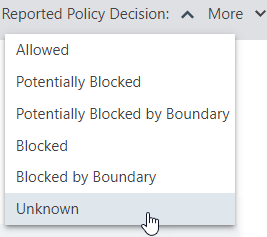
See Enforcement Boundaries and the Table View in this topic for more information.
Exclude Workloads from IP List Query: (Available in the More drop-down menu.) This setting applies to queries that contain an IP list in the Consumer or Provider fields. It specifies whether known managed and unmanaged workloads are excluded from the query results. When selected (the default setting), managed and unmanaged workloads are excluded from query results when their IP addresses are within the range of one of the IP lists in the query. When this option is not selected, workloads are not excluded from the query results.
Export Query Results
In the Table view, click Export to gather your data in a. CSV file for the results from the current query.
To export results from previous queries, click Load Results to display queries from the past 24 hours. Click the Export button in the Action column for the results you want to save as a CSV file.
The exported CSV file uses a separate column for each label type, and the column data is alphabetized.
Important
If you are an Illumio Core customer who has upgraded to 22.5.0 and are using Illumination Plus, be aware that the format of exported CSV files has changed from previous releases of Illumination Classic. You should update any scripts that you used for processing these CSV files.
View by Label-Set Connections
In the Table view, you can view aggregated results of the Consumer and Provider labels for traffic flows or view all traffic flows for a query. To choose the type of view you want, select the option from the Label-Set Connections drop-down menu:
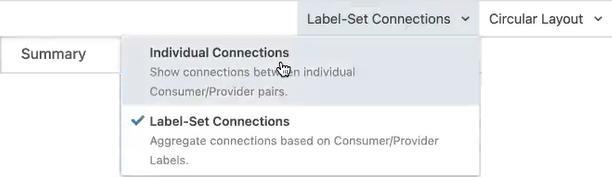
Using this feature, you can see a more concise view of your traffic flows.
Important
This setting is important because to write rules from the Table view, you must be viewing the Table using Label-Set Connections. The Allow Selected Connections button in the Table view is disabled until you choose this setting.
The view for label-set connections displays the Draft rules based on the label queries; whereas the view for individual connections displays the workload-to-workload rules, which can take longer to display the list but can be more accurate. Toggling back to a label-set connections view after displaying the individual connections does not reload the page so that the page displays quickly.
View Policy Details from the Table
The Illumination Plus Table includes a Policy Decision column (either Reported or Draft depending on the view selected), which indicates whether traffic flows are allowed, blocked, or potentially blocked based on your policy.
When you see traffic flows that are potentially blocked, it could mean that you haven't created rules for those flows or you have rules written for the flows, but the provider workload enforcement is set to Visibility Only for those flows.
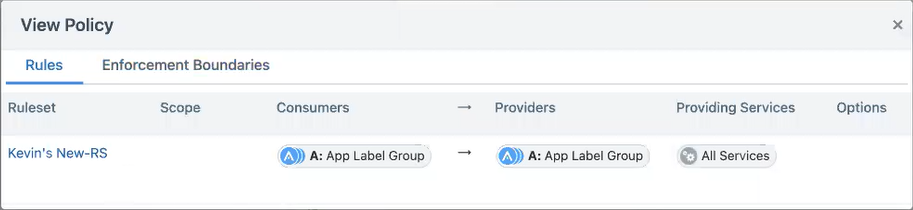
Clicking a link for Blocked or Allowed traffic opens the View Policy dialog box. When applicable, the dialog box displays in separate tabs all your policy, including Enforcement Boundaries, rules, and Essential Service rules that apply to the selected traffic flow
Enforcement Boundaries and the Table View
Enforcement Boundaries are displayed in Draft and Reported views of the Table. When you view your traffic flows in the Table, you see whether traffic is blocked by an Enforcement Boundary or allowed through an Enforcement Boundary. Viewing this information is useful to determine where Enforcement Boundaries are in place and understand the impact of the boundaries before provisioning them.
Tip
To view the details about an Enforcement Boundary, click the linked text for traffic allowed across a boundary (“Allowed”) or blocked by a boundary (“Blocked”) while in a Draft view of the Table. The View Policy dialog box opens. Then, click the Enforcement Boundaries tab.
You can obtain the following information:
An Enforcement Boundary is blocking a traffic flow.
Traffic is potentially blocked by an Enforcement Boundary.
An Enforcement Boundary is in place, but the workload is still in visibility-only mode. The traffic won't be blocked by the boundary until you move it into selective enforcement mode.
An Enforcement Boundary is in place, but a rule is allowing traffic through the boundary.
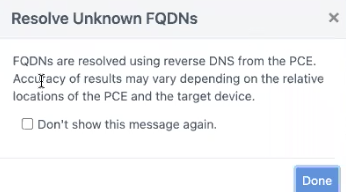
Resolve Unknown FQDNs
Click Resolve Unknown FQDNs to export FQDN information for unknown IP Addresses and Done from the confirmation dialog box.
Click Export. This button appears next to Resolve Unknown FQDNs.
Note
Clear cached FQDN values and reload the results if you do not find relevant information.
Depending on the number of draft rules, the data might be slow to load. Once it loads, columns called Draft Policy Decision and Reported Policy Decision will be populated with data and will appear in the exported zip file.