Dashboards
The Illumio App for Splunk has multiple dashboards to display system activities associated with the PCE instance. You can access the following dashboards from the top row of the app:
Security Operations Dashboard
PCE Operations (On-Prem Only) Dashboard
PCE Authentication Events Dashboard
Workload Operations Dashboard
Workload Investigation Dashboard
Traffic Explorer Dashboard
Alert Configuration Page
Change Monitoring Dashboard
Alerts Page
Security Operations Dashboard
The Security Operations dashboard provides an overview that allows Splunk administrators to monitor the overall security state of the network, as determined from traffic flows reported by PCE instances. Top Blocked, Potentially Blocked, and Allowed traffic is displayed by host and by service. To see Allowed traffic, choose it in the drop-down list under Top Workloads With or Top Services With. In most panels, you can filter flows using Illumio labels. You can also drill down to investigate notable events, such as Port Scans and Firewall Tampering.
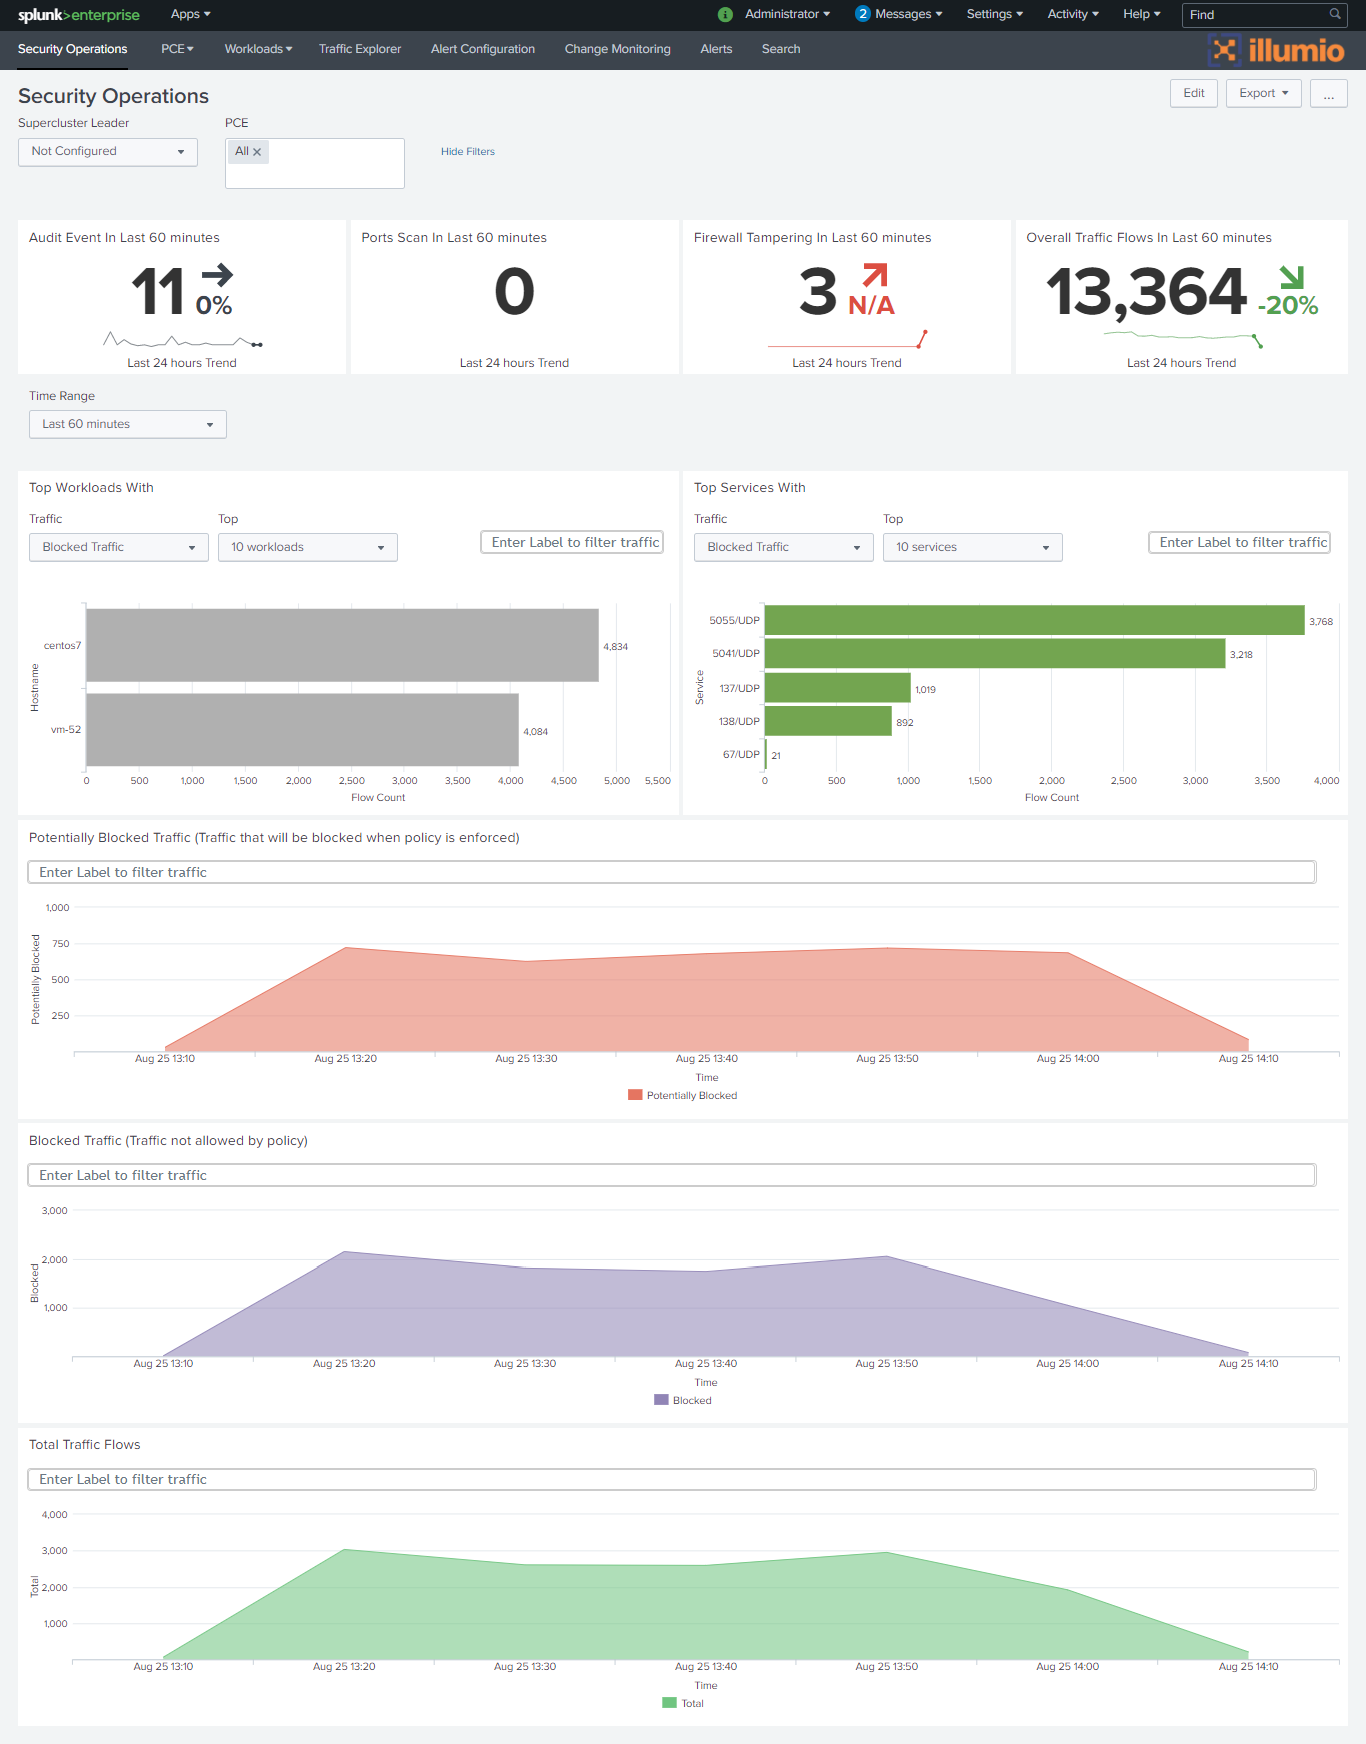 |
The Security Operations dashboard is built using data from the following sources:
Traffic flow summaries
REST API calls made to the PCE
Events
Investigate Workload from Illumio Splunk App
When you are viewing a list of workloads, such as through the Port Scan or Firewall Tampering screens, you can click Investigate to view the Workload Investigation dashboard for the selected workload. See Workload Investigation Dashboard.
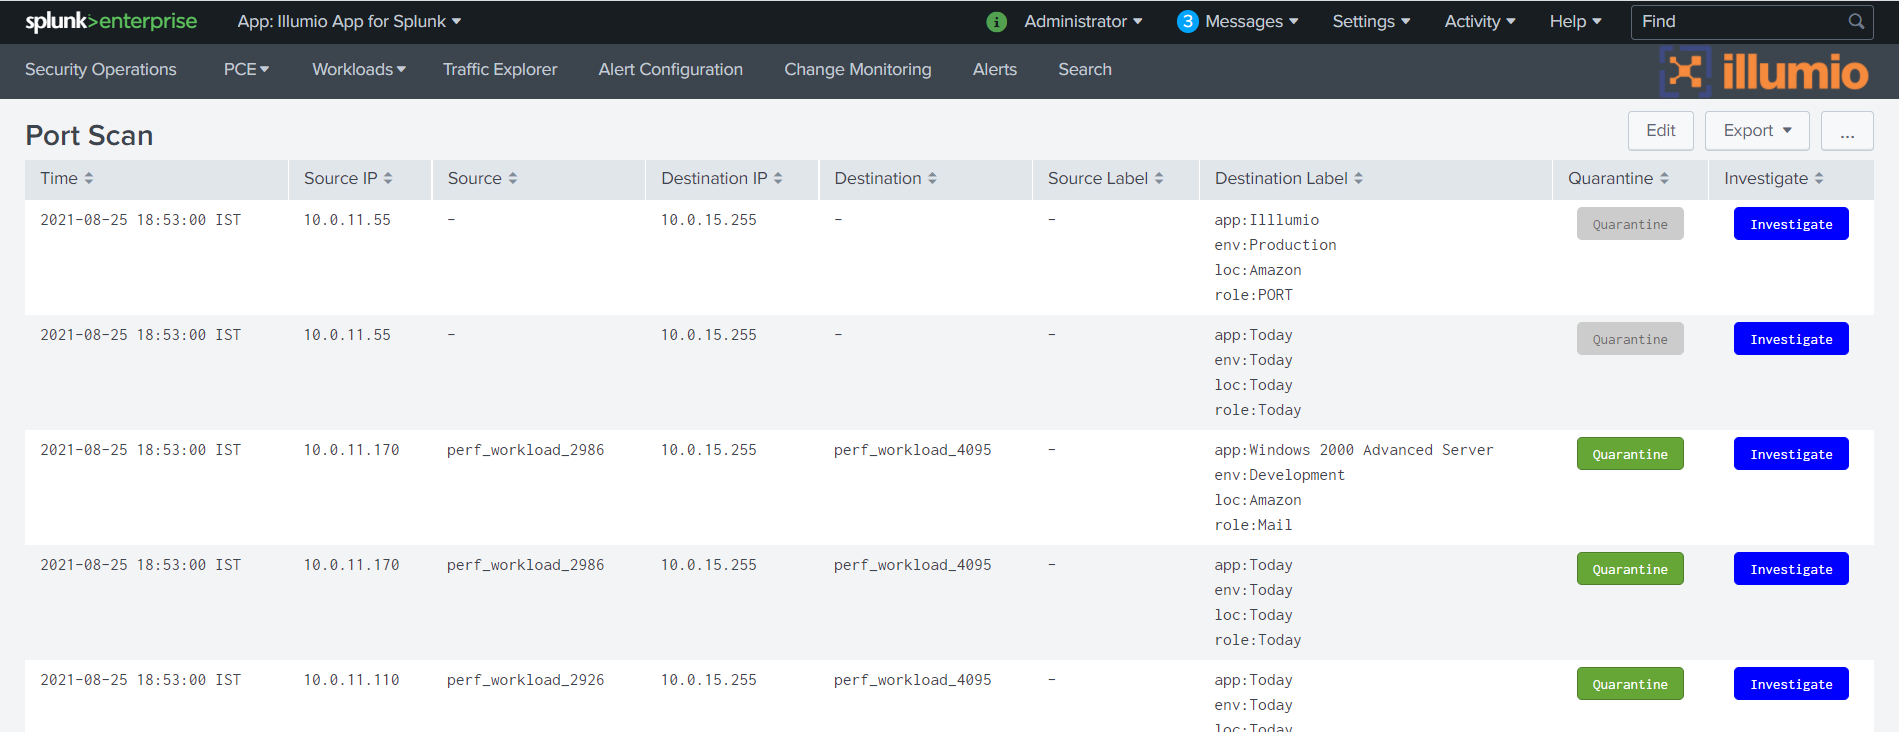
Depending on the results of the investigation, you might want to quarantine the workload. To quarantine a workload, click on the Security Operations dashboard and drill down on the panels.
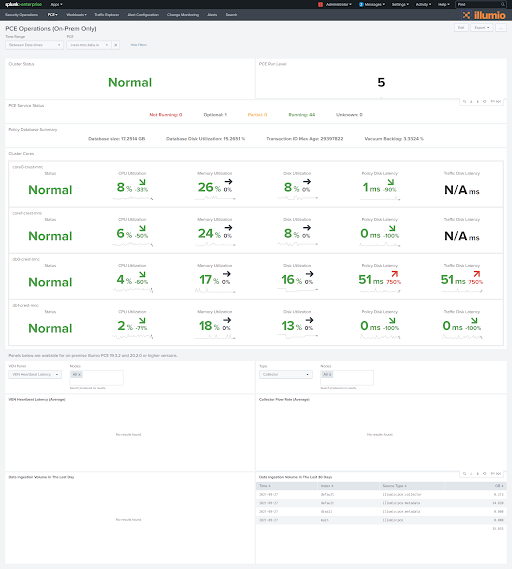
PCE Operations Dashboard
Note
The PCE Operations dashboard is only available for on-premises deployments.
The PCE Operations dashboard enables Splunk administrators to monitor the health of multiple on-premises PCE instances from one Splunk server. This includes the overall PCE cluster status, service status summary, per-node service status, CPU, Memory and Disk utilization metrics. If multiple PCE instances are connected to Splunk, you can use the drop-down list at the top of the dashboard to choose which PCE to monitor.
The PCE Operations dashboard is built using data from the following source:
REST API calls made to the PCE (PCE 17.2 and later)
 |
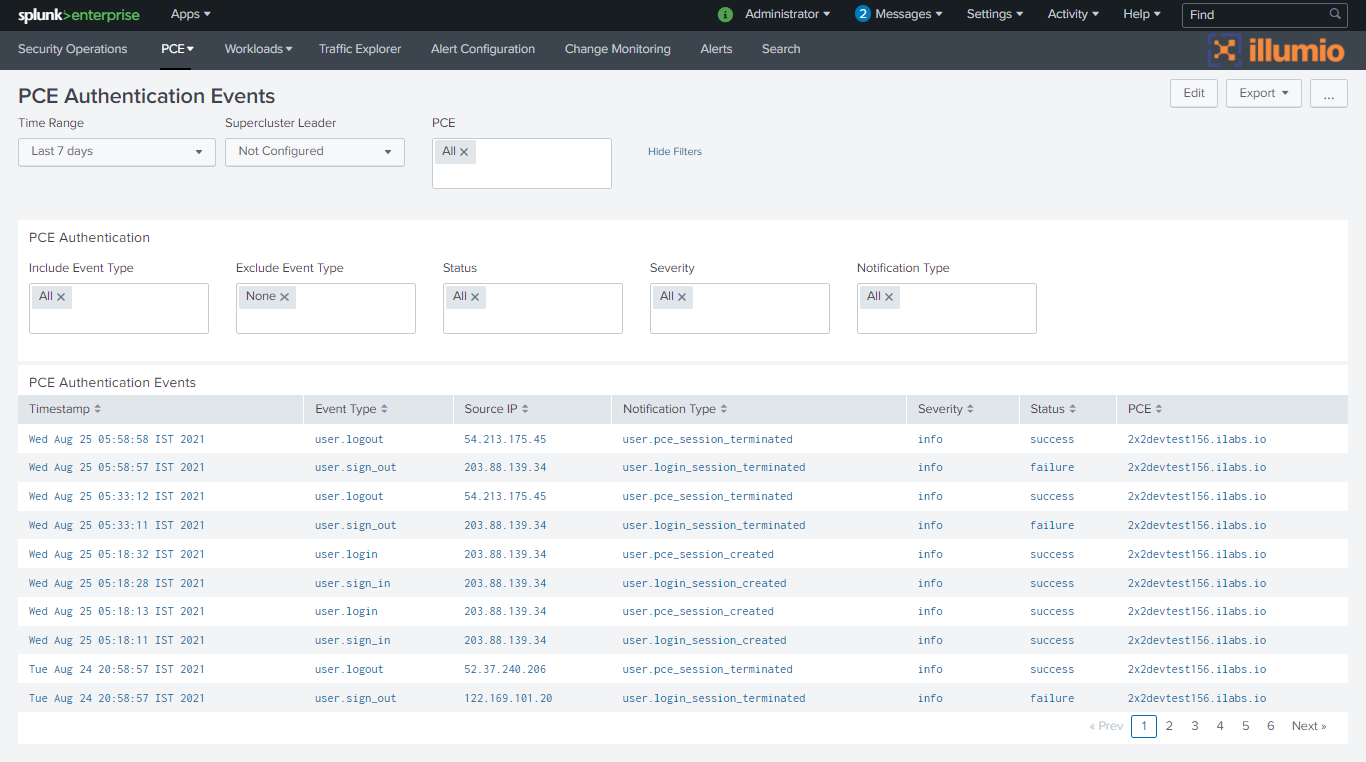
PCE Authentication Events Dashboard
The PCE Authentication Events dashboard enables you to search for and filter types of user authentication data.
 |
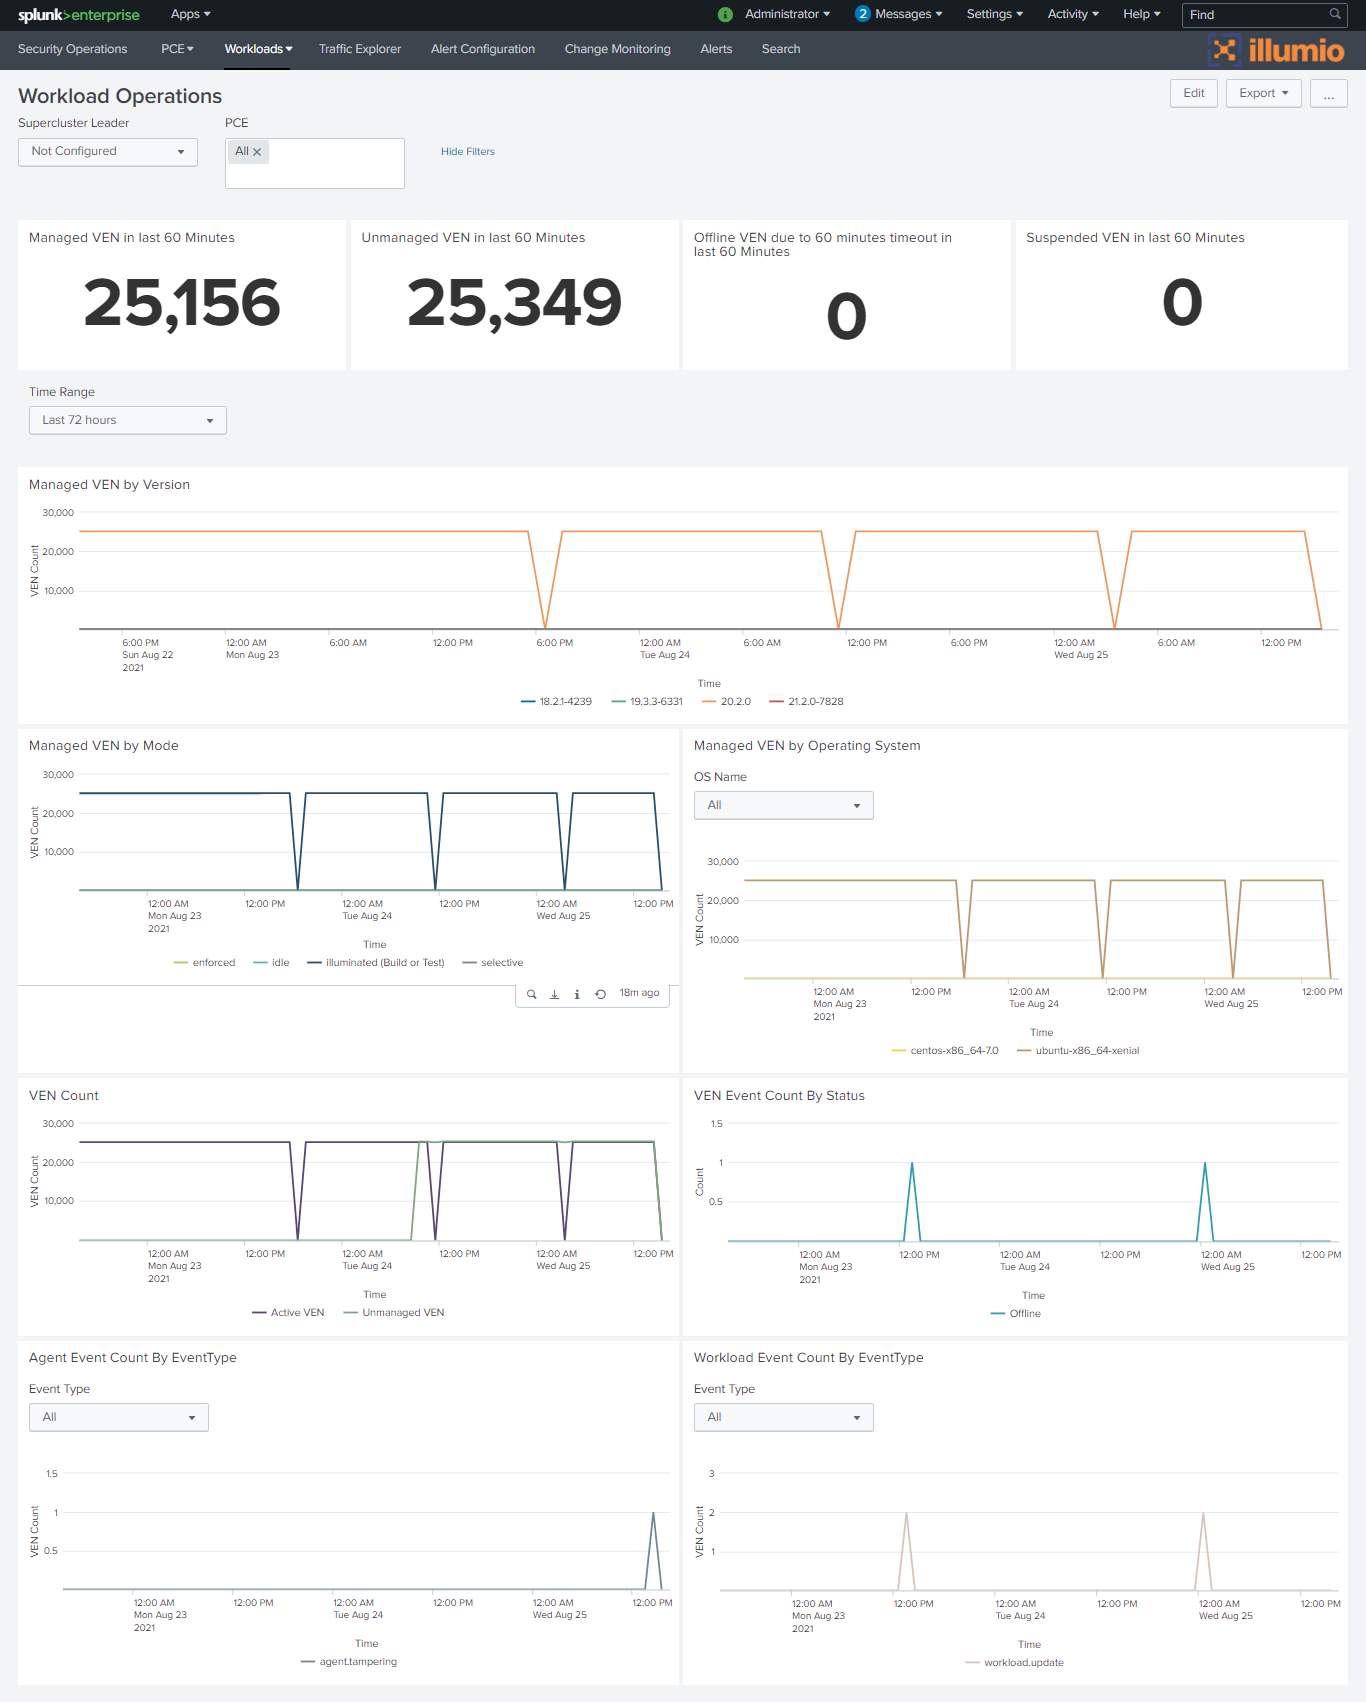
Workload Operations Dashboard
The Workload Operations dashboard enables you to monitor the Workloads managed by the PCE instances. The dashboard displays VEN deployment statistics and VEN-reported events. If multiple PCE instances are connected to Splunk, you can use the drop-down list at the top of the dashboard to choose which PCE to monitor.
The Workload Operations dashboard is built using data from the following sources:
REST API calls made to the PCE
Events
 |
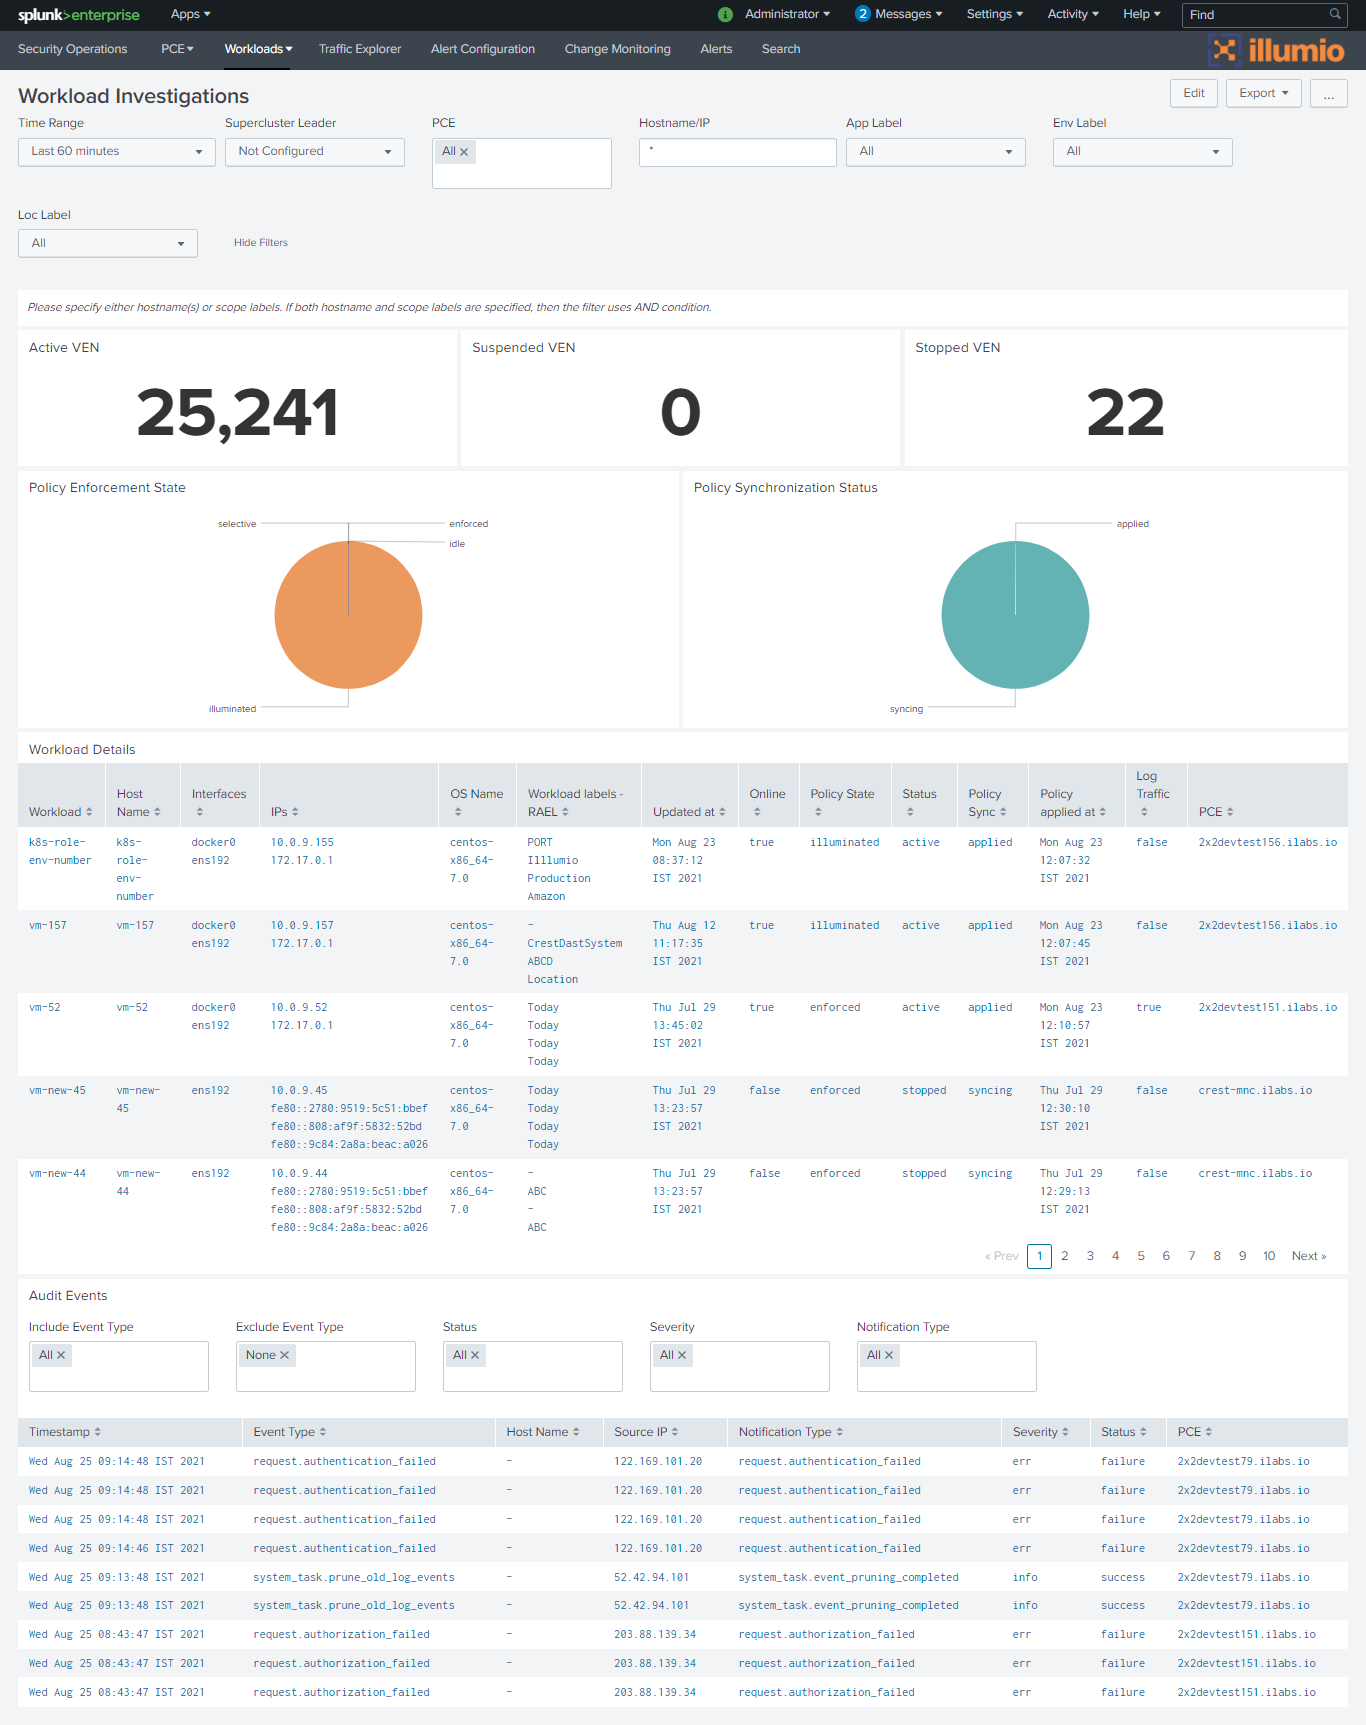
Workload Investigation Dashboard
The Workload Investigation dashboard enables you to search for detailed information about one or more workloads. If multiple PCE instances are connected to Splunk, you can use the drop-down list to choose which PCE to monitor. You can use the Time Range drop-down list to filter the display. You can use wildcards or IP addresses to select multiple workloads. Instead of using hostnames or IP addresses to select workloads, you can define a workload scope using the App Label, Env Label, and Loc Label drop-down lists.
The Workload Investigation dashboard has two panels:
Workload Details: Hostname, IP, Operating System, Status of policy, PCE
Audit Events: Events recorded for the workloads. You can click an event in the list to drill down for more details about the event.
 |
Traffic Explorer Dashboard
The Traffic Explorer dashboard helps you to visualize traffic data that is coming from syslog, and enables you to search for and filter traffic events.
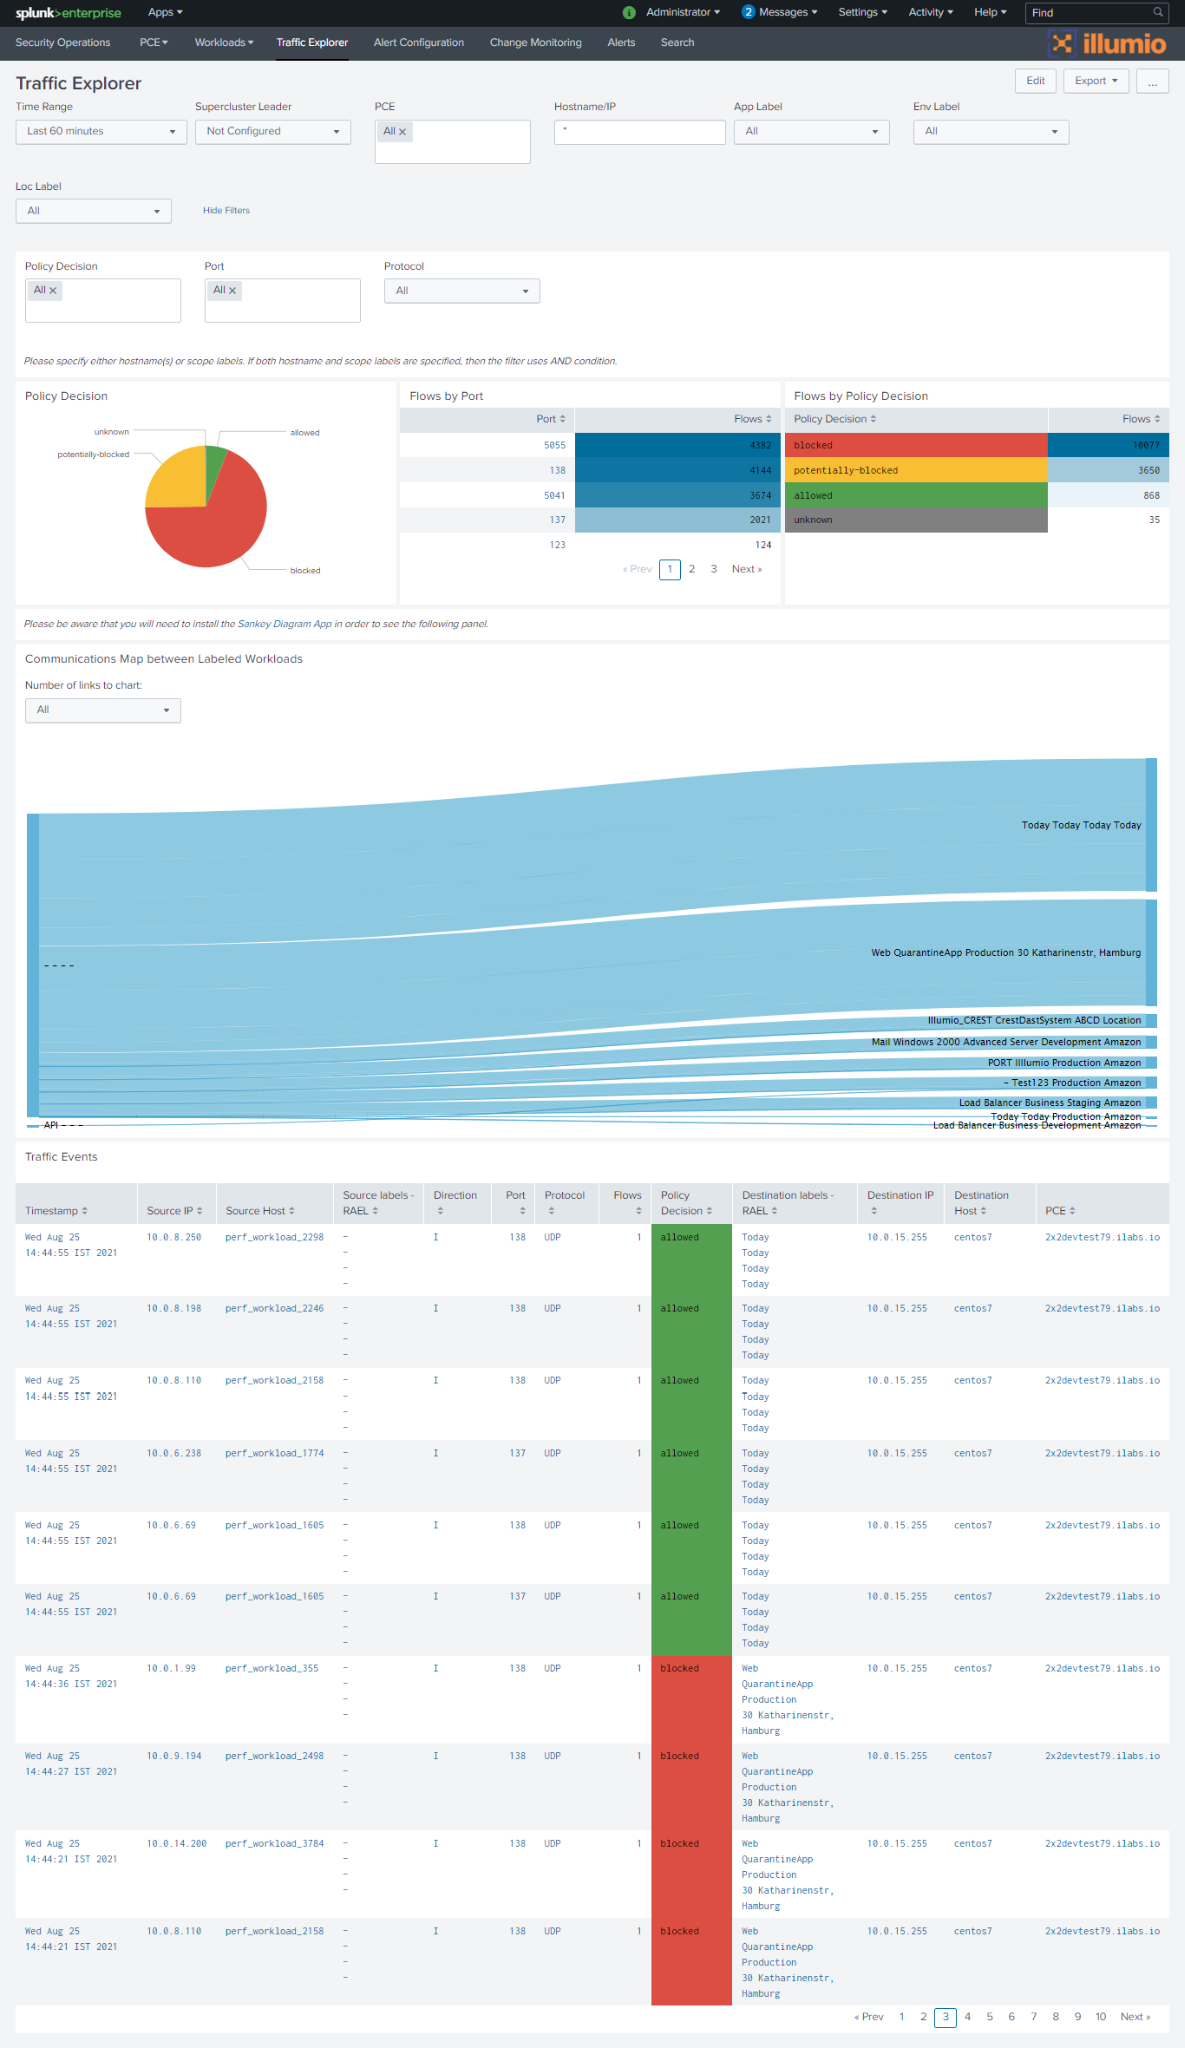 |
Note
The Traffic Explorer dashboard uses the Splunk Sankey Diagram app for visualization. You must install this app to use this dashboard.
Alert Configuration Page
See Configuring Alerts in the Configuration section later in this document.
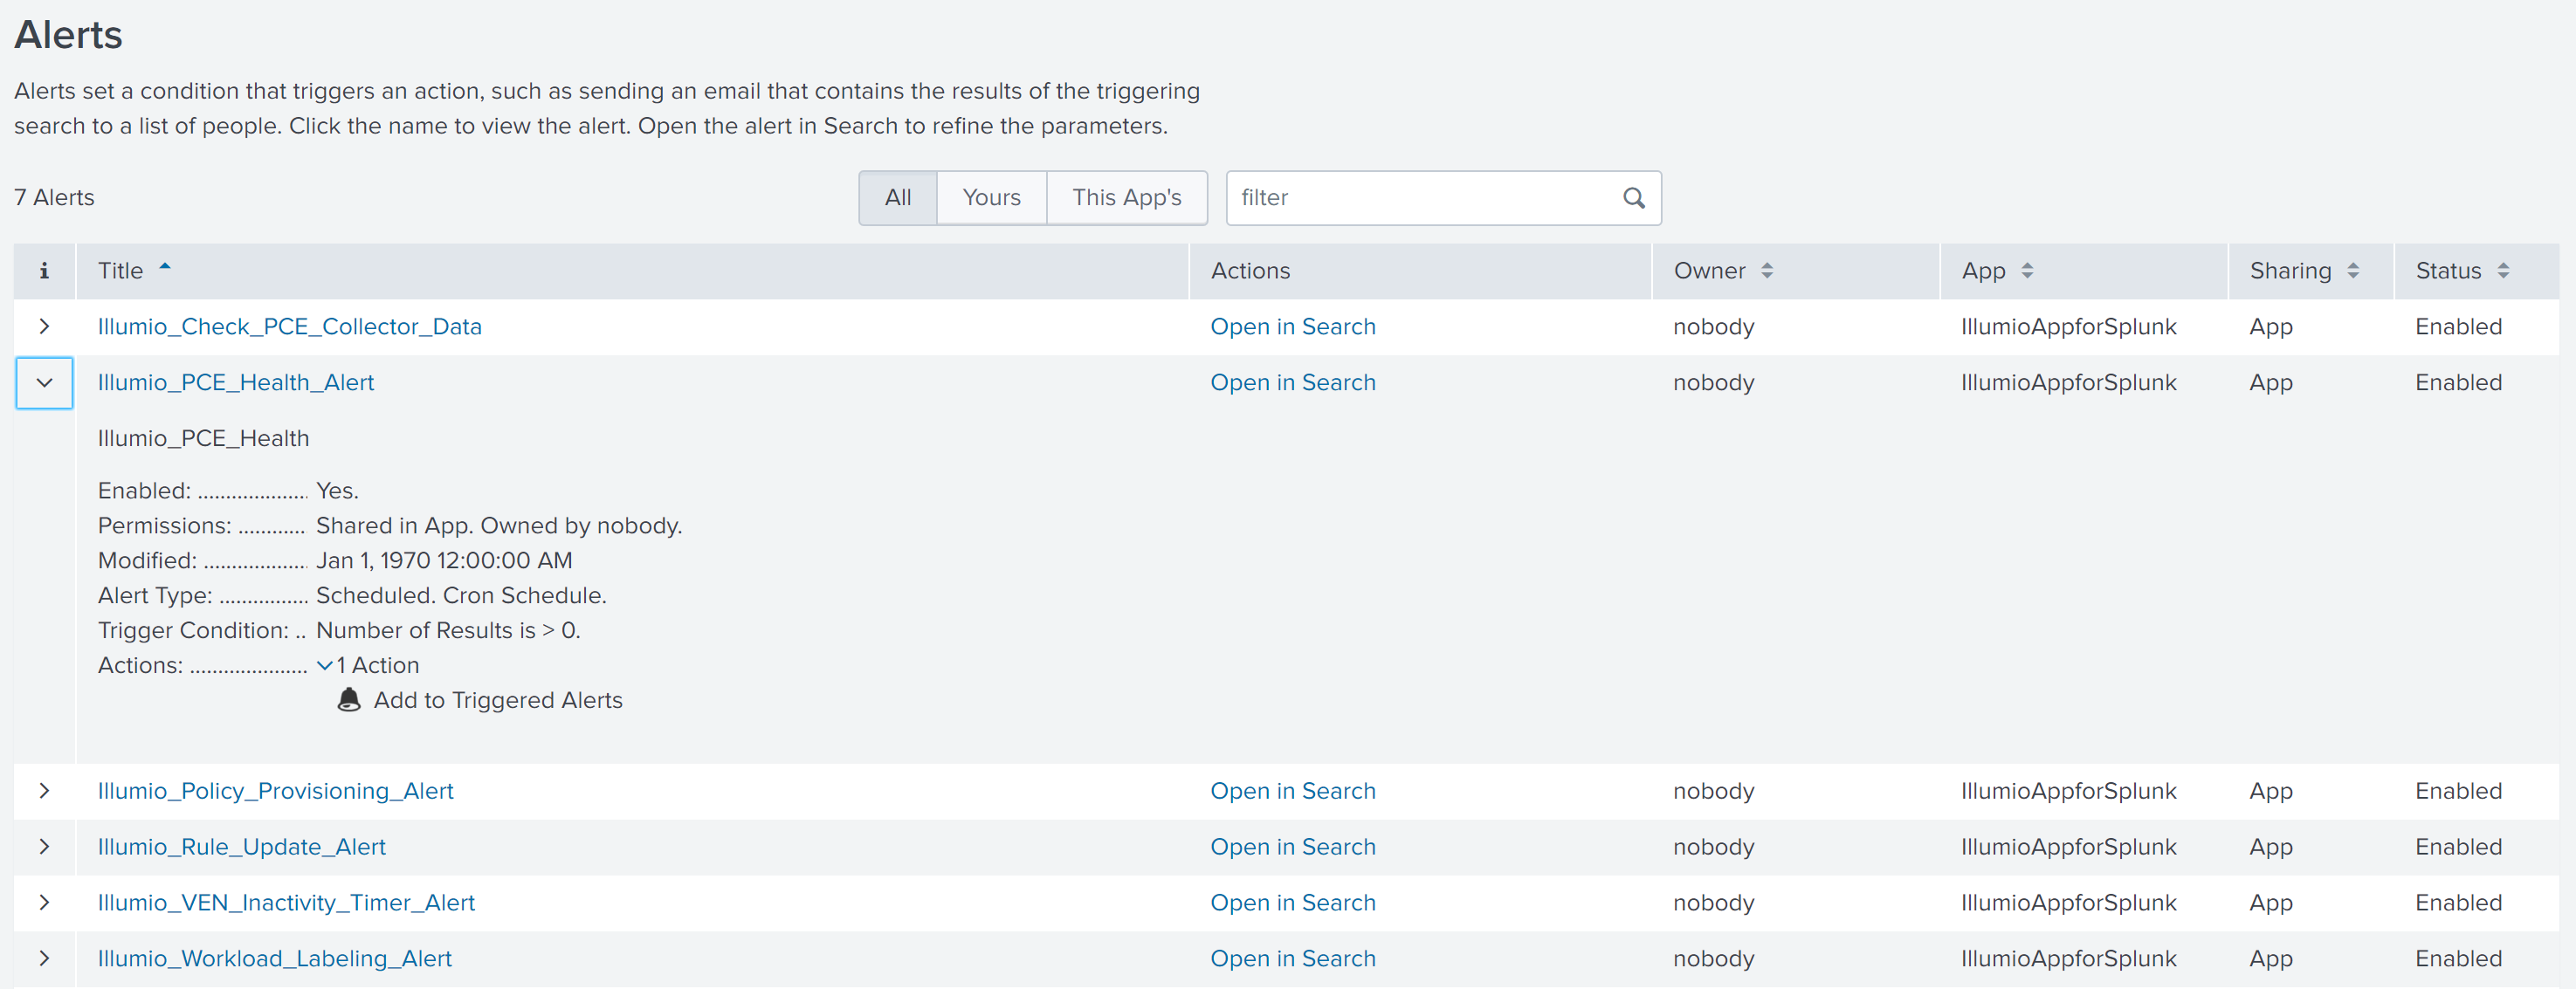
Alerts Page
Click the Alerts link to view the Splunk Alerts page. On this page, you can view all alerts for the Illumio for Splunk app. This page contains links, such as Edit and Open in Search. Use the Edit link to set up email notifications for alerts. See the Splunk documentation for more information about this page.
 |
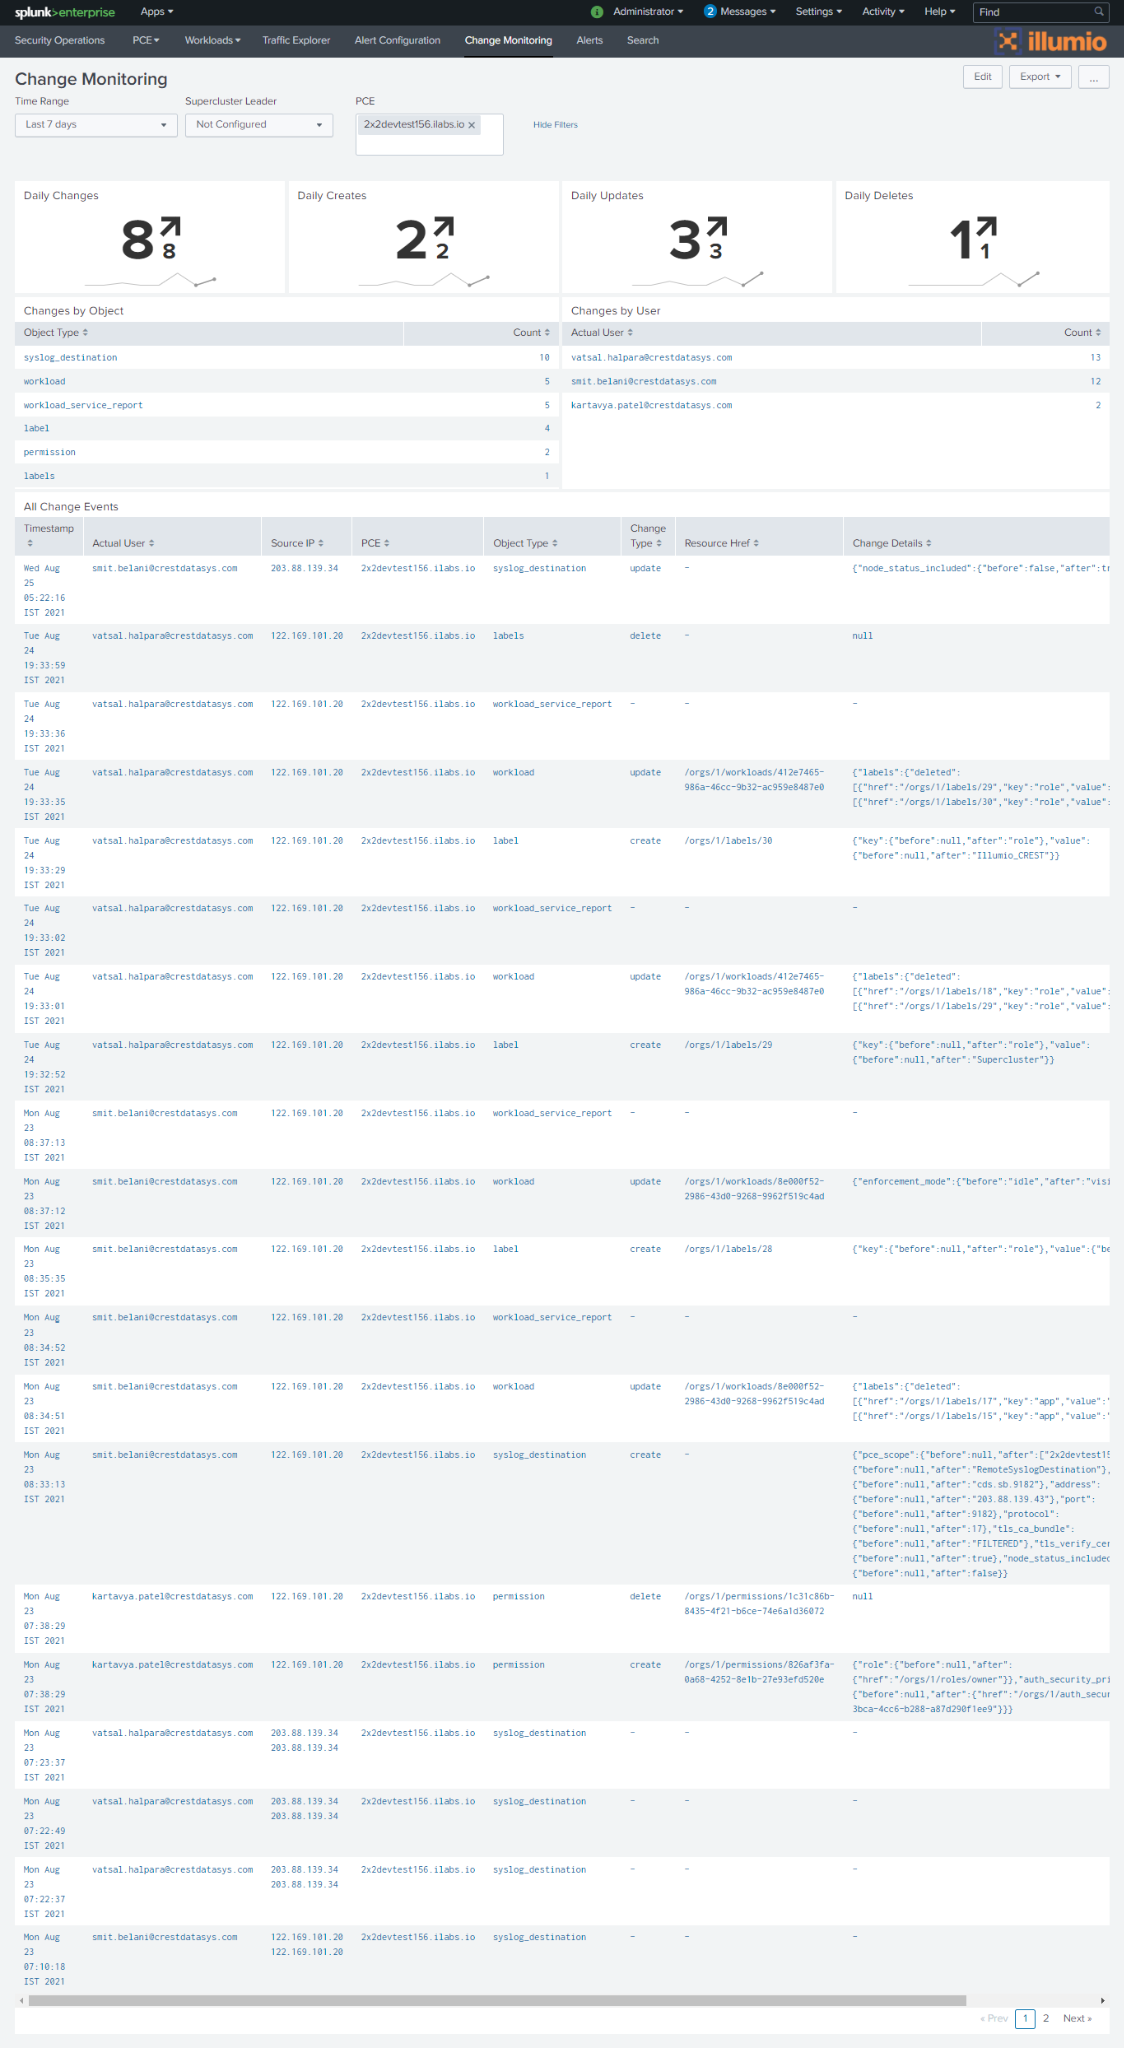
Change Monitoring Dashboard
The Change Monitoring dashboard helps Splunk administrators search for detailed level information about changes performed by users.