Illumio App and Technology Add-On for Splunk 4.x
This guide describes how to install and configure Illumio App for Splunk and the Illumio Technology Add-On for Splunk 4.x.
About the Illumio and Splunk Integration
The Illumio - Splunk integration contains two parts:
The Illumio Technology Add-On, or TA, which performs metadata collection and event parsing.
The Illumio App for Splunk, which provides dashboards and reports to display important data from the Illumio PCE.
Install the TA to each tier of a distributed Splunk deployment, but install the app only on the search head or search head cluster:
Component | Forwarder | Indexer | Search Head |
|---|---|---|---|
Illumio Technology Add-On for Splunk | Yes (Heavy Forwarder only) - data collection and modular input | Yes - index-time filtering and transforms | Yes - search-time field extractions and transforms |
Illumio App for Splunk | No | No | Yes |
Specific recommendations for the configuration and topology of a distributed Splunk environment are outside the scope of this document. See the documentation on Splunk Validated Architectures for suggestions on topology for distributed deployments.
Supported Splunk Versions
V4.0.3: Splunk 9.3, 9.2, 9.1, 9.0, 8.2, 8.1 + PCE 21.5, 22.2, 22.5, 23.2, 23.5, 24.2.x, and SaaS
v4.0.2: Splunk 9.3, 9.2, 9.1, 9.0, 8.2, 8.1 + PCE 21.5, 22.2, 22.5, 23.2, 23.5, and SaaS
v4.0.1: Splunk 9.1, 9.0, 8.2, 8.1 + PCE 21.5, 22.2, 22.5, 23.2, and SaaS
Important
Version 4.0.2 consists of TA-Illumio version 4.0.2 and Illumio App for Splunk version 4.0.1.
Splunk Common Information Model (CIM) versions 4.x and 5.x are supported.
About Illumio Event Data Collection
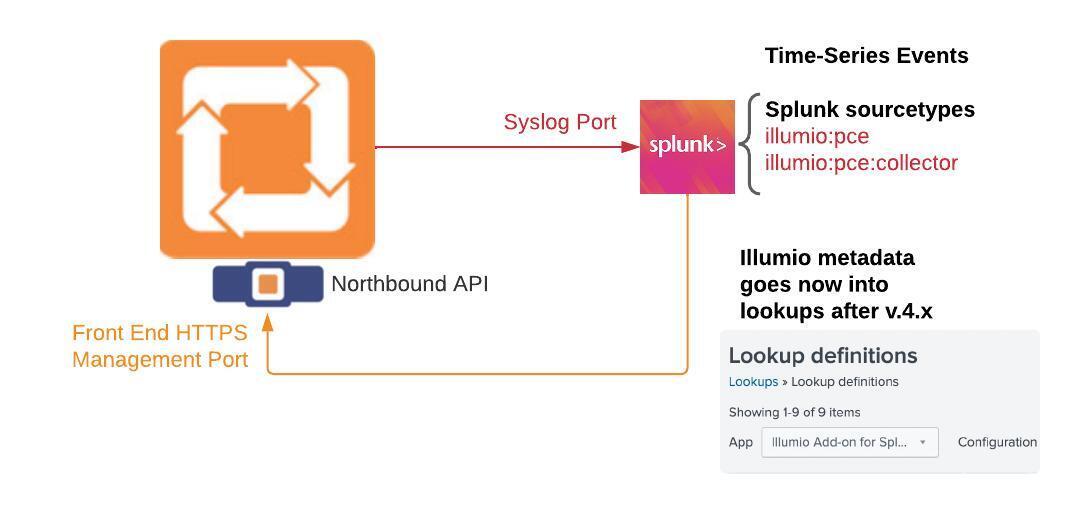
The following diagram describes how Illumio event data is collected for On-Premises deployments:
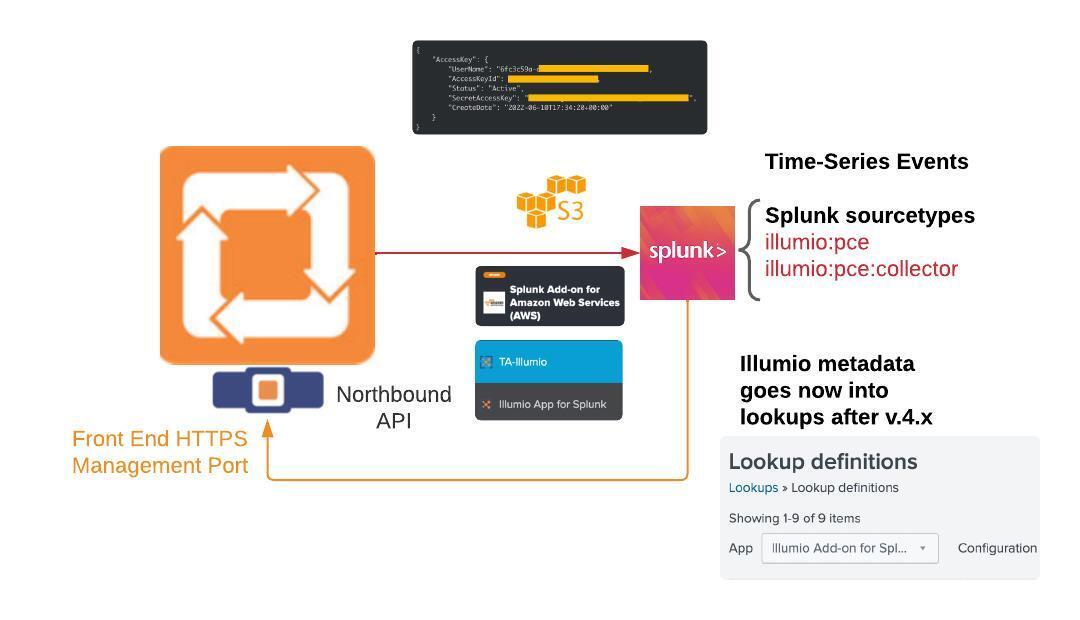
The following diagram describes how Illumio event data is collected for Cloud deployments:
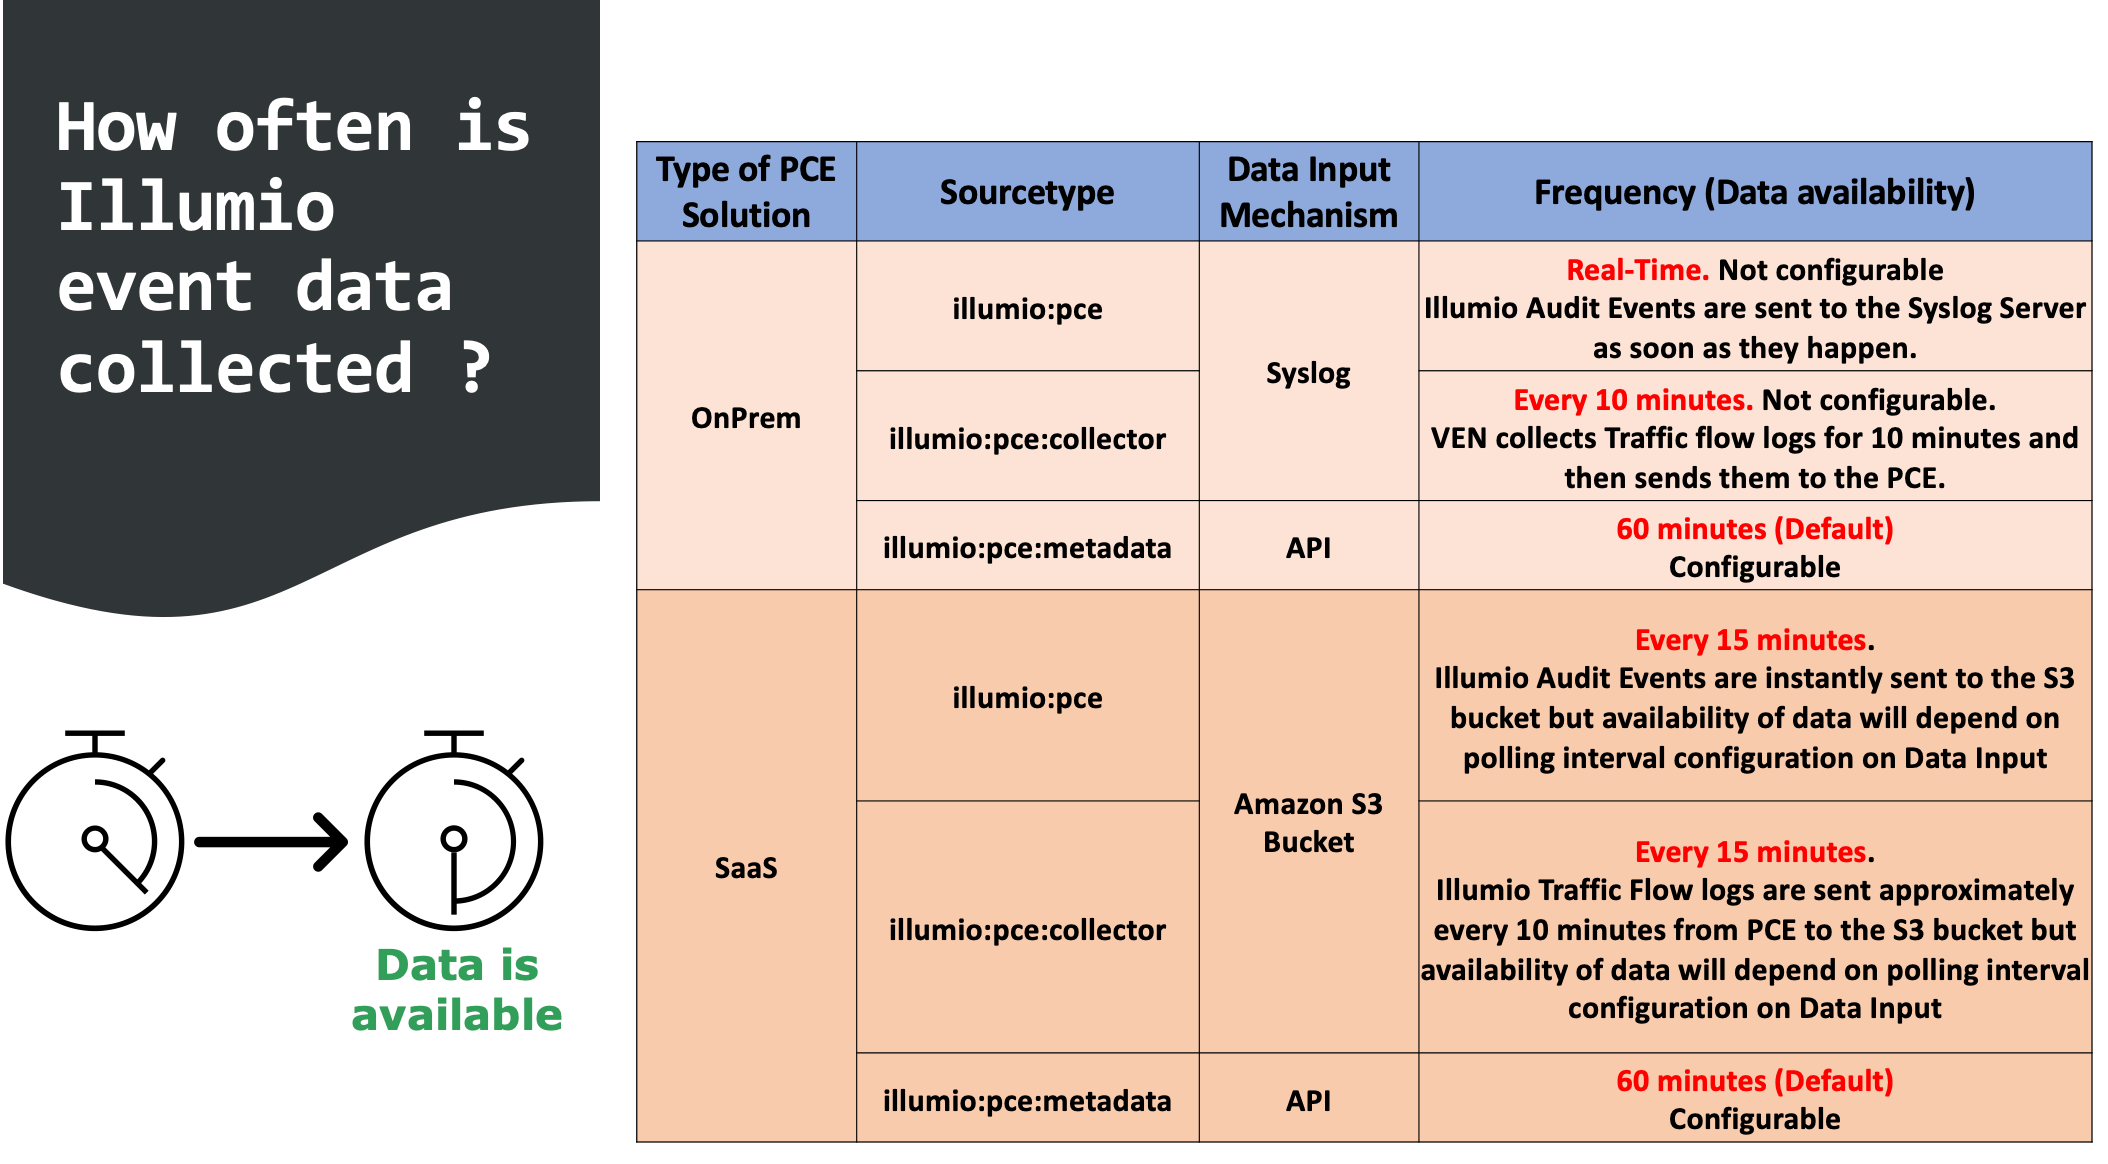
The following diagram describes how often Illumio event data is collected and is then available for search:
About the Illumio Technology Add-On for Splunk
The Illumio Technology Add-On for Splunk (TA) pulls data into Splunk and performs data normalization and enrichment. Illumio event fields are aliased and transformed to be compatible with the Common Information Model (CIM) and used with other Splunk products and add-ons.
The Illumio TA defines a custom Illumio modular input that can be configured on a standalone Splunk instance or Heavy Forwarder to retrieve data from the PCE. See Configure the Illumio Technology Add-On for Splunk.
The TA receives data from the Illumio Policy Compute Engine (PCE) in two forms:
Metadata pulled by the Illumio modular input from the PCE REST APIs
The Illumio modular input pulls Illumio object metadata and status information from the PCE over HTTPS. The input calls the following endpoints:
/api/v2/health
/api/v2/orgs/<org_id>/workload_settings (used to verify the org ID when validating the PCE connection configuration)
/api/v2/orgs/<org_id>/labels
/api/v2/orgs/<org_id>/workloads
/api/v2/orgs/<org_id>/sec_policy/active/ip_lists
/api/v2/orgs/<org_id>/sec_policy/active/services
/api/v2/orgs/<org_id>/sec_policy/active/rule_sets
Syslog events forwarded directly from the PCE (on-prem) or pulled using a third-party add-on as described in the document (SaaS)
Sourcetypes
The Illumio modular input writes to a user-configured Splunk index and predefined sourcetypes:
Sourcetype | Description |
|---|---|
illumio:pce | Contains PCE auditable events written to Syslog. |
illumio:pce:health | Contains PCE system health events. |
illumio:pce:collector | Contains PCE network traffic flow events. |
Distributed Splunk Architecture
Install the Illumio Technology Add-On for Splunk on each tier of a distributed Splunk installation. For more information, see Where to install add-ons.
Heavy Forwarder: Configure Illumio modular input instances and TCP receivers to retrieve PCE data and forward it to the indexer/indexer cluster.
Indexer: Install on the indexer/indexer cluster to perform index-time filtering and transformations, including stripping the Syslog prefix for JSON-formatted events.
Search head: Install on the search head/search head cluster to perform search-time transformations, such as lookups, field extractions, and field aliasing.
Field Extractions
The custom Illumio sourcetypes define field extractions to enhance event data at search time. Extractions and aliases modify field names and values for CIM compatibility as shown in the following table:
Sourcetype | CIM Data Model | Tags | CIM Field | Illumio Field |
|---|---|---|---|---|
illumio:pce | Authentication | authentication | action | "success" or "failure" |
app | "illumio_pce" | |||
src | action.src_ip | |||
user | resource.user.username OR notifications.info.*user.username | |||
src_user | created_by.user.username | |||
All Change | change | change_type | same as object_category | |
dest | pce_fqdn | |||
dest_host | pce_fqdn | |||
object | object name or value | |||
object_category | object type (such as workload or rule_set) | |||
object_id | object HREF | |||
src | action.src_ip | |||
status | status | |||
user | created_by.user.username | |||
user_name | alias for user | |||
vendor_product | "illumio:pce" | |||
src_user | created_by.user.username | |||
Network Changes | change network | action | "modified" | |
Auditing Changes | change audit | action | "created", "updated", or "deleted" | |
Account Management | change account | action | "created", "updated", "deleted", or "modified" | |
user | resource.user.username OR notifications.info.*user.username | |||
illumio:pce:collector | Network Traffic | network communicate | action | "allowed", "potentially-blocked", "blocked", or "unknown" |
app | "illumio_pce" | |||
bytes | tbi + tbo | |||
bytes_in | tbi | |||
bytes_out | tbo | |||
dest | dst_ip | |||
dest_ip | dst_ip | |||
dest_host | dst_hostname | |||
dest_port | dst_port | |||
direction | "inbound", "outbound", or "unknown" | |||
dvc | pce_fqdn | |||
protocol_version | version | |||
src | src_ip | |||
src_ip | src_ip | |||
src_host | src_hostname | |||
transport | proto | |||
user | un | |||
vendor_product | "illumio:pce" |
Workload Quarantine Action
The Illumio Technology Add-On for Splunk provides a scripted alert action to move a workload into a configured quarantine zone. You must first define the policy and labels for the quarantine zone on the PCE.
This action takes the following parameters:
workload_href: The PCE workload HREF of the workload to move into quarantine.
pce_fqdn: The fully qualified domain name of the PCE
org_id: The PCE organization ID. (Defaults to 1)
When triggered, the alert action script looks up the modular input matching the given pce_fqdn and org_id and uses the configured PCE connection details when updating the specified workload.
Note
For the action to run successfully, the API key configured for the input must have write permissions for the workloads.
Manually Trigger Quarantine
Run the following search from the Splunk UI to quarantine a workload with a specified HREF:
| makeresults 1 | sendalert illumio_quarantine param.workload_href="/orgs/1/workloads
/00f13a7b-0386-4943-a96c-cfd71d4096dd" param.pce_fqdn="my.pce.com" param.org_id=1
About the Illumio App for Splunk
The Illumio App for Splunk integrates with the Illumio Policy Compute Engine (PCE) to provide security and operational insights into your Illumio secured data center. A dashboard view displays an overview of the security posture of the data center.
With improved visibility of east-west traffic, Security Operations Center (SOC) staff can detect unauthorized activity and potential attacks from traffic blocked by Illumio segmentation policy on workloads in "Enforcement" mode. Additionally, the Illumio App for Splunk provides visibility into potentially blocked traffic for workloads in "Test" mode. SOC staff can quickly pinpoint potential attacks and identify workloads with a significant number of blocked flows.
Distributed Splunk Architecture
You only need to install the app on the search tier of a distributed Splunk installation.
Dashboards
The Illumio App for Splunk provides multiple dashboards to display important data from the Illumio PCE.
Security Operations Dashboard
The Security Operations dashboard provides an overview of the PCE security posture, allowing Splunk admins to monitor the state of the network at a glance.
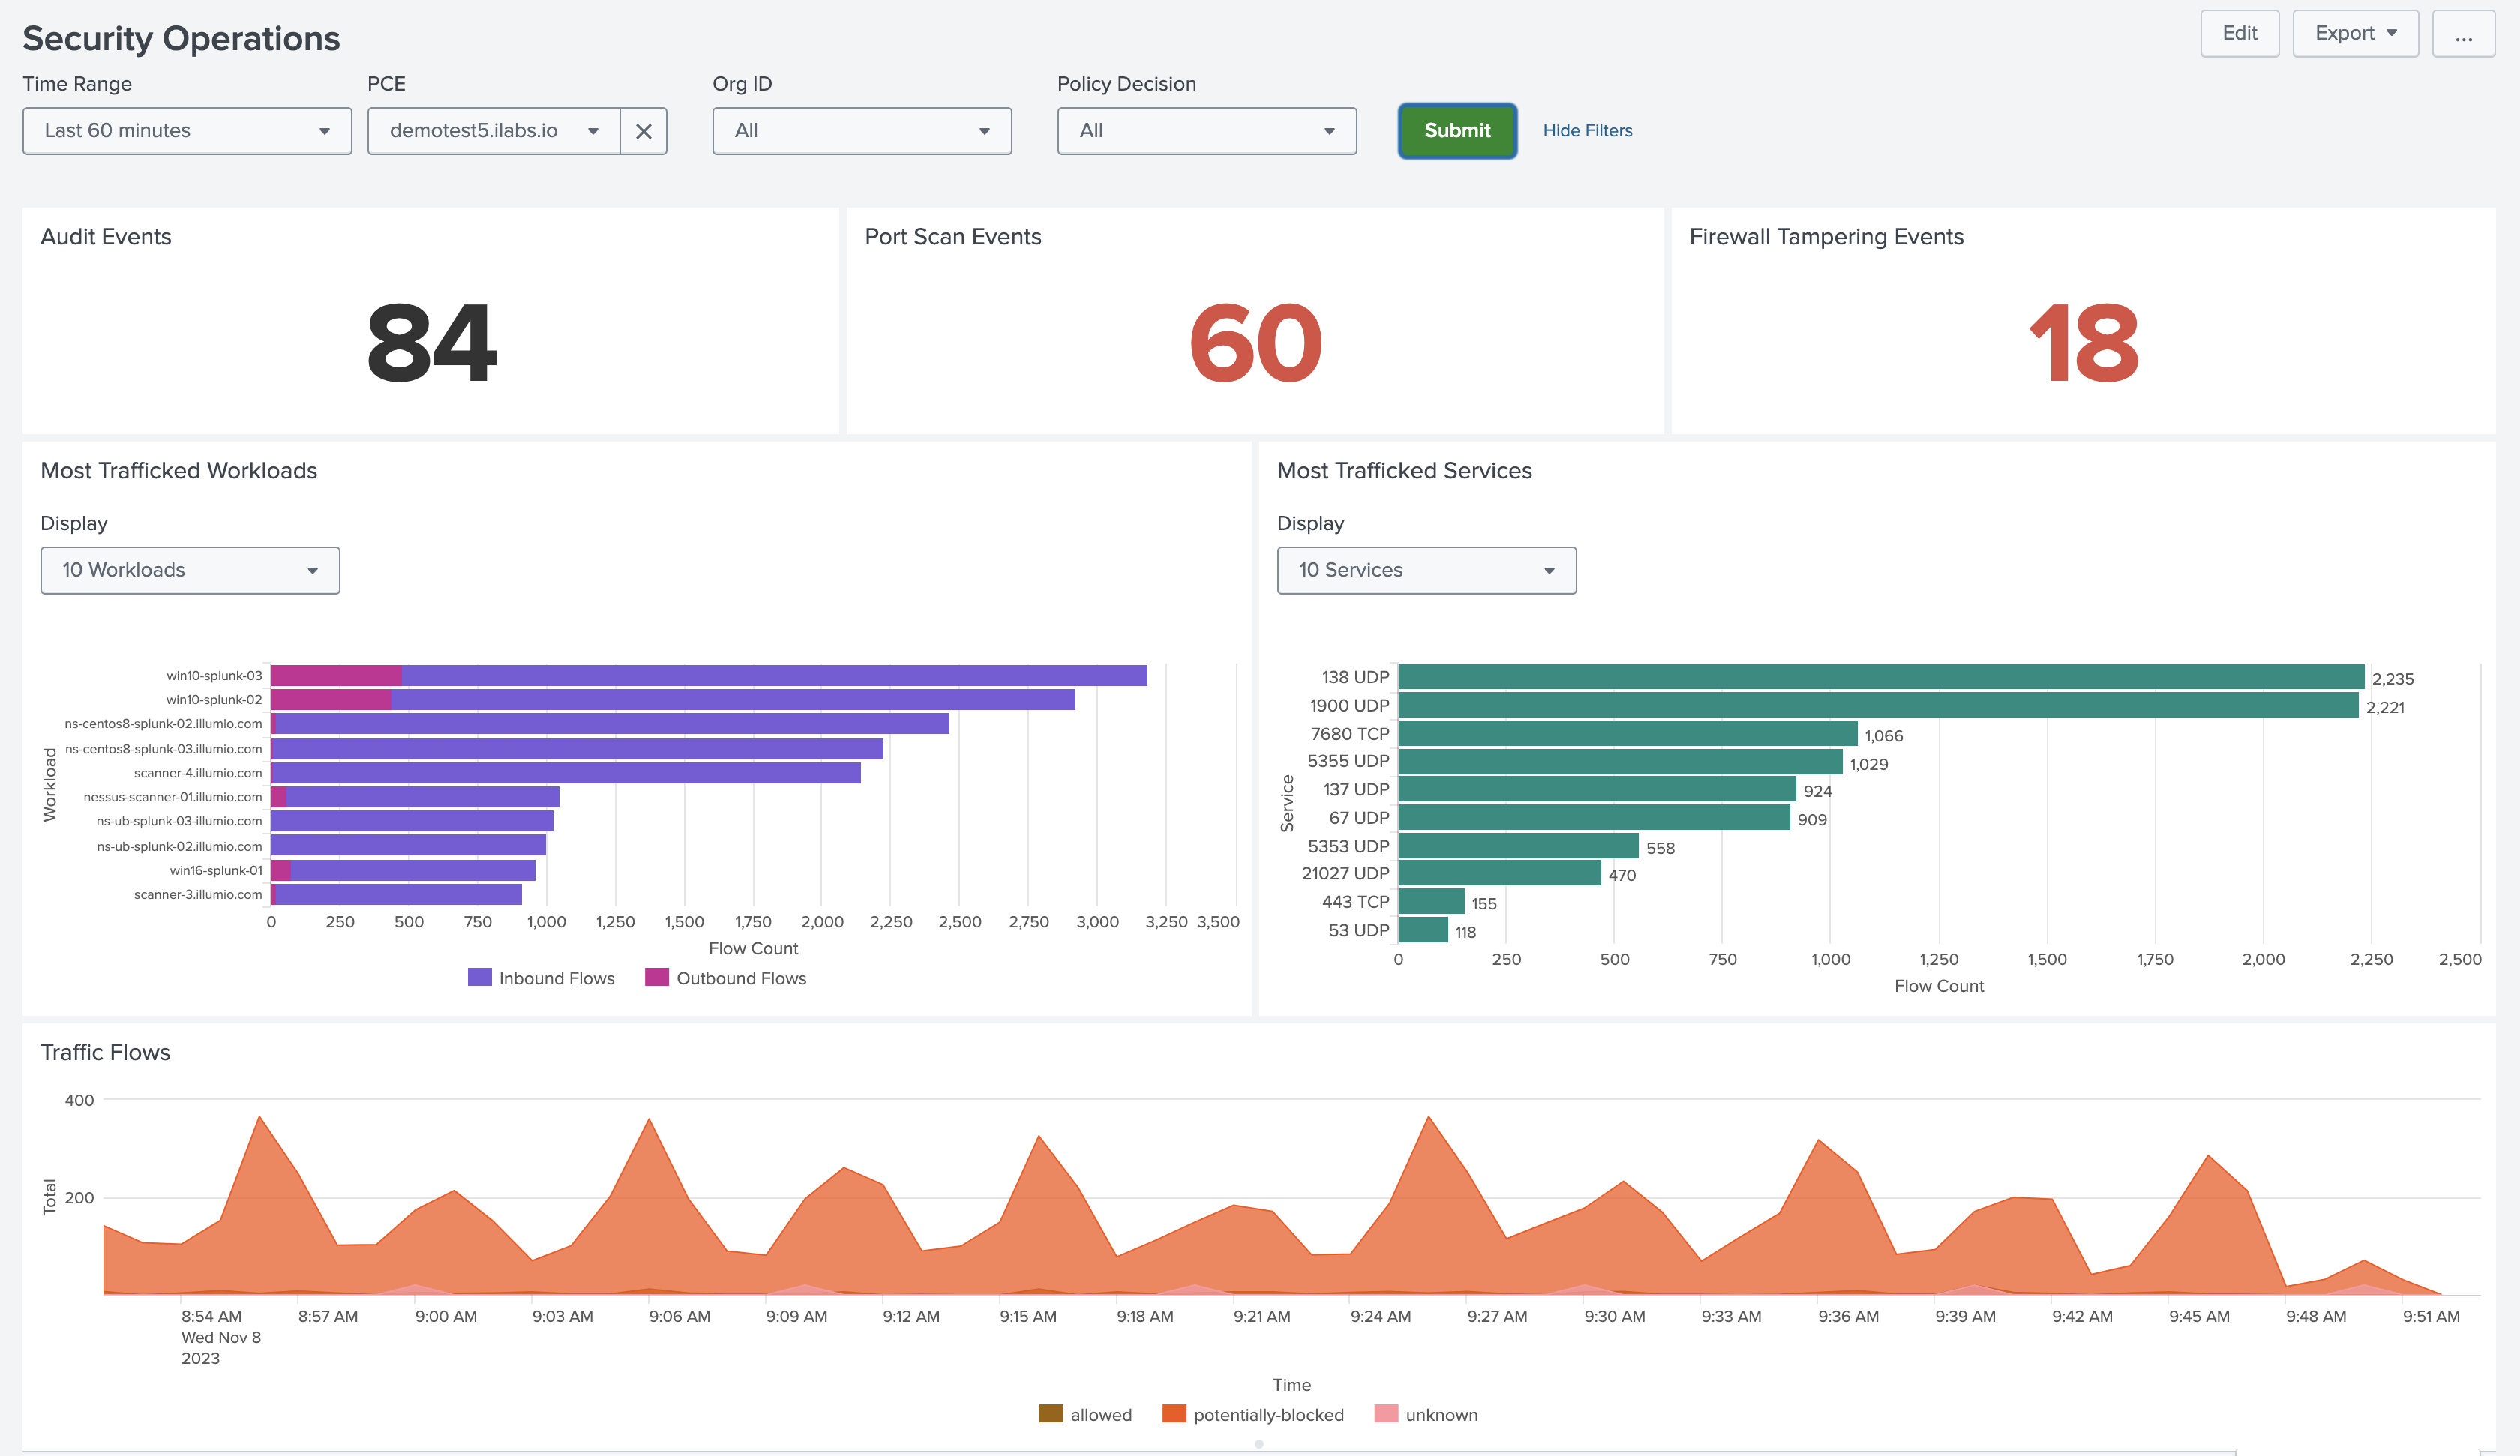
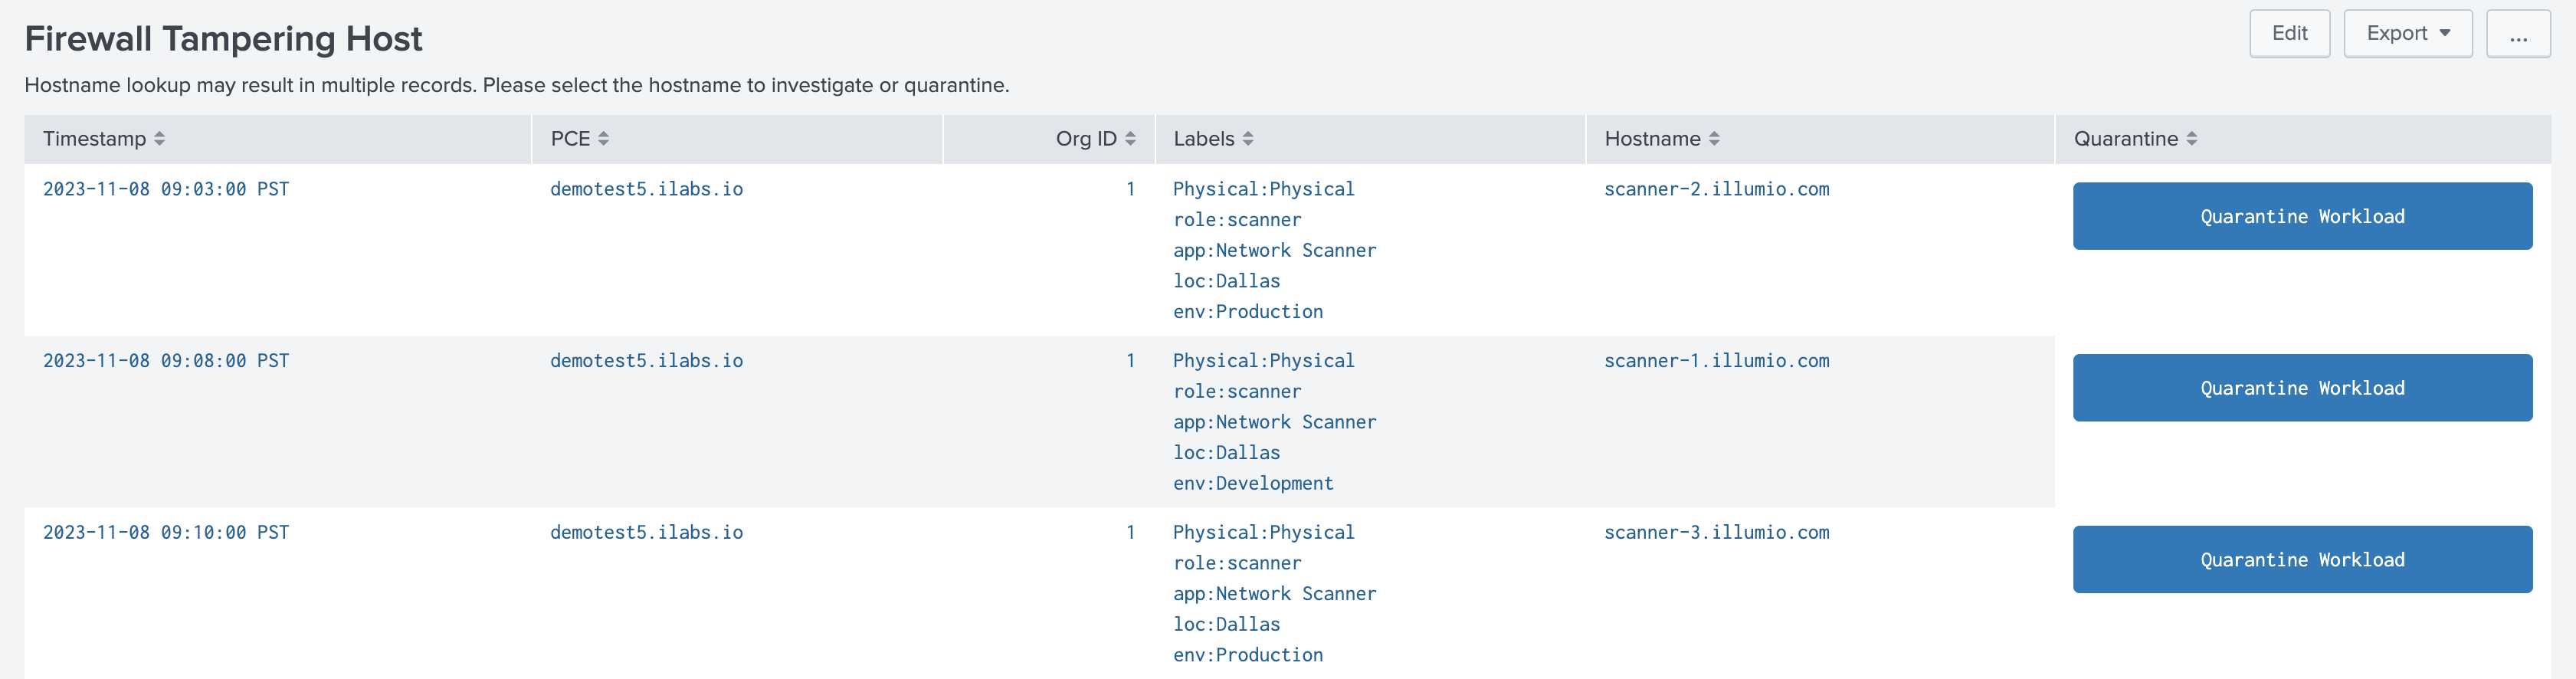
The Port Scan Events and Firewall Tampering Events panels drill down into detailed views of potentially compromised workloads. From these views, you can investigate the triggering events and quarantine the devices using the Illumio Quarantine alert action.
Note
Only users with the Illumio_quarantine_workload role can trigger the quarantine action. Also, note that when the Illumio Quarantine action is performed, the workload will lose all labels and the action will apply the labels that were originally configured on the Illumio Data Input. Th past labels are overwritten to avoid triggering policy rules and to maintain the Quarantine action.
PCE Operations Dashboard
Note
The PCE Operations dashboard is only available for On-Premises deployments.
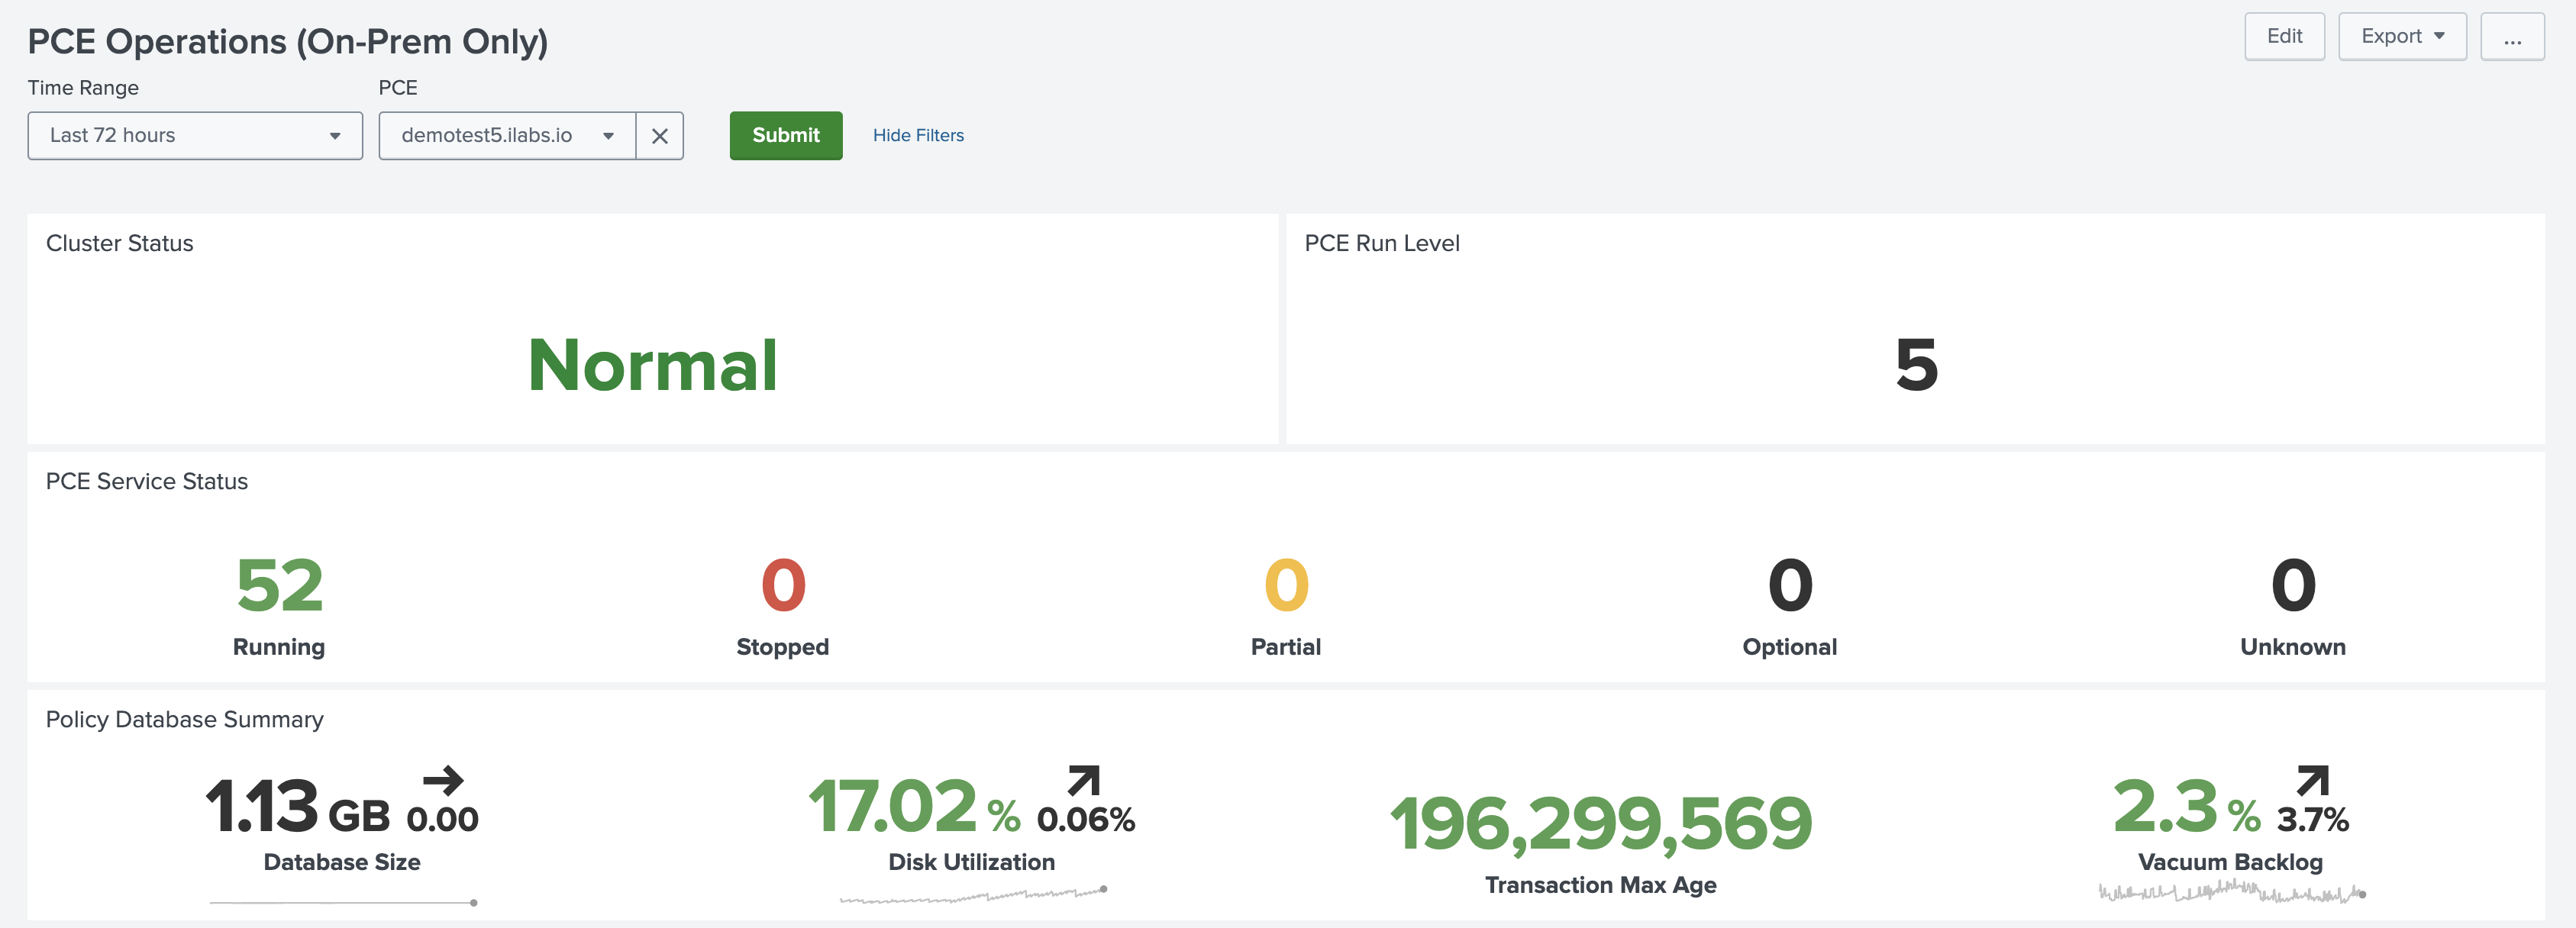
The PCE Operations dashboard shows the status of the PCE cluster. The top panels provide an overview of the whole cluster state, including the Unix run level, service statuses, and policy database metrics.
See the PCE Administration Guide for your version of the Illumio PCE for detailed explanations of these metrics.
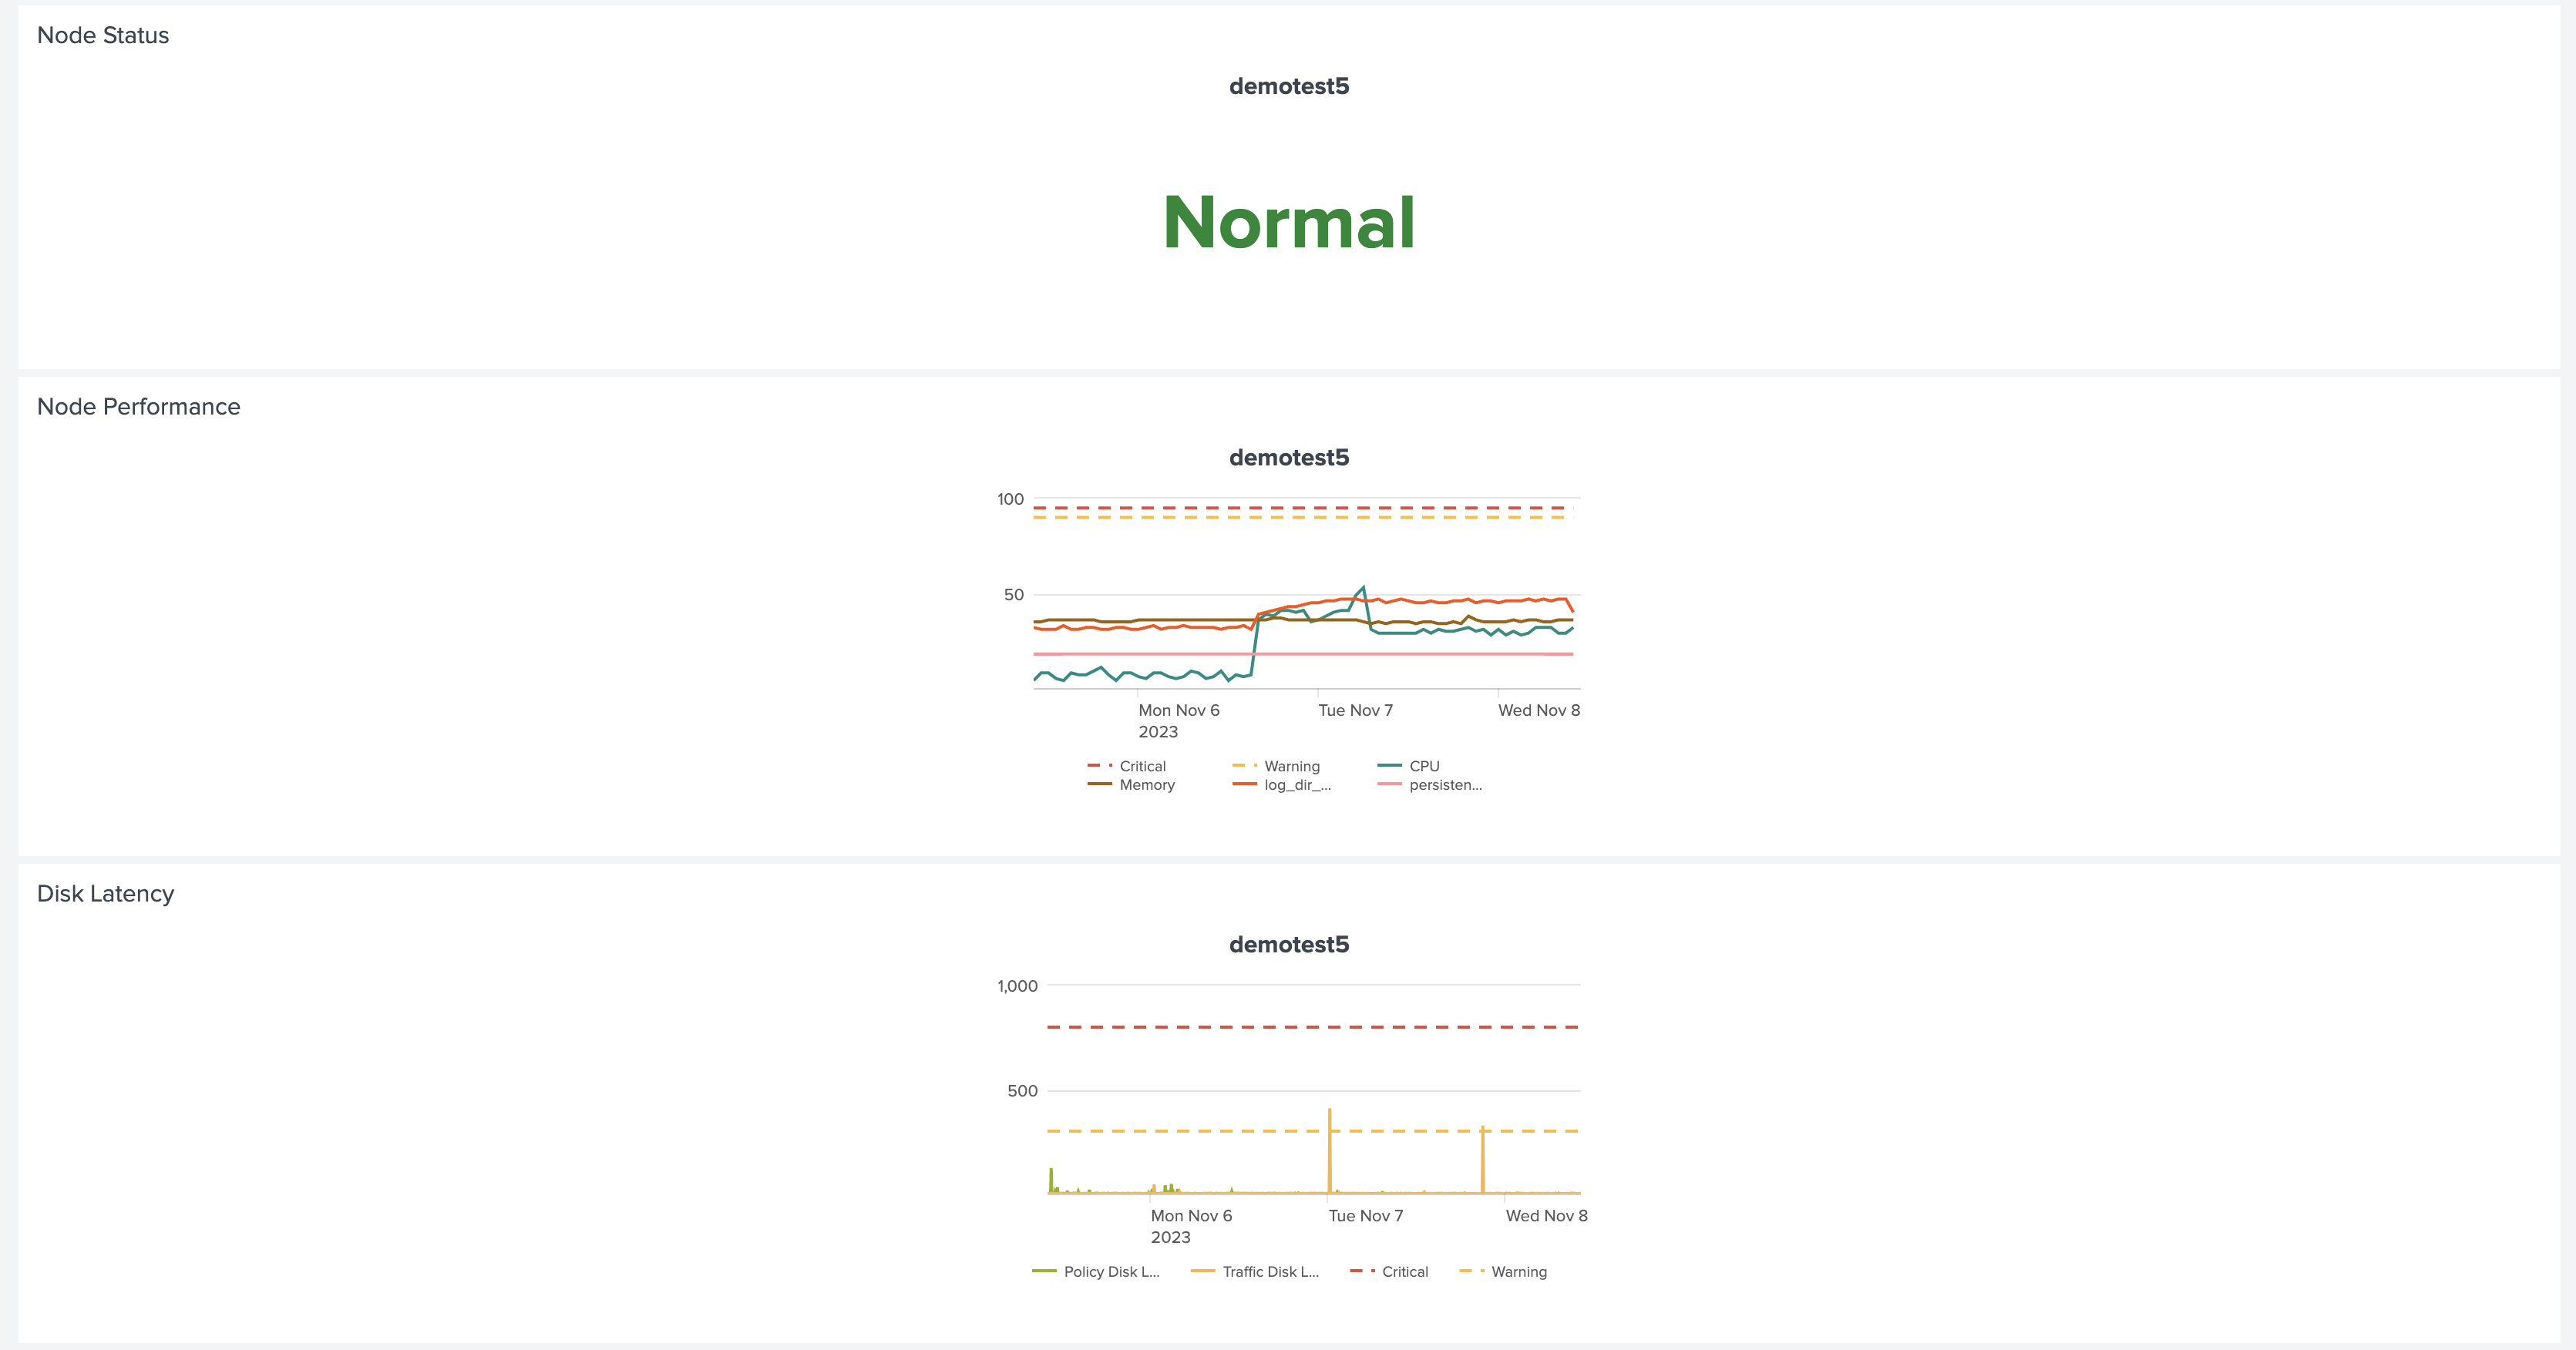
The Node Status, Node Performance, and Disk Latency panels show trellis charts for each host in the PCE cluster. The dashed yellow and red lines indicate warning and critical thresholds for the tracked metrics, respectively.
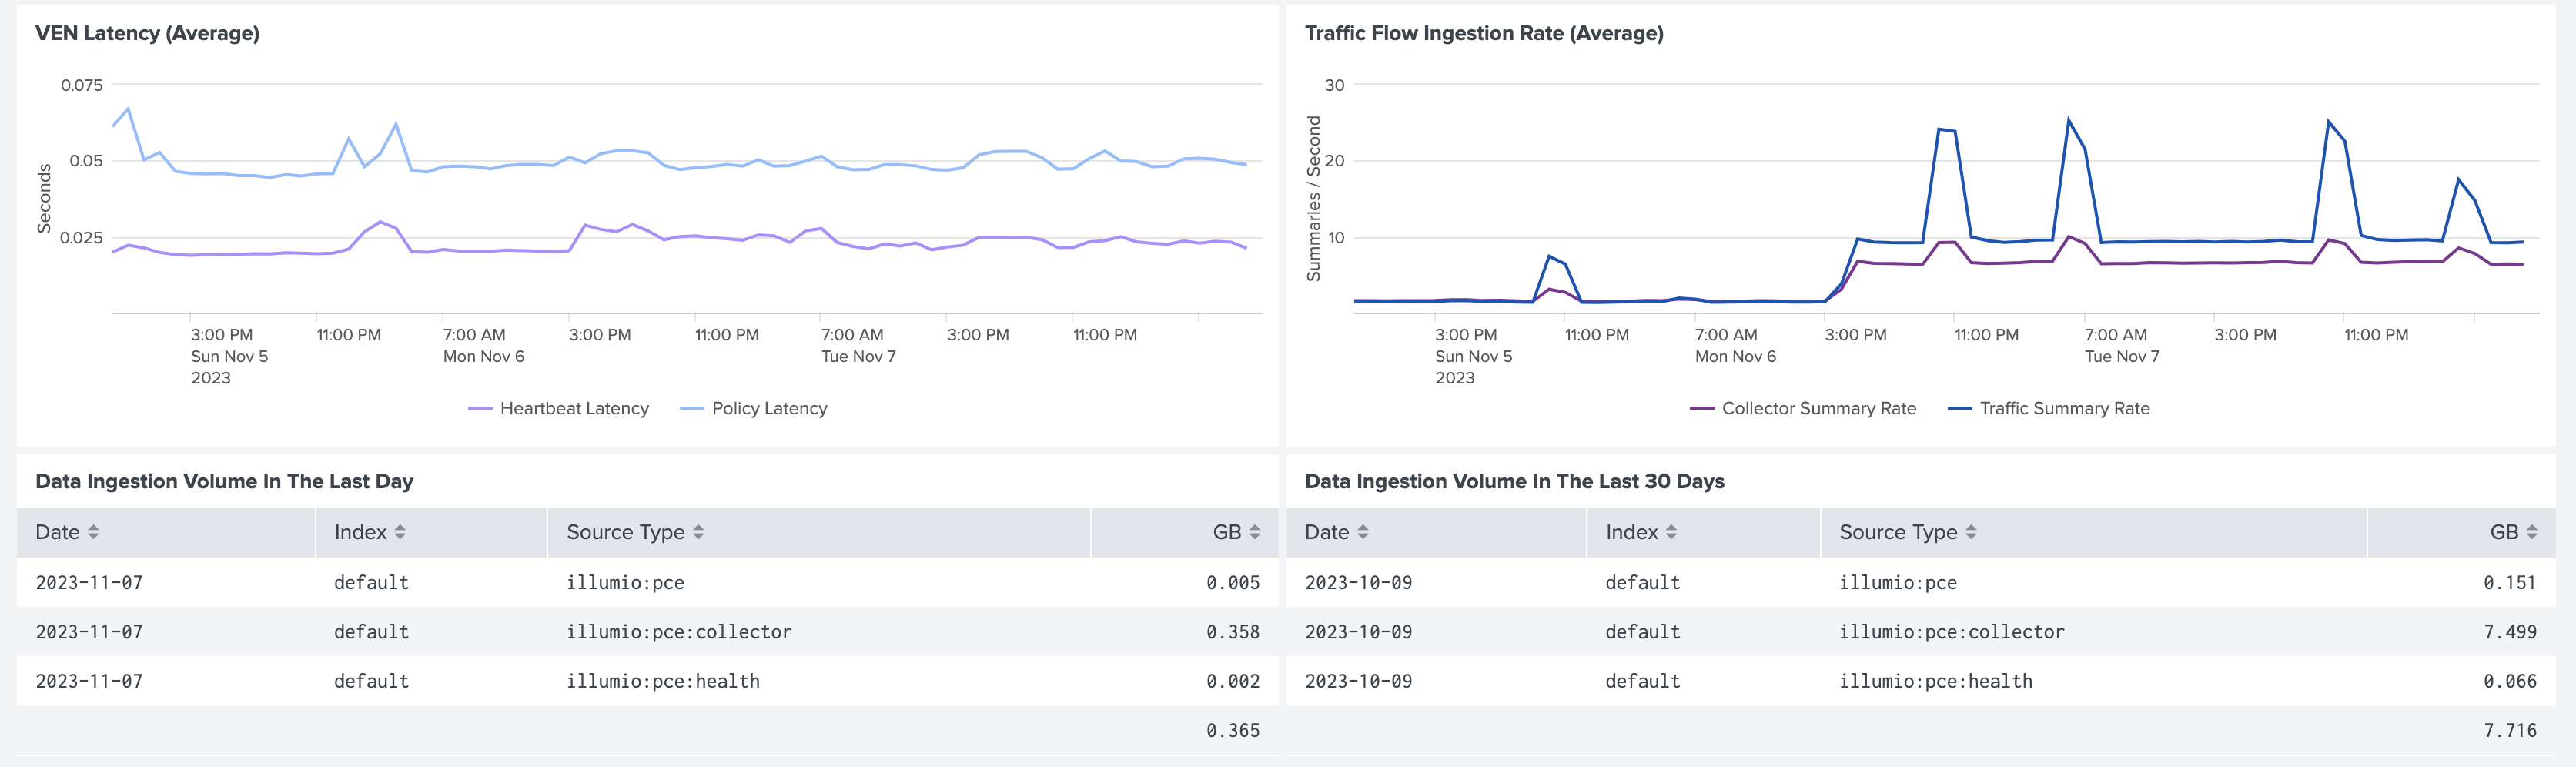
The VEN Latency panel provides an aggregate view of heartbeat and policy latency times for all VENs. The Traffic Flow Ingestion Rate panel shows average traffic flow collection rates to the PCE.
Finally, the Data Ingestion panels at the bottom of the dashboard show the index volume, in gigabytes, broken down by sourcetype.
Note
Only users with the admin or sc_admin roles can view the data ingestion panels.
PCE Authentication Events Dashboard
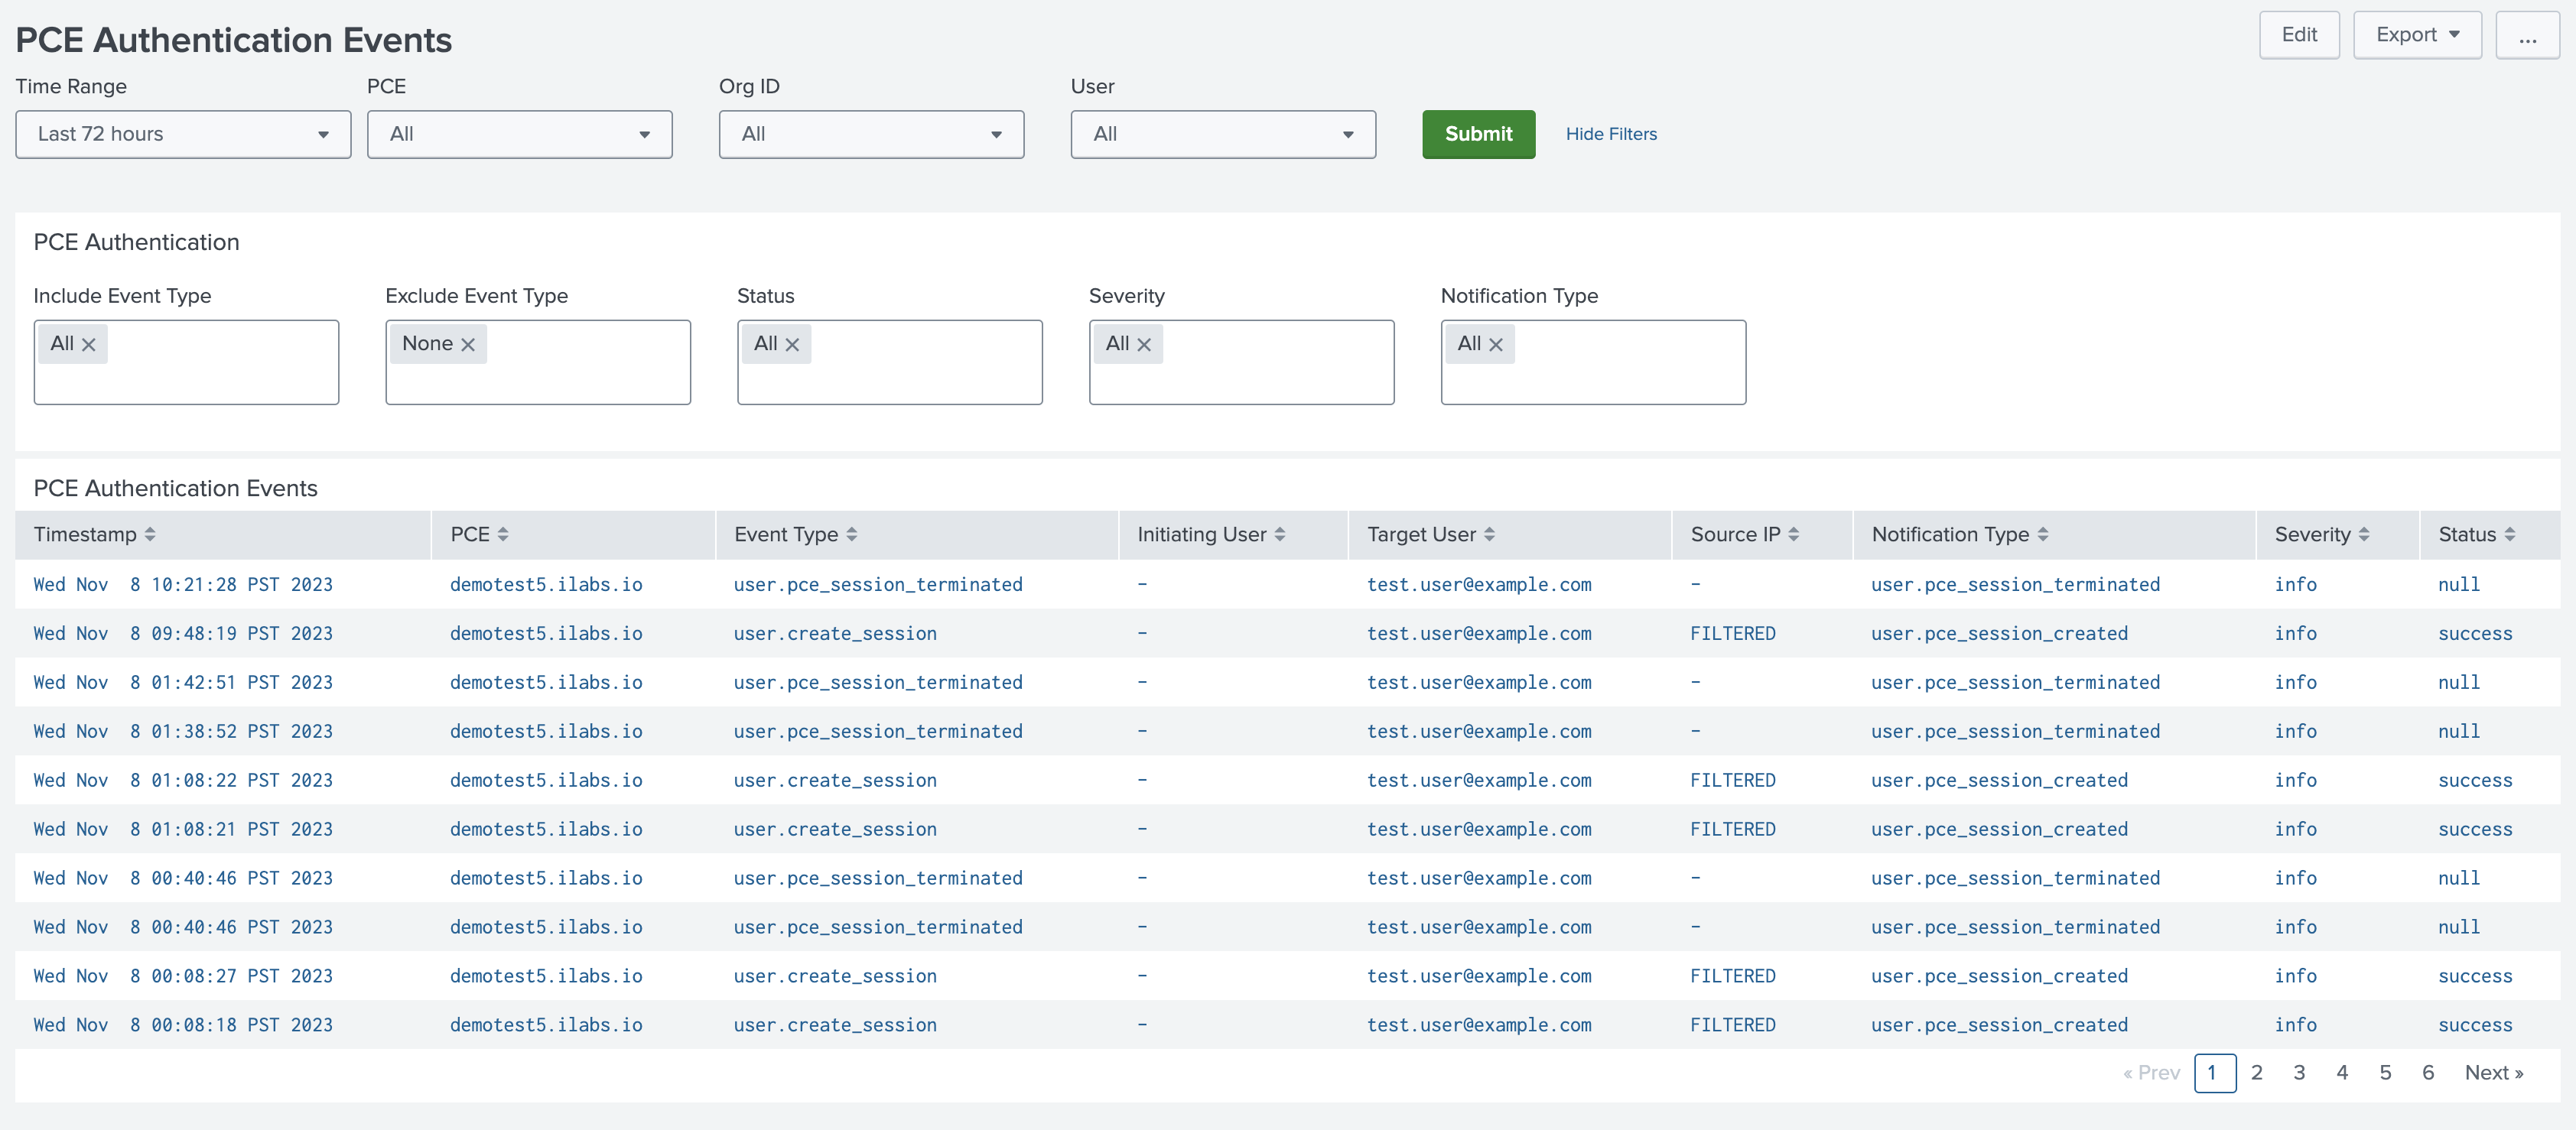
The PCE Authentication Events dashboard shows all authentication and authentication-related events that were made to the PCE. You can filter events by user, type, and severity.
Workload Operations Dashboard
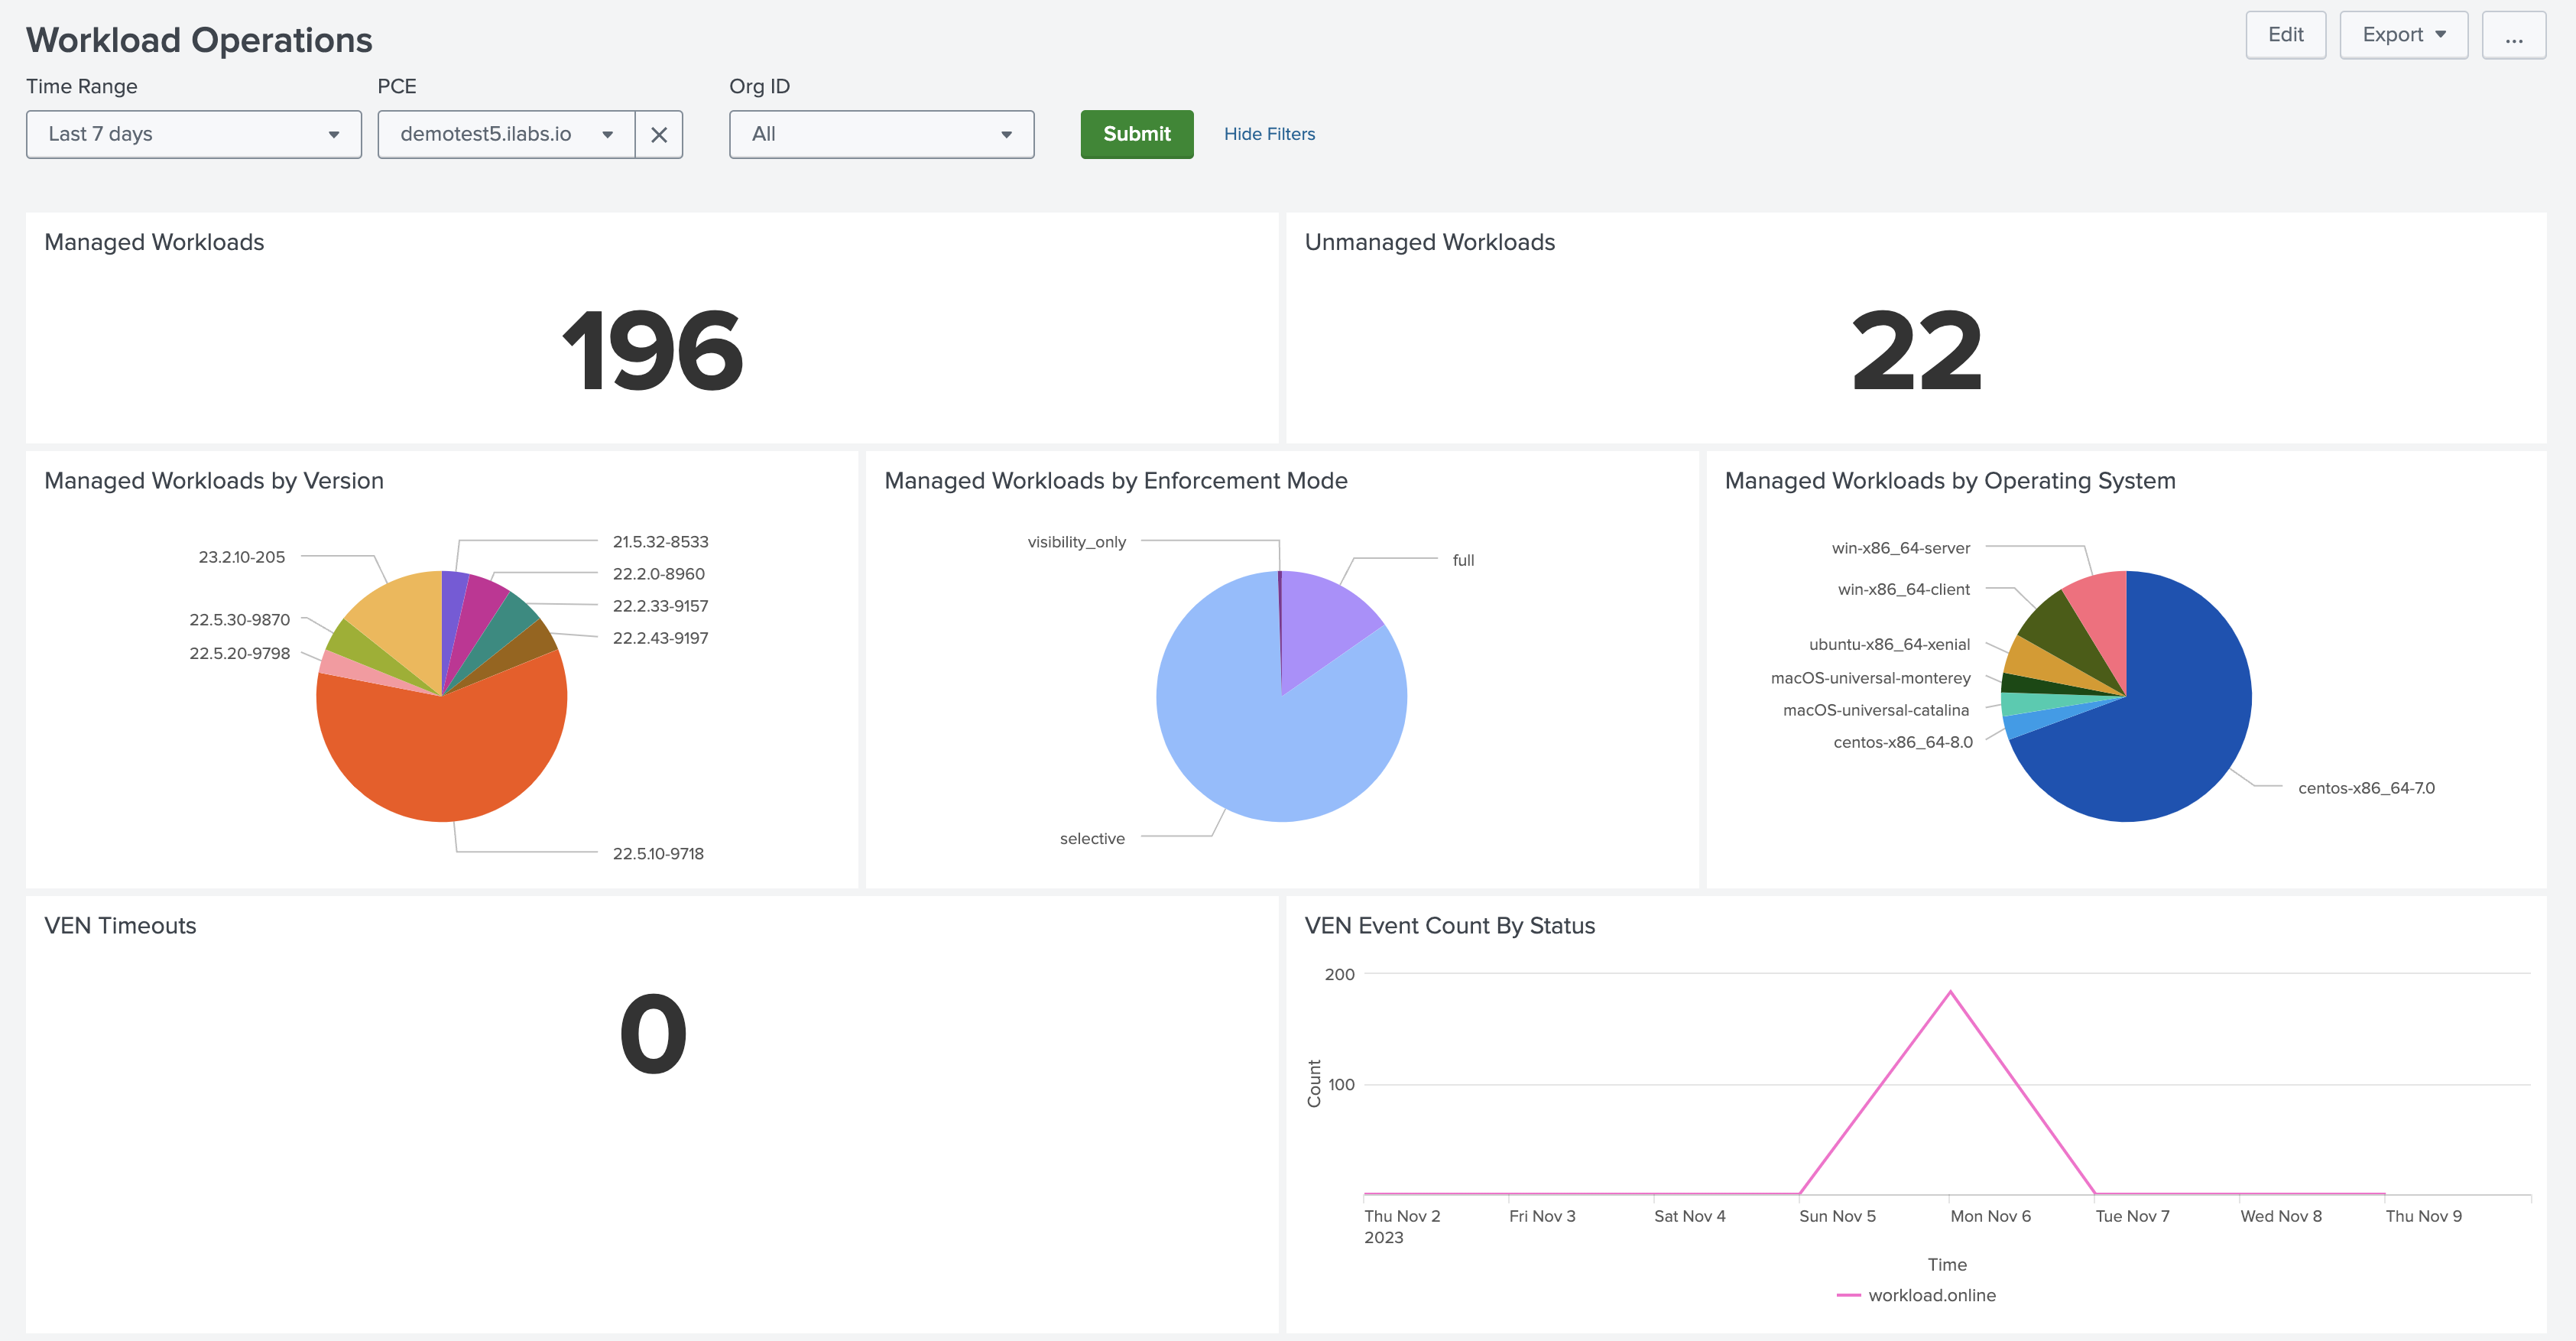
The Workload Operations dashboard shows breakdown of managed and unmanaged workloads by VEN version, enforcement mode, and operating system. It also shows VEN timeouts and VEN/workload events over time.
Workload Investigations Dashboard
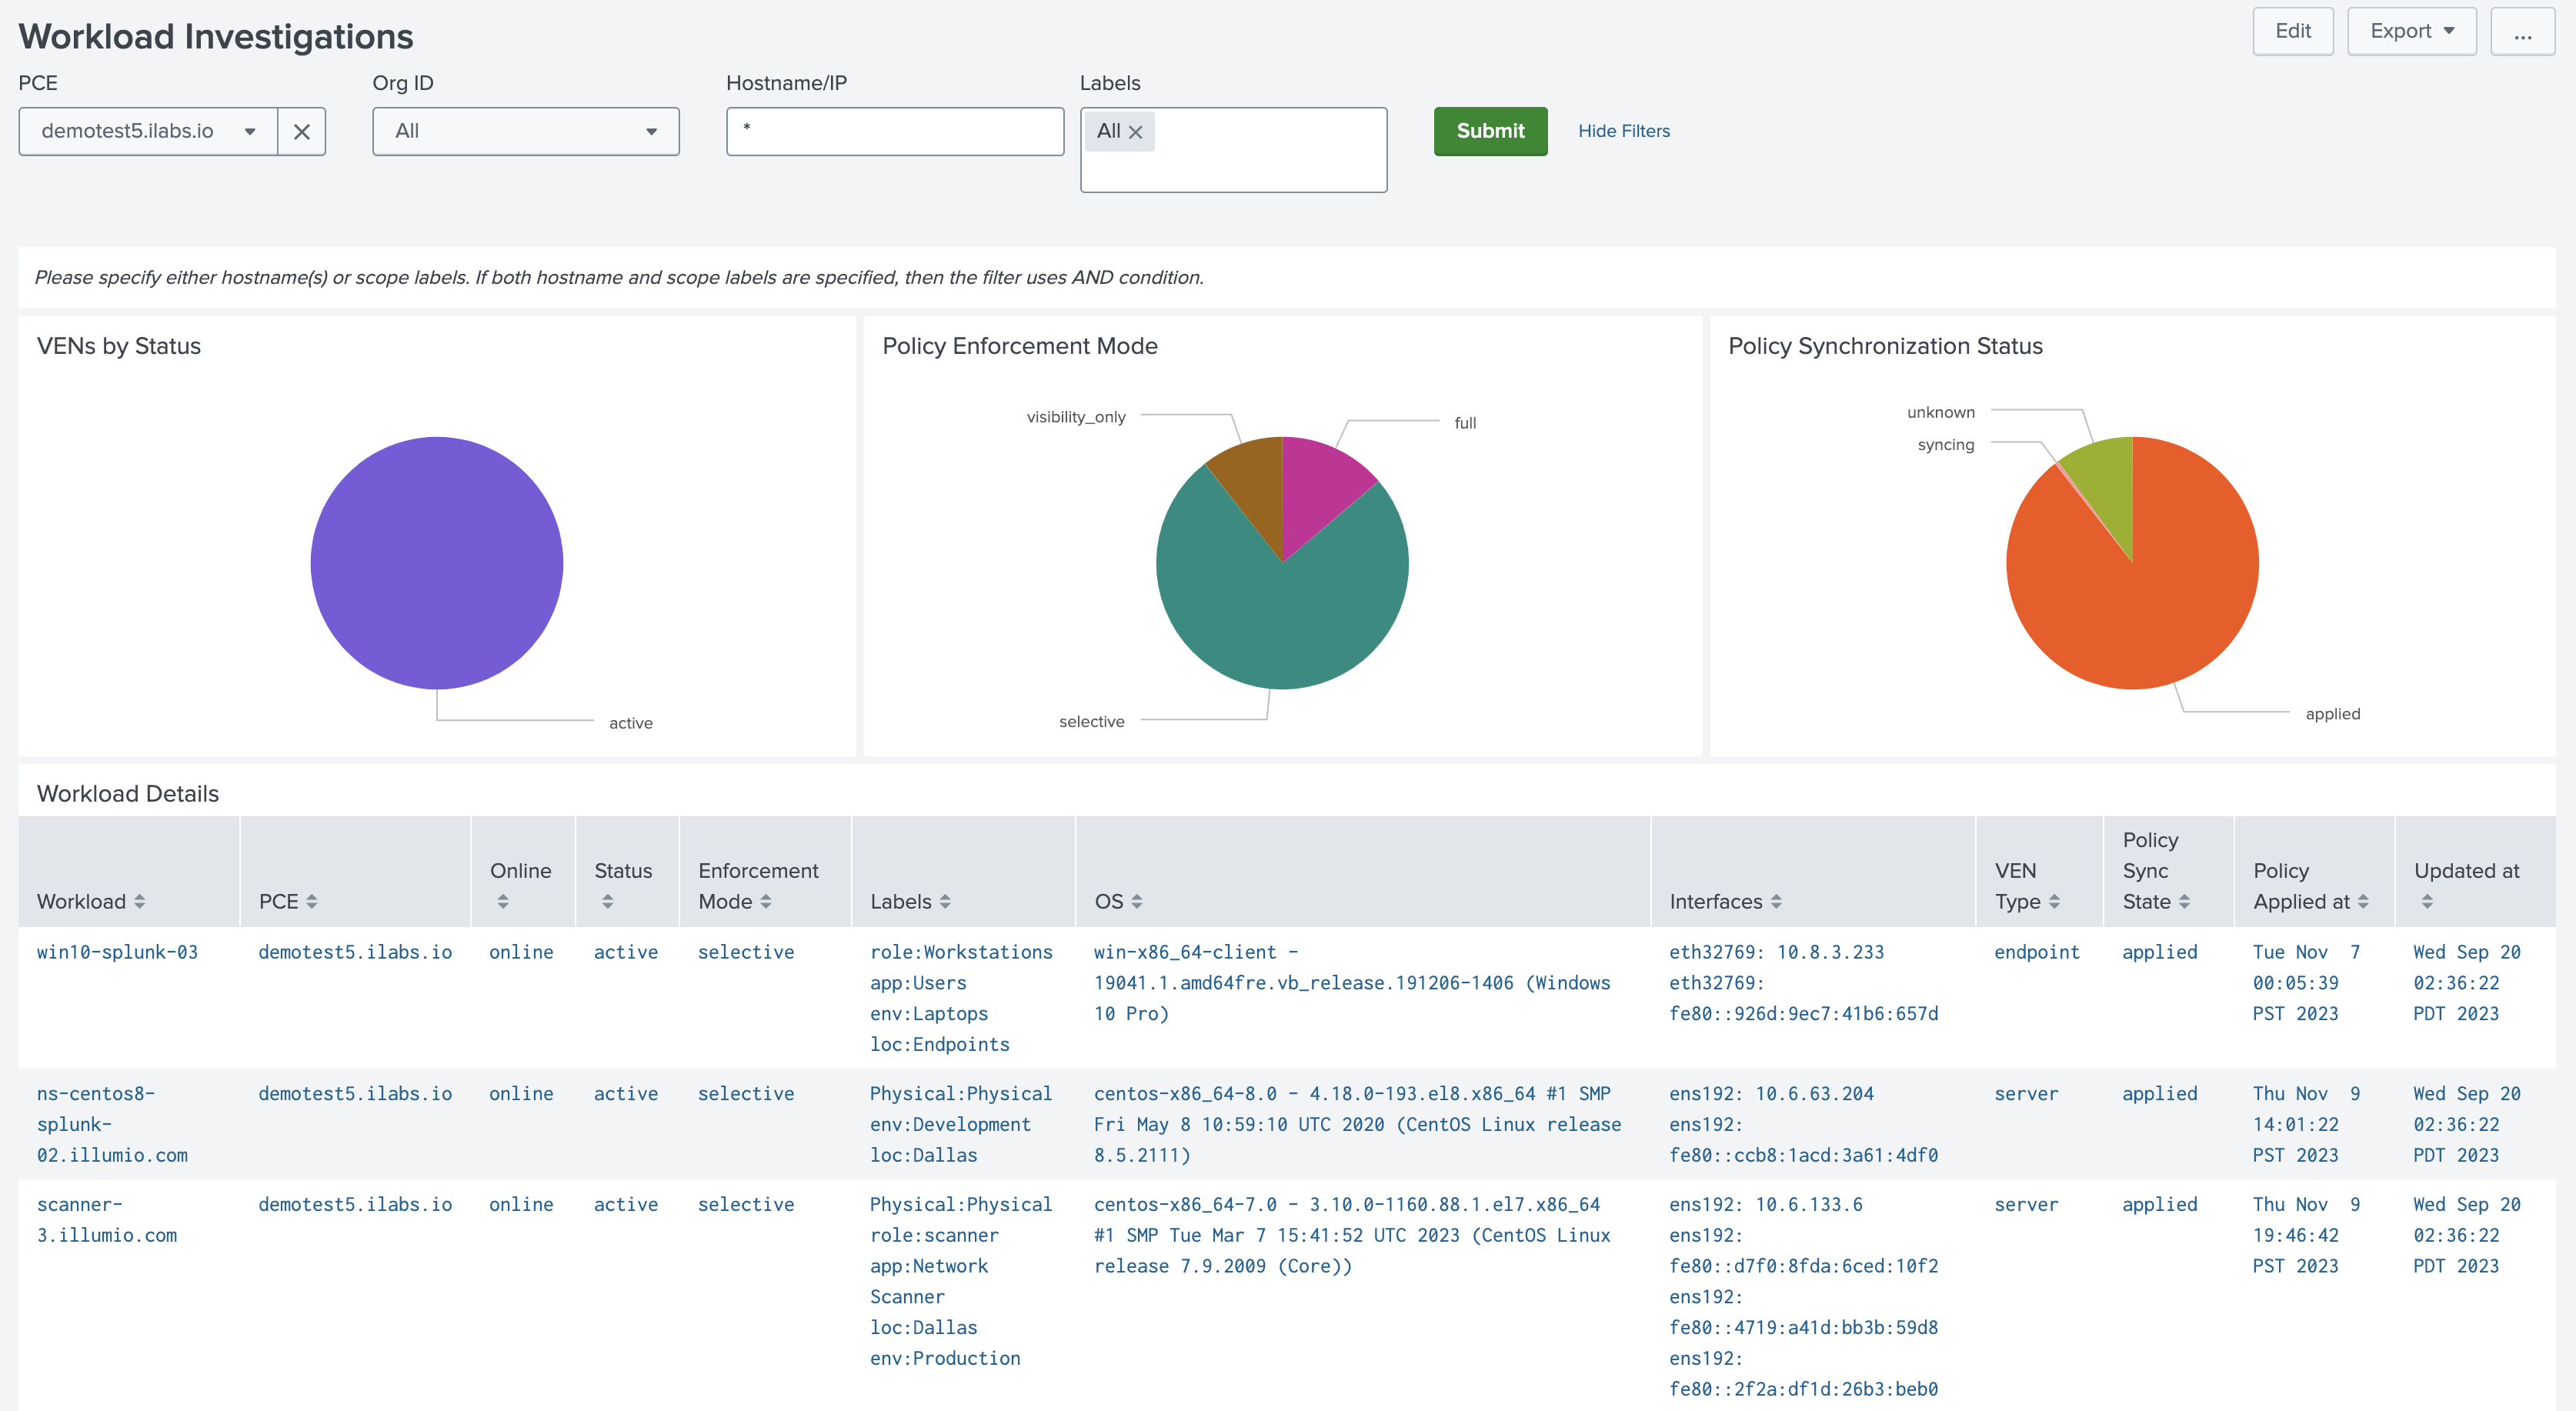
The Workload Investigations dashboard shows a more detailed breakdown of workload metadata and events, as well as VEN status and policy synchronization status.
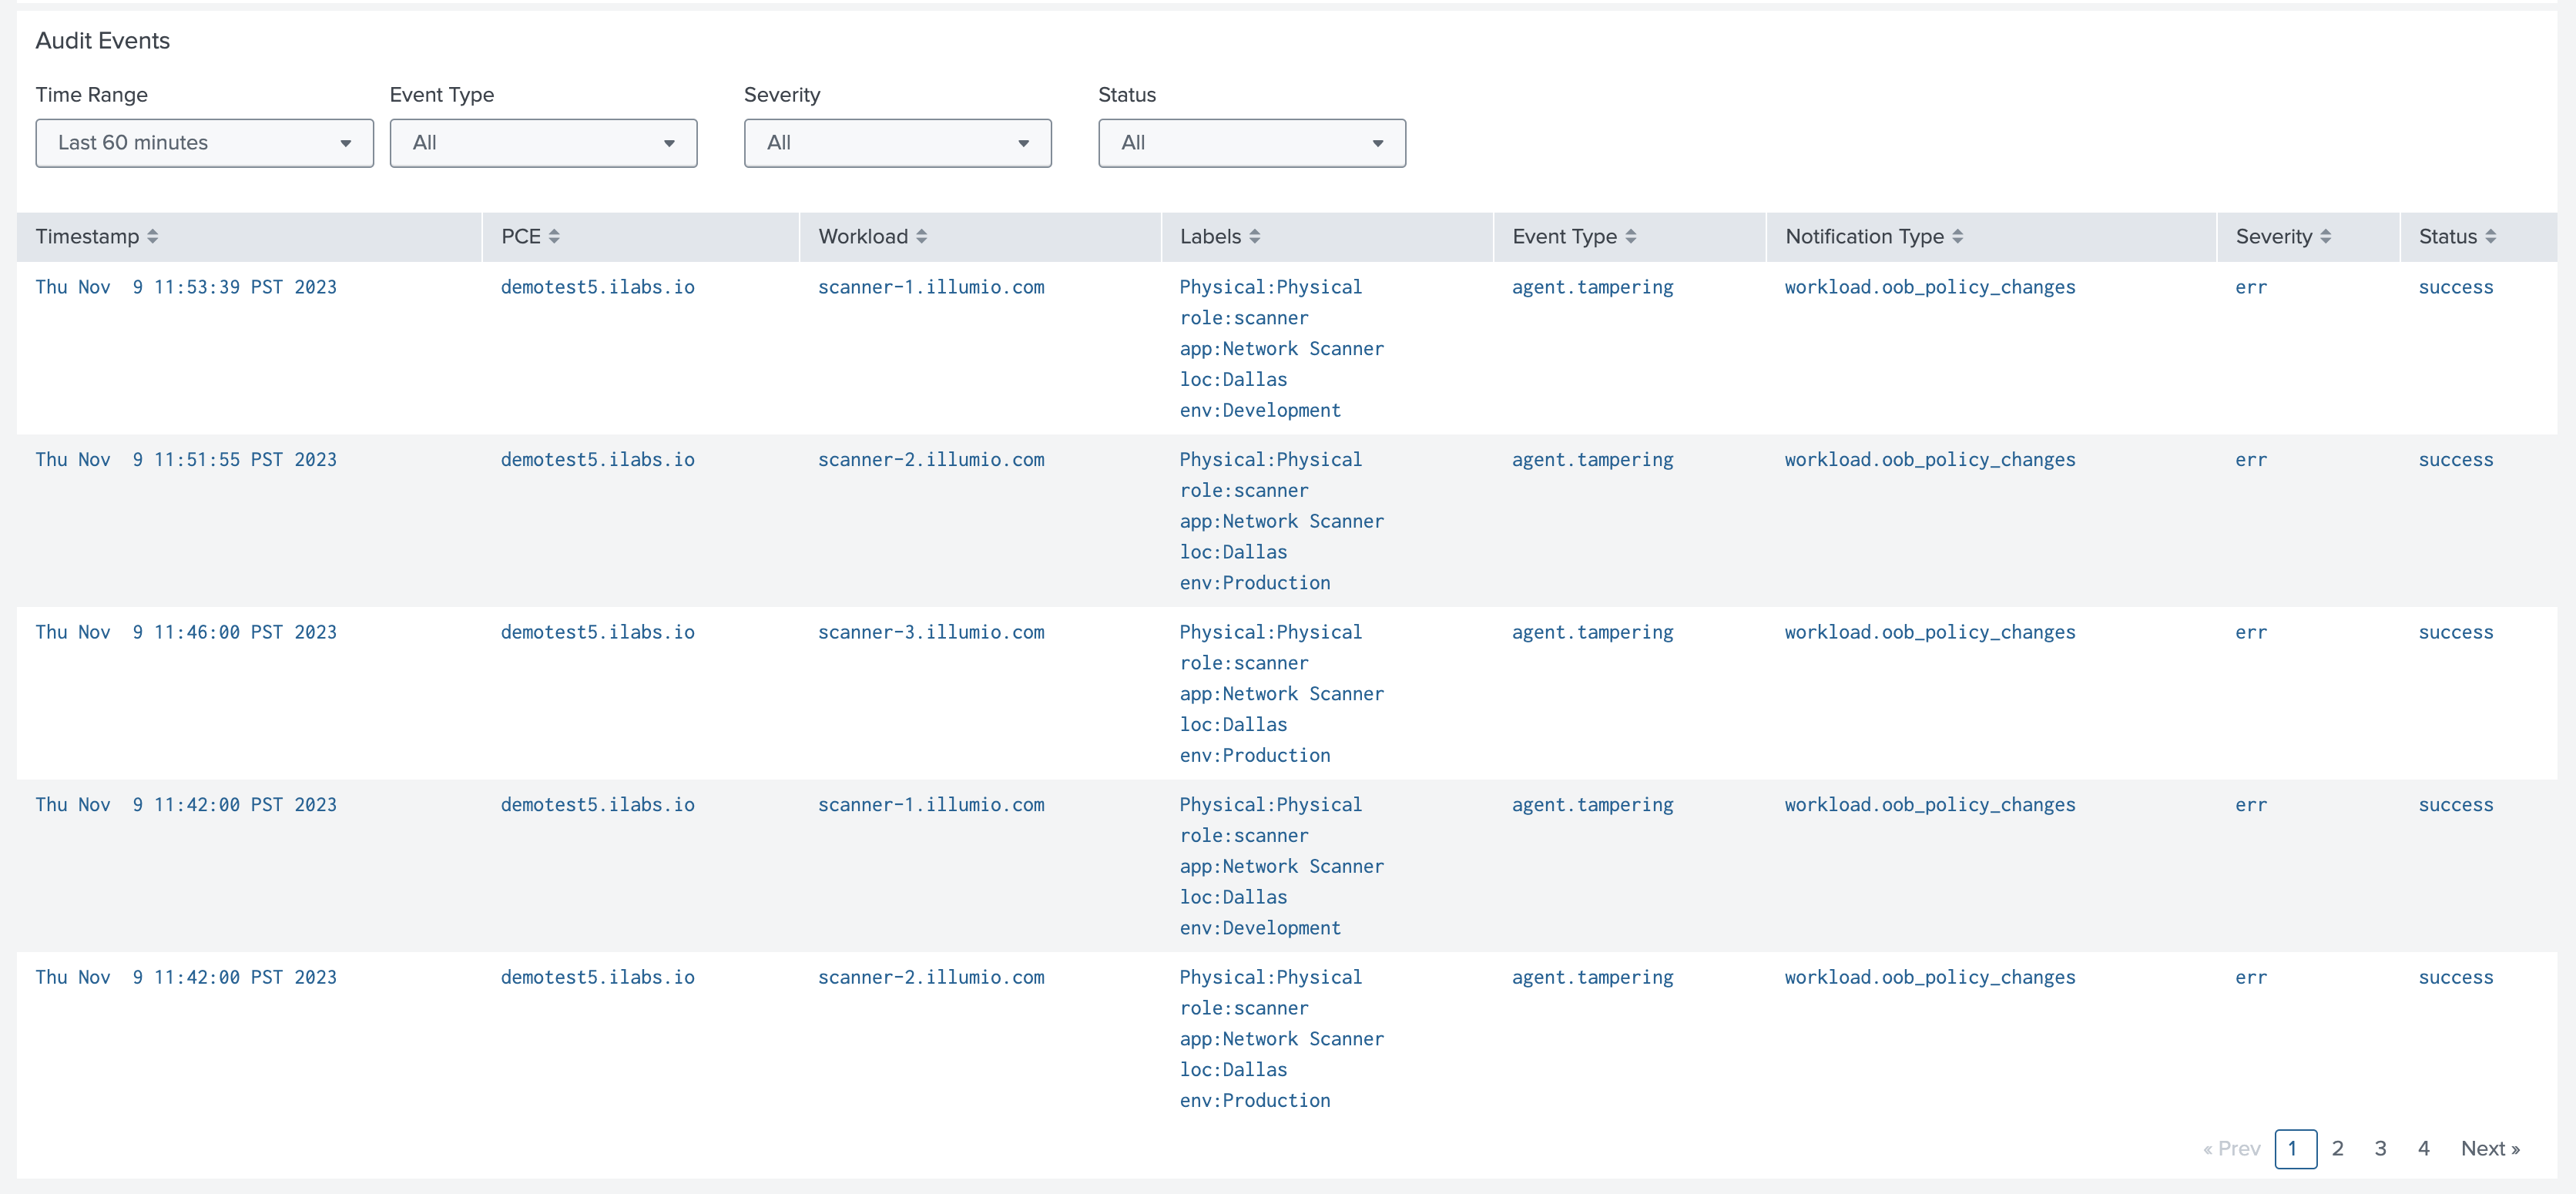
The Audit Events table at the bottom of the dashboard highlights the most recent VEN and workload events on the PCE.
Traffic Explorer Dashboard
The Traffic Explorer dashboard displays traffic flows reported from managed workloads or otherwise uploaded to the PCE. The visualizations show traffic grouped by policy decision, port, and source/destination.
You can filter traffic by source/destination hostname or IP address, assigned labels, policy decision, port, and transport protocol.
Note
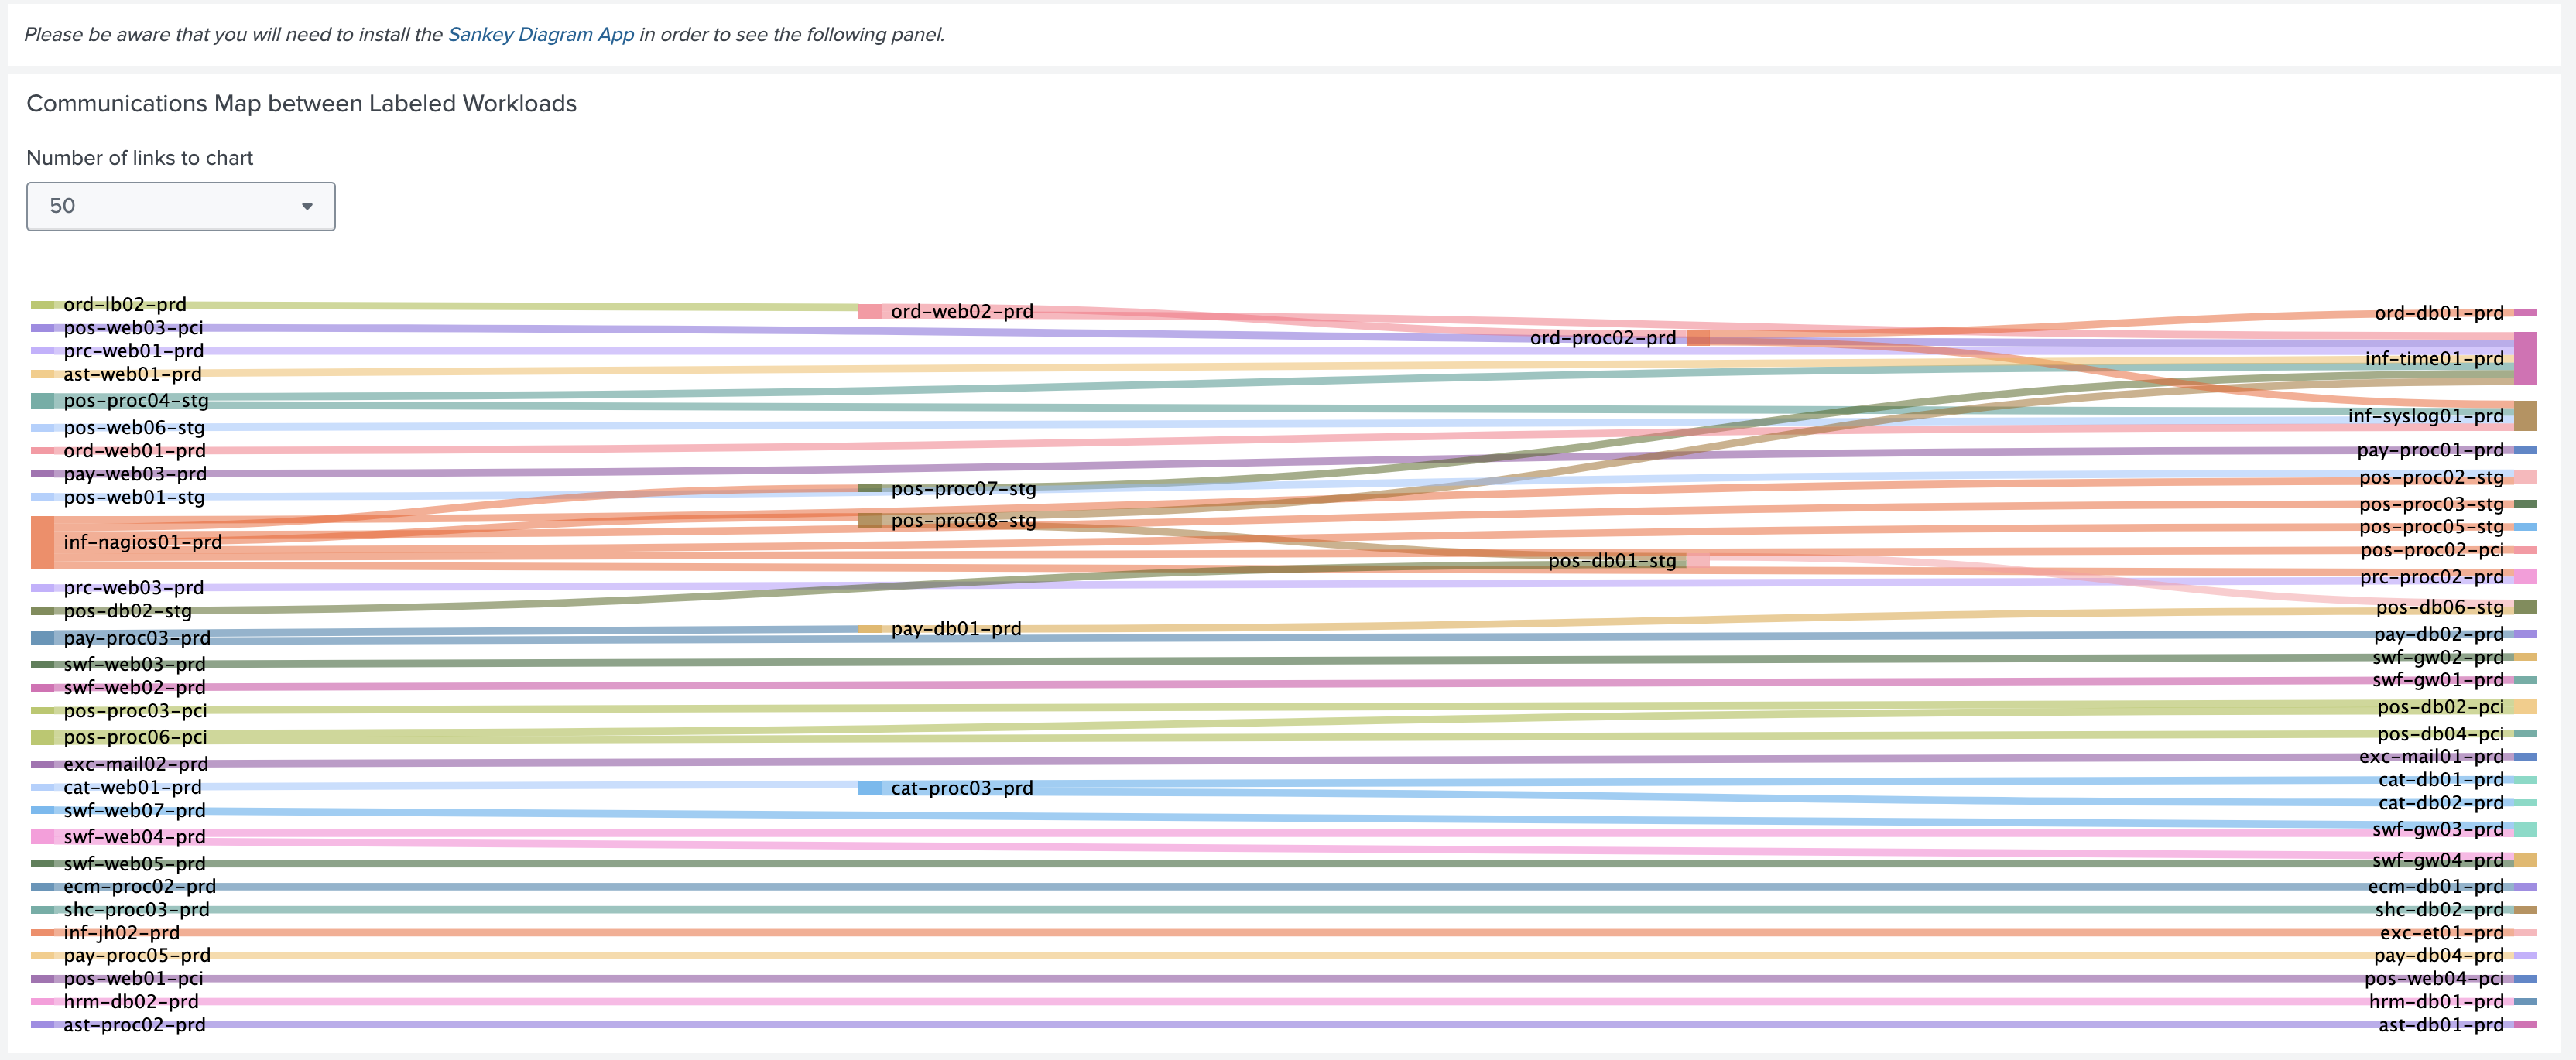
The Communications Map between Labeled Workloads chart shown below uses the Splunk Sankey Diagram Custom Visualization app. You must install the app to render the chart.
Each link in the chart is grouped by source, destination, and destination port. The thickness of the link represents the relative flow count.
Change Monitoring Dashboard
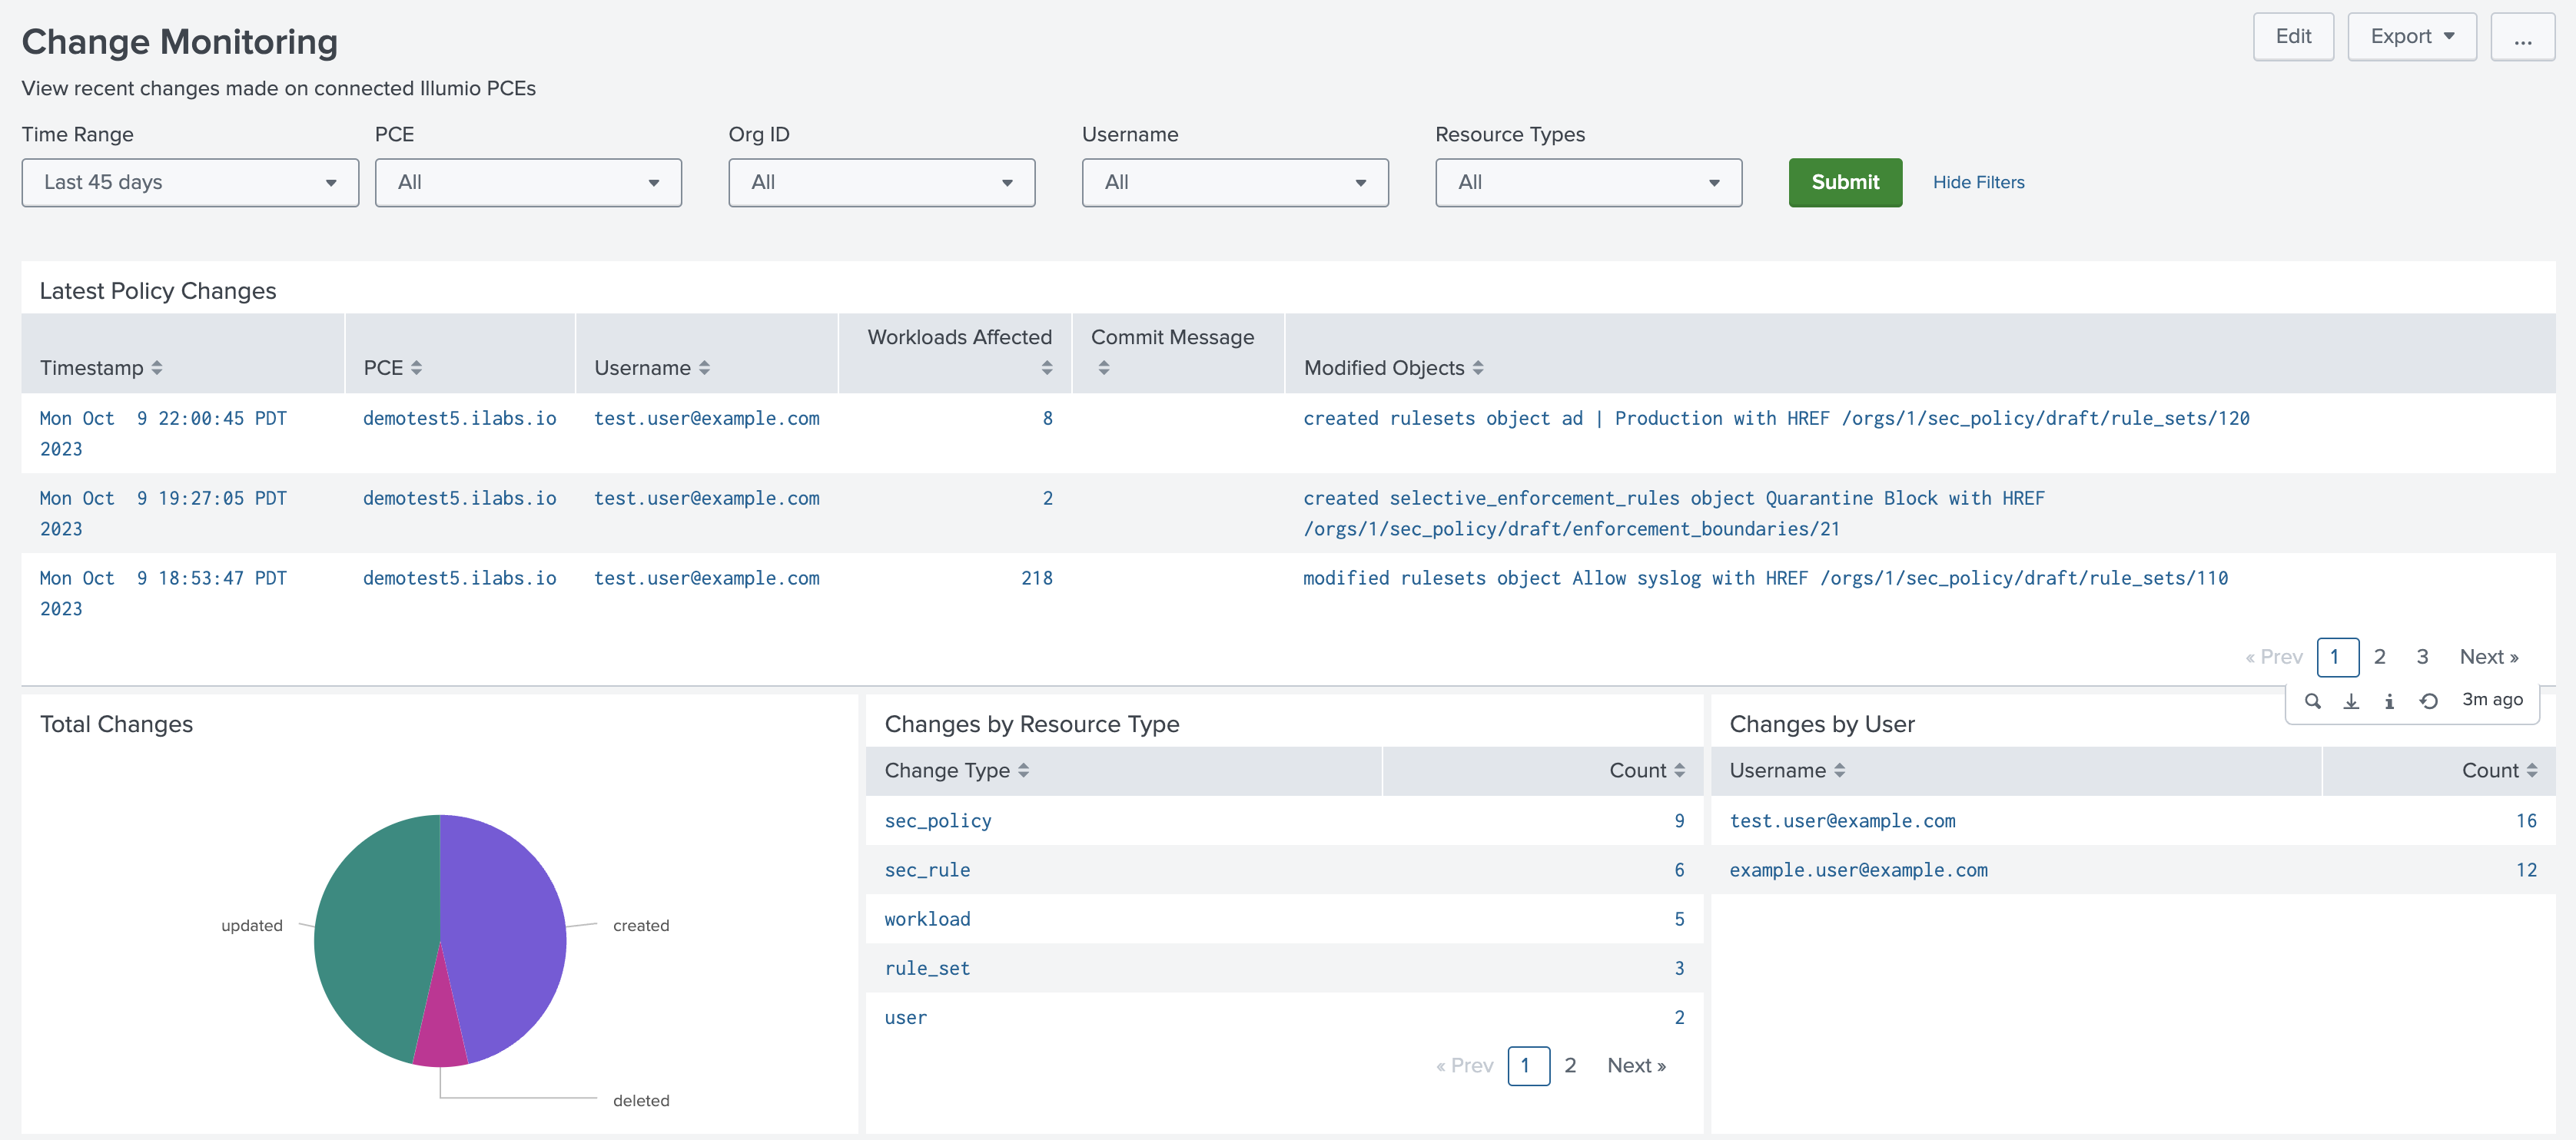
The Change Monitoring dashboard shows recent security policy changes, and groups auditable change events (creates, updates, and deletes) by count, resource type, and initiating user.
Data Model
The Illumio App for Splunk provides an Illumio data model that can help to improve search performance at the cost of disk space by building a limited index of PCE syslog event fields.
Note
According to Splunk app guidelines, model acceleration is disabled by default.
The model provides the following objects:
Name | Type | Parent | Base Search | Description |
|---|---|---|---|---|
Audit | Root event node | - | illumio_get_index sourcetype="illumio:pce" | Auditable syslog events |
Traffic | Root event node | - | illumio_get_index sourcetype="illumio:pce:collector" | Traffic flow events |
Status | Root event node | - | illumio_get_index sourcetype="illumio:pce:health" | PCE system health and status events |
Status.Policy | Child event node | Status | event_source="policy" | Policy service events |
Status.Collector | Child event node | Status | event_source="collector" | Collector service events |
Status.FlowAnalytics | Child event node | Status | event_source="flow_analytics" | Flow analytics service events |
Illumio data model nodes can be referenced using the tstats command
| tstats sum(Traffic.count) AS flows FROM datamodel=Illumio.Traffic WHERE
Traffic.pce_fqdn="my.pce.com" BY Traffic.timestamp, Traffic.src_ip, Traffic.dest_ip
Data Model Acceleration
Note
Enabling or disabling accleration for the Illumio data model requires the accelerate_datamodel capability. The admin or sc_admin roles have this capability by default.
To enable acceleration for the Illumio data model:
Note
If you are using a distributed search head cluster, see Sharing data model acceleration summaries among search heads to avoid rebuilding the summary on each search head in the cluster.
Navigate to Settings > Data models.
Select Illumio App for Splunk from the App dropdown menu.
Click the Edit dropdown under Actions for the Illumio data model.
Click Edit Acceleration.
Check the Acceleration toggle in the dialog and adjust the Summary Range and advanced settings as needed. See the Splunk documentation on data model acceleration for a more detailed explanation of the individual parameters for configuring acceleration.
Click Save. It may take a while to build the summary for the accelerated model.
Click the arrow to the left of the model name to view the progress in the ACCELERATION section.
To rebuild the Illumio data model summary:
Navigate to Settings > Data models.
Select Illumio App for Splunk from the App dropdown menu.
Click the arrow to the left of the Illumio data model name.
Click Rebuild under the ACCELERATION section.
Install the Illumio Splunk Apps
You can install the Illumio Splunk integration apps in either a distributed or a standalone Splunk environment.
Note
Recommendations for the configuration and topology of a distributed Splunk environment are outside of the scope of this document. See About Splunk Validated Architectures for suggestions on topology for distributed deployments.
Install the Illumio Splunk Apps in a Distributed Environment
For a distributed environment, install the TA to a Splunk Heavy Forwarder, as well as the indexer/indexer cluster and search head/search head cluster. Configure the Illumio modular input to run on the Heavy Forwarder. You need to install on the search head tiers if you want to use index-time and search-time transforms in the app.
Note
You only need to install the Illumio App for Splunk on the search tier.
Note
You cannot install the Illumio Technology Add-On for Splunk on a Universal Forwarder.
Install the Illumio Technology Add-On for Splunk in a Standalone Environment
The following procedures describe how to install the TA through the Splunk UI and manually.
Use the following procedure to install the TA through the Splunk UI.
In the Splunk UI, navigate to the Manage Apps page using the Apps drop-down in the top-left corner or by clicking the gear icon next to Apps on the Splunk homepage.
Click Browse More Apps, and search for TA-Illumio.
Click Install.
Enter your Splunk login credentials when prompted, and then click Agree and Install.
When prompted, restart Splunk.
Use the following procedure to install the TA manually:
Navigate to the Illumio-TA app in Splunkbase.
Log in using your Splunk credentials.
Click Download.
Read through and accept the EULA and Terms and Conditions, and then click Agree to Download.
Transfer the downloaded .tgz or .spl file to the Splunk server.
Install the app manually:
Using the Splunk binary:
$SPLUNK_HOME/bin/splunk install app /path/to/TA-Illumio.splOr by extracting directly under /apps:
tar zxf /path/to/TA-Illumio.spl -C $SPLUNK_HOME/etc/apps/Restart Splunk.
Configure the Illumio Technology Add-On for Splunk
After installing the Illumio TA, you will need to configure the Illumio modular input and a TCP receiver for Syslog events from the PCE.
Start by creating a PCE API key to use when setting up the input.
Create a User-Scoped API Key
In the PCE, open the user menu drop-down in the top-right corner of the page, and select My API keys.
Click Add, note the Org ID shown in the dialog, and enter a display name for the key.
Click Create, and then copy or download the API key credentials and store them somewhere secure.
Create a Service Account API Key
The Org ID value is not shown when you create a Service Account key. It is displayed when you create a User API key, as described in Create a User-Scoped API Key.
Note
The Org ID value is not shown when you create a Service Account key. It is displayed when you create a User API key, as described in the preceding procedure.
In the PCE, open the Access submenu on the left side of the screen and select Service Accounts.
Click Add, and enter a display name and one or more Roles to assign to the key. The TA-Illumio Add-On requires only read-only access to policy object endpoints, so the Global Viewer role should be sufficient.
Note
To use the workload quarantine action, the API key that is used for the input must have write permissions for workloads.
Click Save, and then copy or download the API key credentials and store them somewhere secure.
Warning
Service Account API keys have a default lifetime of 90 days. Take note of the expiration data for your key and replace it before it expires.
Configure the Illumio Modular Input
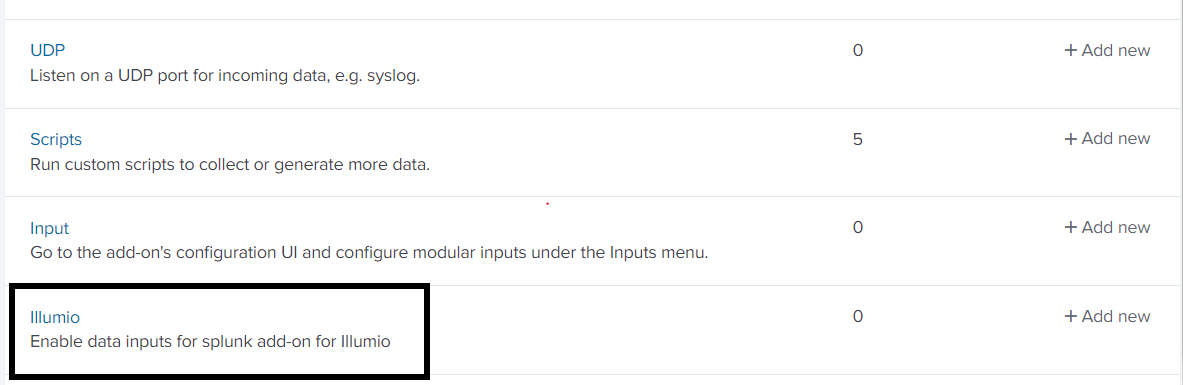
Navigate to Settings > Data inputs and find the Illumio input type.
Click the + Add New action to create a new input.
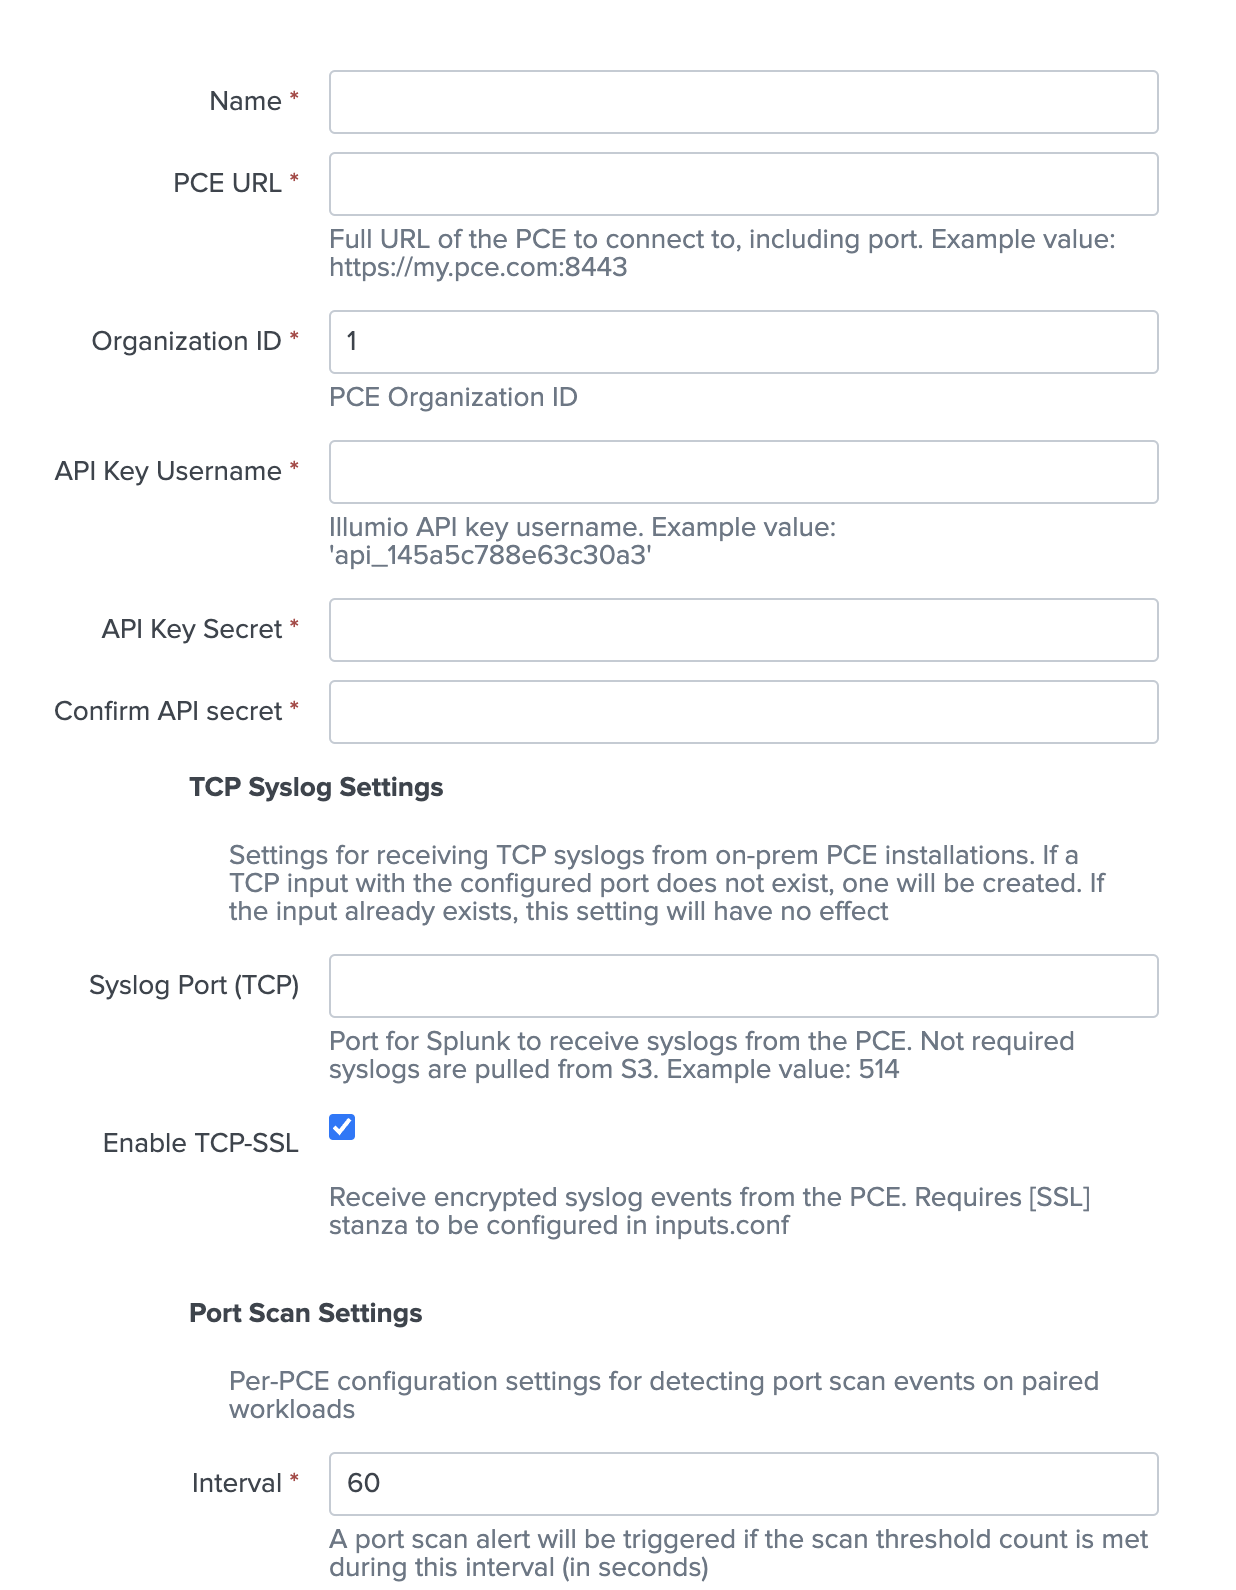
Enter a display name for the input and the connection details for your PCE. Enter the Organization ID and API key username and secret values copied from the steps above.
(On-prem only) To receive syslog events forwarded from an on-prem PCE, a TCP input must be configured in Splunk. Setting the Syslog Port (TCP) value will automatically create one when the input runs if it does not already exist. The Enable TCP-SSL option determines whether a [tcp-ssl] or [tcp] stanza will be created (See Configure TCP SSL for more information.)
Adjust any of the remaining parameters as needed. Make sure that the index is set correctly. (Check the More settings checkbox to display additional settings.) To enable automated quarantine using the illumio_quarantine action, specify one or more labels that make up a quarantine policy scope in the PCE in the Quarantine Labels field.
Click Next. If an error dialog appears, double-check the field values and refer to the Troubleshooting section.
Parameter | Description | Required | Default Value | Example Value |
|---|---|---|---|---|
Name | Modular input display name. Must be unique. | Y | - | mypce_input |
PCE URL | The full URL of the Illumio PCE to connect to. If a scheme is not provided, https:// is used by default. If a port is not provided, it is assumed to be the default for the given scheme (80 for HTTP, 443 for HTTPS). | Y | - | https://my.pce.com:8443 |
Organization ID | The ID number of the PCE organization to connect to. | Y | 1 | - |
API Key Username | The API key ID to use when connecting to the PCE. | Y | - | api_145a5c788e63c30a3 |
API Key Secret | The API key secret to use when connecting to the PCE. | Y | - | - |
Syslog Port (TCP) | Designates a port on the Splunk server to receive syslog events from the Illumio PCE. There must not be an existing TCP input for the given port. Only used for direct forwarding from the PCE. Syslog events pulled from Amazon S3 must be configured separately using the AWS S3 TA. | N | - | 514 |
Enable TCP SSL | Toggles SSL for the created TCP syslog input. The [SSL] stanza must be configured separately. | N | True | - |
Port Scan Interval | The interval, in seconds, within which Port Scan Threshold scanned ports will trigger an alert. | Y | 60 | - |
Port Scan Threshold | Defines a threshold that will trigger an alert when more than the configured number of ports are scanned within Port Scan Interval seconds. | Y | 10 | - |
Port Scan Allowed IPs | Comma-separated list of source IP addresses to exempt from port scan alerts. | N | - | 10.0.0.1,10.0.0.2 |
Quarantine Labels | Optional comma-separated list of label key:value pairs that represent a quarantine zone scope in the PCE. Configured labels are applied to selected workloads when the illumio_quarantine action is run. The labels must exist in the PCE and any policy that restricts access to the quarantine zone must be defined separately. It must be of the form key1:value1,...,keyN:valueN Keys and values are case-sensitive. | N | - | app:A-Quarantine,env:EQuarantine, loc:L-Quarantine |
CA Certificate Path | Optional path to a custom CA certificate bundle | N | - | $SPLUNK_HOME/etc/ apps/TA-Illumio/certs/ ca.pem |
HTTP Proxy Address | HTTP proxy address. | N | - | http://my.proxy-server. com:8080 |
HTTPS Proxy Address | HTTPS proxy address. | N | - | https://my.proxy-server. com:8443 |
HTTP Retry Count | Number of times to retry the connection to the PCE. | N | 5 | - |
HTTP Retry Interval | The total HTTP request timeout for the PCE in seconds. | N | 30 | - |
Interval | Input run schedule in seconds or as a cron expression. | Y | 1800 | */30 * * * * |
Index | Splunk index for the input to write events to. | Y | default (main) | - |
Configure TCP SSL
To configure syslog forwarding encrypted with TLS, both a [tcp-ssl] stanza and an [ssl] stanza must be configured in $SPLUNK_HOME/etc/apps/TA-Illumio/local/inputs.conf.
The TCP-SSL stanza will be created automatically as described above, but the `[SSL]` stanza must be created manually. This step only needs to be done once for any number of Illumio inputs.
When using an existing certificate authority, generate a server certificate for Splunk with the CN or SAN set to the Splunk instance hostname or IP address.
When using a self-signed certificate, see the How to create and sign your own TLS certificates. Make sure that the root CA certificate is created with extensions and the ca flag is set to true (checked by syslog-ng validation).
Create the SSL stanza with the following fields:
[SSL]
serverCert = /path/to/my/splunk_server.crt
sslPassword = splunk_server_cert_pass
Restart Splunk.
Note
Do not use the Splunk default certificates when configuring SSL.
Configure Syslog Forwarding for On-Prem PCEs
In the PCE, open the Settings submenu on the left side of the screen and select Event Settings.
Click Add to create a new Event Forwarding rule.
Select the event types to forward to Splunk.
Click Add Repository.
Enter a description for the repository and the Splunk hostname/IP and the port value of the TCP stanza created for the Illumio input. Leave the protocol value as TCP.
If TCP-SSL is configured in Splunk for the target port, set the TLS field to Enabled and upload a certificate bundle containing the root and any intermediate certificates in the chain for your CA.
Note
If you are enabling TLS, the address value must match the CN or SAN of the Splunk server certificate.
Select the Verify TLS option to ensure that your certificates and TLS configuration are valid.
Click Add and select the option for the created repository.
Click Save.
A test event will be sent to Splunk to verify the connection.
In Splunk, run the following search to make sure that the test event arrived:
index=illumio_index sourcetype="illumio:pce" "Testing syslog
connection from PCE"
Configure Syslog Forwarding for Cloud PCEs
Reach out to Illumio Customer Support to configure Syslog event forwarding to AWS S3. The target bucket can be internal or managed by Illumio.
After the bucket is configured, make sure the Syslog files are being sent.
Install the AWS S3 TA from Splunkbase.
Follow the configuration instructions for Generic S3 inputs in the AWS S3 TA documentation.
Create two inputs, one for auditable events and one for collector (traffic flow) events.
In each input, specify a Log File/S3 Key Prefix with the path to either auditable or collector event logs within the S3 bucket.
Install the Illumio App for Splunk
Note
The Illumio Add-On is required for the Illumio App for Splunk to work.
Installing the Illumio App for Splunk Using the Splunk UI
In the Splunk UI, navigate to the Manage Apps page using the Apps drop-down in the top-left corner or by clicking the gear icon next to Apps on the Splunk homepage.
Click Browse More Apps and search for IllumioAppforSplunk.
Click Install.
Enter your Splunk login credentials when prompted, and then click Agree and Install.
If prompted, restart Splunk.
Installing the Illumio App for Splunk Manually
Navigate to the Illumio App for Splunk app in Splunkbase.
Log in using your Splunk credentials.
Click Download.
Read through and accept the EULA and Terms and Conditions, and then click Agree to Download.
Transfer the downloaded .tgz or .spl file to the Splunk server.
Install the app manually:
Using the Splunk binary:
$SPLUNK_HOME/bin/splunk install app /path/to/IllumioAppforSplunk.tgzOr by extracting directly under /apps:
tar zxf /path/to/IllumioAppforSplunk.tgz -C $SPLUNK_HOME/etc/apps/Restart Splunk.
Configure the Illumio App for Splunk
Use the procedures in the following topics to configure the Illumio App for Splunk.
Create an Index for Illumio Events
Note
This is an optional step, but it is recommended. If you already created one or more indexes when you configured the Illumio Technology Add-On for Splunk, skip this step.
Navigate to Settings > Indexes.
Click New Index in the top-right corner.
Enter an index name and select Illumio App for Splunk from the App drop-down menu.
Set the other index parameters based on your expected event volume and retention policy.
Click Save.
Note
Make sure to configure the index based on your organization's compliance requirements and data retention policies. See Managing Indexers and Clusters of Indexers.
Update the illumio_get_index Macro
Navigate to Settings > Advanced Search > Search Macros.
Select Illumio App for Splunk from the App drop-down menu.
Click the illumio_get_index macro name to open the edit form.
Update the definition to reference one or more indexes, such as
(index="illumio_pce1" OR index="illumio_pce2").Click Save.
Accelerate the Illumio Data Model
This step is optional, but it is recommended. See Data Model Acceleration.
Install the Sankey Diagram App
The Traffic Explorer dashboard renders traffic flows using the Sankey diagram custom visualization app. The app is required for displaying the panel but it is not required.
Upgrade the Illumio App for Splunk
Use the installation steps above to upgrade the app using the Splunk UI or manually by downloading the app bundle from Splunkbase. Refer to the app’s Splunkbase documentation for detailed upgrade steps.
Note
The search-time extractions and transforms for version 4.0.0 are incompatible with data that was indexed by previous versions of the Illumio Technology Add-On for Splunk. When you are upgrading from an earlier version, see the version 4.0.0 upgrade steps in the Splunkbase documentation for detailed instructions.
About Alerting Actions and the Adaptive Response Framework
Provide Access to the Quarantine Workload Action
By default, users do not have access to the Quarantine Workload action either in the Splunk app or in Adaptive Response Action.
To enable a Splunk user to take the quarantine actions on workloads, grant the user the Illumio_quarantine_workload role and the admin role. Only local users can be granted this role. SAML users cannot, because their roles are constrained by an external system.
Click Settings > Access Control.
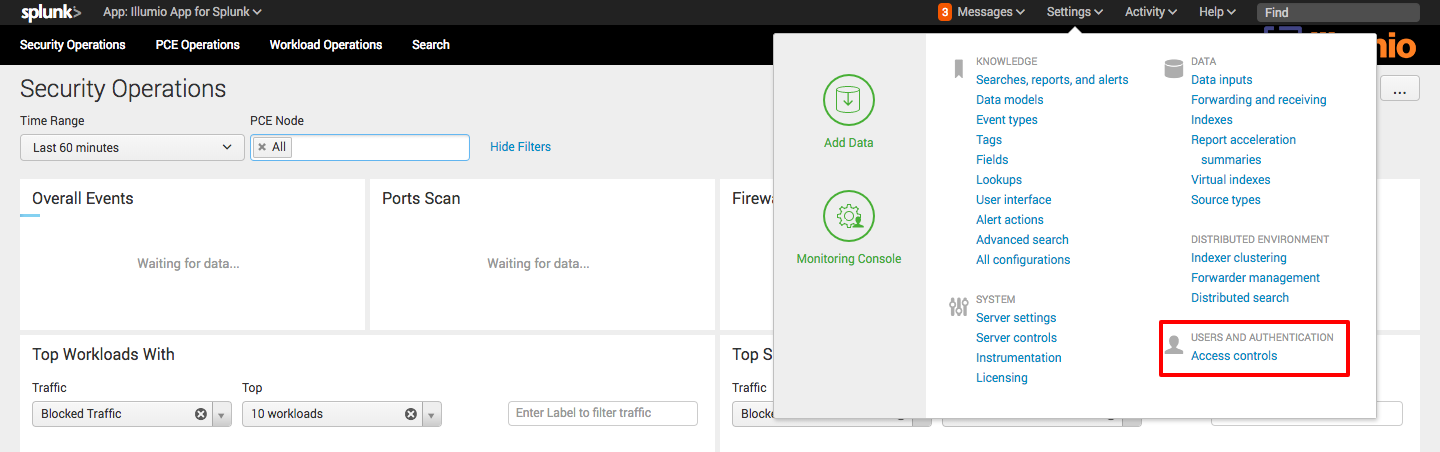
Click Users.

Click the username to which the role needs to be granted.
In the Role section of the edit screen, grant the required roles.
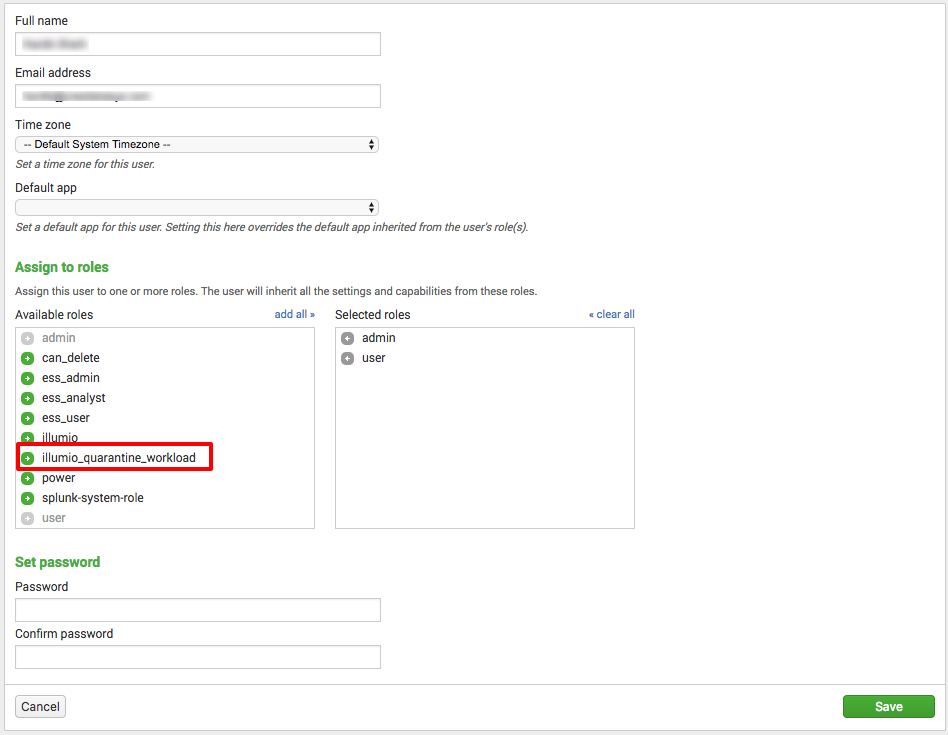
Click Save.
Quarantine Actions Using Splunk Core Alert Actions
Quarantine Workloads Using Enterprise Security Suite
Splunk provides the Splunk Enterprise Security Suite (ESS), which leverages Splunk’s Adaptive Response Framework and allows administrators to monitor and manage threats and incidents directly from Splunk apps. It has rich dashboards that help monitor incidents and take actions on these incidents.
Splunk Enterprise Security Suite is extendable by adding a compatible Module App (Adaptive Response Add-ons) for a particular domain or technology. The suite detects configurations in these Adaptive Response Add-ons and helps monitor and take actions on the incidents reported by these Add-ons.
The Illumio Technology Add-On for Splunk is an add-on module for Splunk Enterprise Security Suite. It leverages the Splunk Adaptive Response Framework and empowers system administrators to monitor and take actions on incidents reported by analytics on Illumio PCE events or logs from the Splunk Enterprise Security Suite dashboards.
When using the Splunk Enterprise Security Suite (ES), you can install the Illumio Technology Add-On for Splunk on a single ES Search Head (SH) or on both an ES SH and an associated ES Search Head Cluster (SHC). This allows the Adaptive Response to be invoked from any installed location of the Illumio Technology Add-On for Splunk. The Illumio data is stored on the indexers only, and not on the search head nodes, so the data is not duplicated. If the Illumio Technology Add-On for Splunk is installed on a single ES SH only, the data is normalized for the associated SHC.
The Incident Review dashboard:

As a part of the Adaptive Response Framework, Splunk has enhanced this Incident Review dashboard in the Enterprise Security Suite app, which allows you to take action on notable events.
To view the notable event details, expand the left arrow for the notable event. To execute alert actions manually for each of the notable events, click Run Adaptive Response Actions for the notable event and select the specific Alert Action.


When these actions are run, each selected corresponding action is invoked from alert_actions.conf.
Quarantine Workloads from the Illumio Splunk App
Uninstall the Splunk Integration Apps
To uninstall one of the Illumio Splunk integration apps:
Access the filesystem of the Splunk server where the app is installed.
Navigate to
$SPLUNK_HOME/etc/apps.Remove the app folder and its contents.
Restart Splunk.
Troubleshooting Splunk Integration Apps
Use the information in the following topics to troubleshoot your Splunk integration apps.
Illumio Technology Add-On for Splunk
If you encounter a problem with the TA, check the logs in splunkd.log by running the following search in the UI:
index=_internal sourcetype=splunkd TA-Illumio
Or by searching the log directly from the filesystem:
tail -c100000 $SPLUNK_HOME/var/log/splunk/splunkd.log | grep -i TA-Illumio
If the Illumio input is not running:
Make sure that the python.version value for the server and input are set to python3.
Check that the input interval is not too high.
Make sure that the input is enabled under Settings > Data Inputs > Illumio.
Check the Splunk logs for any issues that could cause modular inputs to fail.
Check that you aren't hitting your Splunk license limits.
Restart Splunk to force the input to run.
Event Forwarding (On-Premises PCE)
If you see a validation error while configuring Event Forwarding using TLS:
Make sure that the CA certificate being used contains the entire CA chain, including the root and any intermediate certificates.
Check that the PCE can resolve the Splunk server using a tool like
nslookupordig.Make sure that the [tcp-ssl] stanza in Splunk is correct and the Splunk server is listening on the specified port. For example, to check that Splunk is listening on port 514:
sudo lsof -i -n -P | grep TCP | grep 514
Verify that the hostname or IP address used for the connection is set as the CN or a SAN in the Splunk server certificate:
openssl x509 -text -noout -in $SPLUNK_HOME/etc/certs/splunk.pem
Test the TLS connection from the PCE to Splunk:
openssl s_client -connect my.splunk.com:8443 -CAPath /path/to/ca/certificates/
Forwarded Events Do Not Show Up In Splunk
Make sure that the index value configured for the Illumio input is correct.
Check that all desired event types are selected in the PCE's Event Forwarding settings.
Check for errors in the
syslog-nglogs in/var/log/messageson the PCE.If TLS is enabled for the connection, make sure that the
[tcp-ssl]and[SSL]stanzas are configured correctly ininputs.conf.Make sure that the TCP input has
sourcetype = illumio:pce.
Data Not in kvstore
If data is not showing up in the illumio_* metadata stores:
If you are using a distributed Splunk environment, make sure to set replicate = true for all collections in
$SPLUNK_HOME/etc/apps/TA-Illumio/local/collections.confto enable replication across all indexers.Check
$SPLUNK_HOME/var/log/splunk/mongodb.logfor any start-up or runtime errors with mongoDB.Call the Splunk API endpoint for the collection to check if objects are being stored.
Check that the
transforms.confstanza for the collection lookup is configured correctly.
Test the PCE Connection
When an Illumio modular input is created, the connection to the PCE is validated, and any connection issues will be presented to the user in the error dialog on the input configuration page. Check splunkd.log for additional error logs. If you can't determine the cause from the logs, try the following:
Use a tool like
nslookupordigfrom the Splunk server to make sure that the PCE host is resolvable and that there is no issue with the DNS nameserver.Use curl or wget to establish an HTTP connection from the Splunk server to the PCE:
curl -L -U "<api_key>:<api_secret>" "https://my.pce.com:8443/api/v2/health"Make sure that the API key used for the connection is valid and has read access to policy objects.
If you are using internal or self-signed certificates, make sure that Splunk is using the correct CA chain.
You can also use the illumio_connection_test.py script to validate the PCE connection from the command line:
> python $SPLUNK_HOME/etc/apps/TA-Illumio/bin/illumio_connection_test.py

Enter PCE hostname: my.pce.com

Enter PCE port: 8443

Enter PCE org ID: 1

Username or API key ID: api_...

Password or API key secret: ...
You can also set these values using the following environment variables:
export ILLUMIO_PCE_HOST=my.pce.com

export ILLUMIO_PCE_PORT=8443

export ILLUMIO_PCE_ORG_ID=1

export ILLUMIO_API_KEY_USERNAME=api_...

export ILLUMIO_API_KEY_SECRET=...
The script output should help to narrow down the cause of the connection failure.
Troubleshooting the Illumio App for Splunk
Make sure that TA-Illumio is installed and configured. Check that events and metadata are being received from the PCE.
If the app dashboards are not being populated:
Check that the illumio_get_index macro has been set and make sure that it points to the correct index.
Make sure that the configured index or indexes contain data within the given time range by running the following search:
`illumio_get_index` | stats count by sourcetype
The results should contain one or more sourcetypes with their respective event counts.
Check if the search time range extends further back than the index retention policy.
Check that you aren't hitting your Splunk license limits.
If the dashboards or visualizations appear to load incorrectly or behave in expected ways:
Try to clear the static cache using your Splunk instance's
https://my.splunk.com/en-us/bumpendpoint.
If the dashboard visualizations are slow to load or searches are delayed:
Try reducing the time range of the search.
Enable acceleration for the Illumio data model (see Data Model Acceleration).
Check if searches are lagging or being delayed because of other jobs or processes running in the background.
Check if the time range your search is being run in accesses cold buckets in your index. If your daily volume is high, you may need to increase the
maxWarmDBCountinindexes.confto delay the roll-over from warm to cold.Increase the compute resources allocated to your Splunk instance or cluster.
Troubleshooting Illumio Technology Add-On for Splunk Version 4.0.2
Check splunkd.log for the logs for kvstore operations.
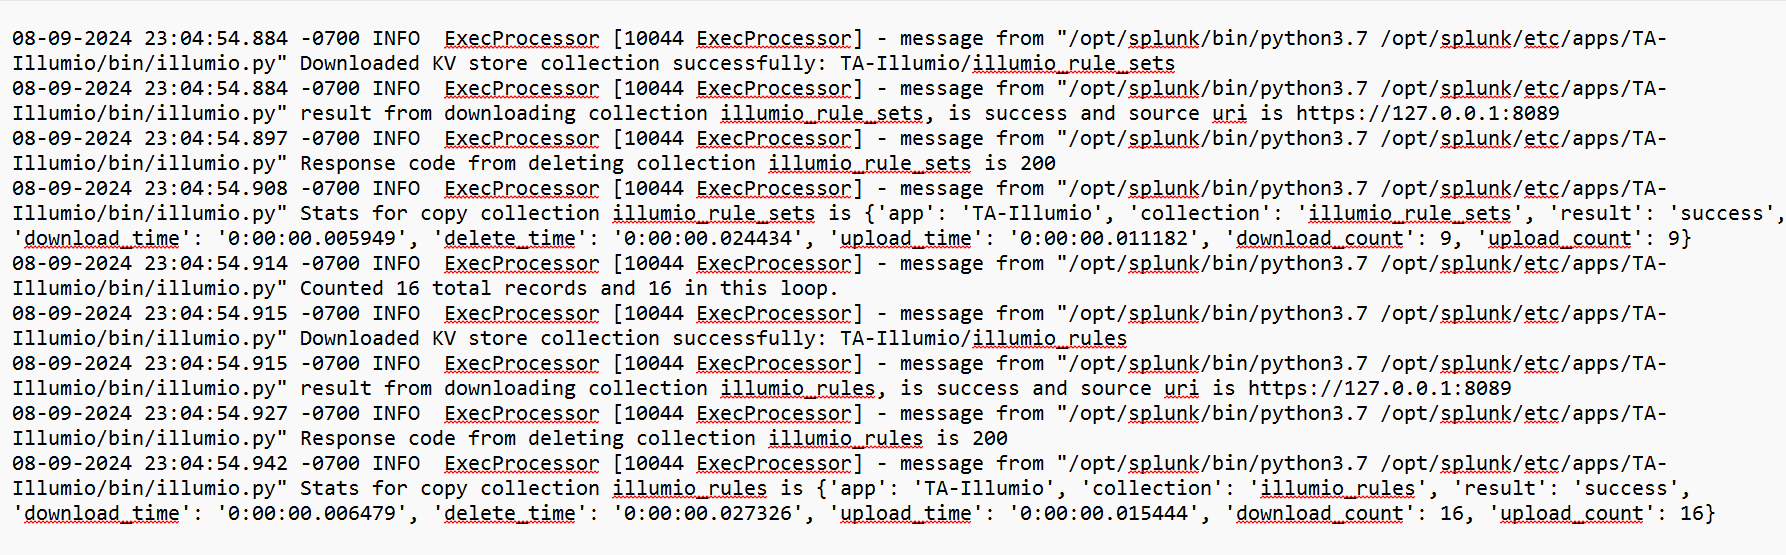
Do the following:
Create a local copy of all collections defined in TA-Illumio.
Delete the collections on remote nodes.
Upload local files to the remote nodes.
If dashboards are not loading as expected and many are empty, on the HF, verify that the lookups contain data using the following command:
| input lookup illumio_labels_lookup
If the results are empty, then verify that the data inputs that were defined using modular input and verify that the HF is able to reach the search head using the credentials that you added in the modular input.
Also verify events coming into Splunk, because sometimes the HF forwards data to the search head but the search head fails to render any dashboards. The HF contains an option to keep a copy of the data that is being forwarded. Select the copy to verify that the data was input.
See splunkd.log to see if uploading or copying kvstore files to the remote nodes is erroring out.

Known Issues and Limitations
The following topics describe known issues for Splunk.
The PCE Operations dashboard will not be populated for SaaS customers because PCE system health information is not available.
Label Group objects are not currently imported by the Illumio TA.
The Illumio TA only supports TCP for Syslog.
Service Account API Keys
Service Account keys have a default expiration of 90 days. Make sure to rotate them before they expire.
For some versions of the PCE (21.5), some API endpoints may return a 403 despite the Service Account key having the necessary permissions. When you see 403 errors in the TA logs, create a new key or use a User-scoped API key instead.
Illumio Supercluster
The
illumio_*metadata collections set thepce_fqdnfield value to be the domain name of the PCE referenced in the input configuration. This could lead to these metadata objects having differentpce_fqdnvalues from the syslog events pushed by individual supercluster members.
Known Issue in TA-Illumio 4.0.2 and Above
The following known issue applies to TA-Illumio 4.0.2 and above.
TA-Illumio 4.0.2 Does Not Pull Data from PCEs with Over 25,000 VEN
Splunk TA v4.0.2 and above does not support pulling metadata from PCEs with more than 25,000 VENs.
The following error occurred in splunkd.log when trying to ingest metadata from a PCE with around 27,000 VENs:
"StateSToreError: 'Batch save to KV store failed with code 400. Error details: Request exceeds API limits - see limits.conf for details. (Batch save size=53468786 too large)' "53 MB greater than the default (50 MB) on max_size_per_batch_save_mb
This occurs because of the default API limits on the Splunk side. See the following article: limits.conf.
To set custom configurations, create a new file called limits.conf in the $SPLUNK_HOME/etc/system/local directory. Then add the specific settings that you want to customize to the local configuration file.
Add the following setting to limits.conf:
[kvstore]
max_size_per_batch_save_mb = 100
The limits.conf file is located here: "$SPLUNK_HOME/etc/system/local".
After you have added the setting, restart the Illumio Technology Add-On.