Illumio App for Splunk 3.2.x
The Illumio App for Splunk integrates with the Illumio Policy Compute Engine (PCE) to provide security and operational insights into your Illumio-secured data center.
The Illumio Technology Add-On for Splunk enriches Illumio Policy Compute Engine (PCE) data with Common Information Model (CIM) field names, event types, and tags. The TA enables Illumio data to be used with Splunk Enterprise Security, Splunk App for PCI Compliance, and other Splunk applications.
What's New in Version 3.2.4
Version | Release Date | Release Notes |
|---|---|---|
3.2.4 | January 13, 2025 |
|
Architecture
The Illumio App for Splunk integrates Splunk with the Illumio Policy Compute Engine (PCE). Using the app, you can conveniently access PCE data through Splunk, and gain security and operational insights into your Illumio-secured data center.
The Technology Add-On for Illumio (TA-Illumio) performs data collection, data normalization, and data visualization using data that comes from the Illumio Policy Compute Engine (PCE) through REST API calls and syslog.
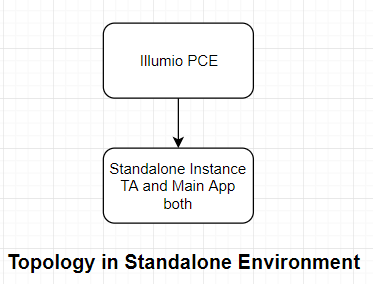
The diagrams in the following topics show a typical data collection architecture from PCE to Splunk in distributed and standalone environments.
Splunk Distributed Environment
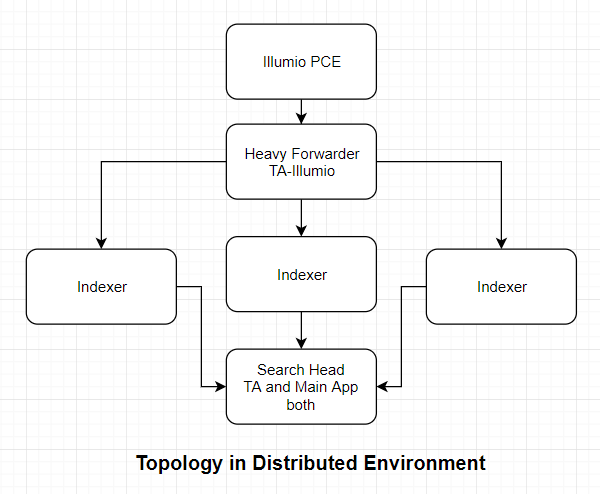
For information about how to install each component in a Splunk distributed environment, see Application of TA-Illumio to Splunk Components.
If you use Splunk Universal Forwarder on a dedicated data collection node, see “Using Splunk Universal Forwarder.
Splunk Standalone Environment
In a standalone environment, the PCE forwards data directly to the Splunk instance. The Splunk Heavy Forwarder is not involved.
Illumio App for Splunk Components
The Illumio App for Splunk comprises two parts:
Illumio Technology Add-On for Splunk (TA-Illumio)
Illumio App for Splunk
The Illumio Technology Add-On for Splunk and the Illumio App for Splunk are typically deployed together in the search head. TA-Illumio receives and transforms data, and enriches events with CIM fields. TA-Illumio can also be deployed at the indexer or forwarder. The Illumio App for Splunk uses the data enriched by TA-Illumio to display informational dashboards.
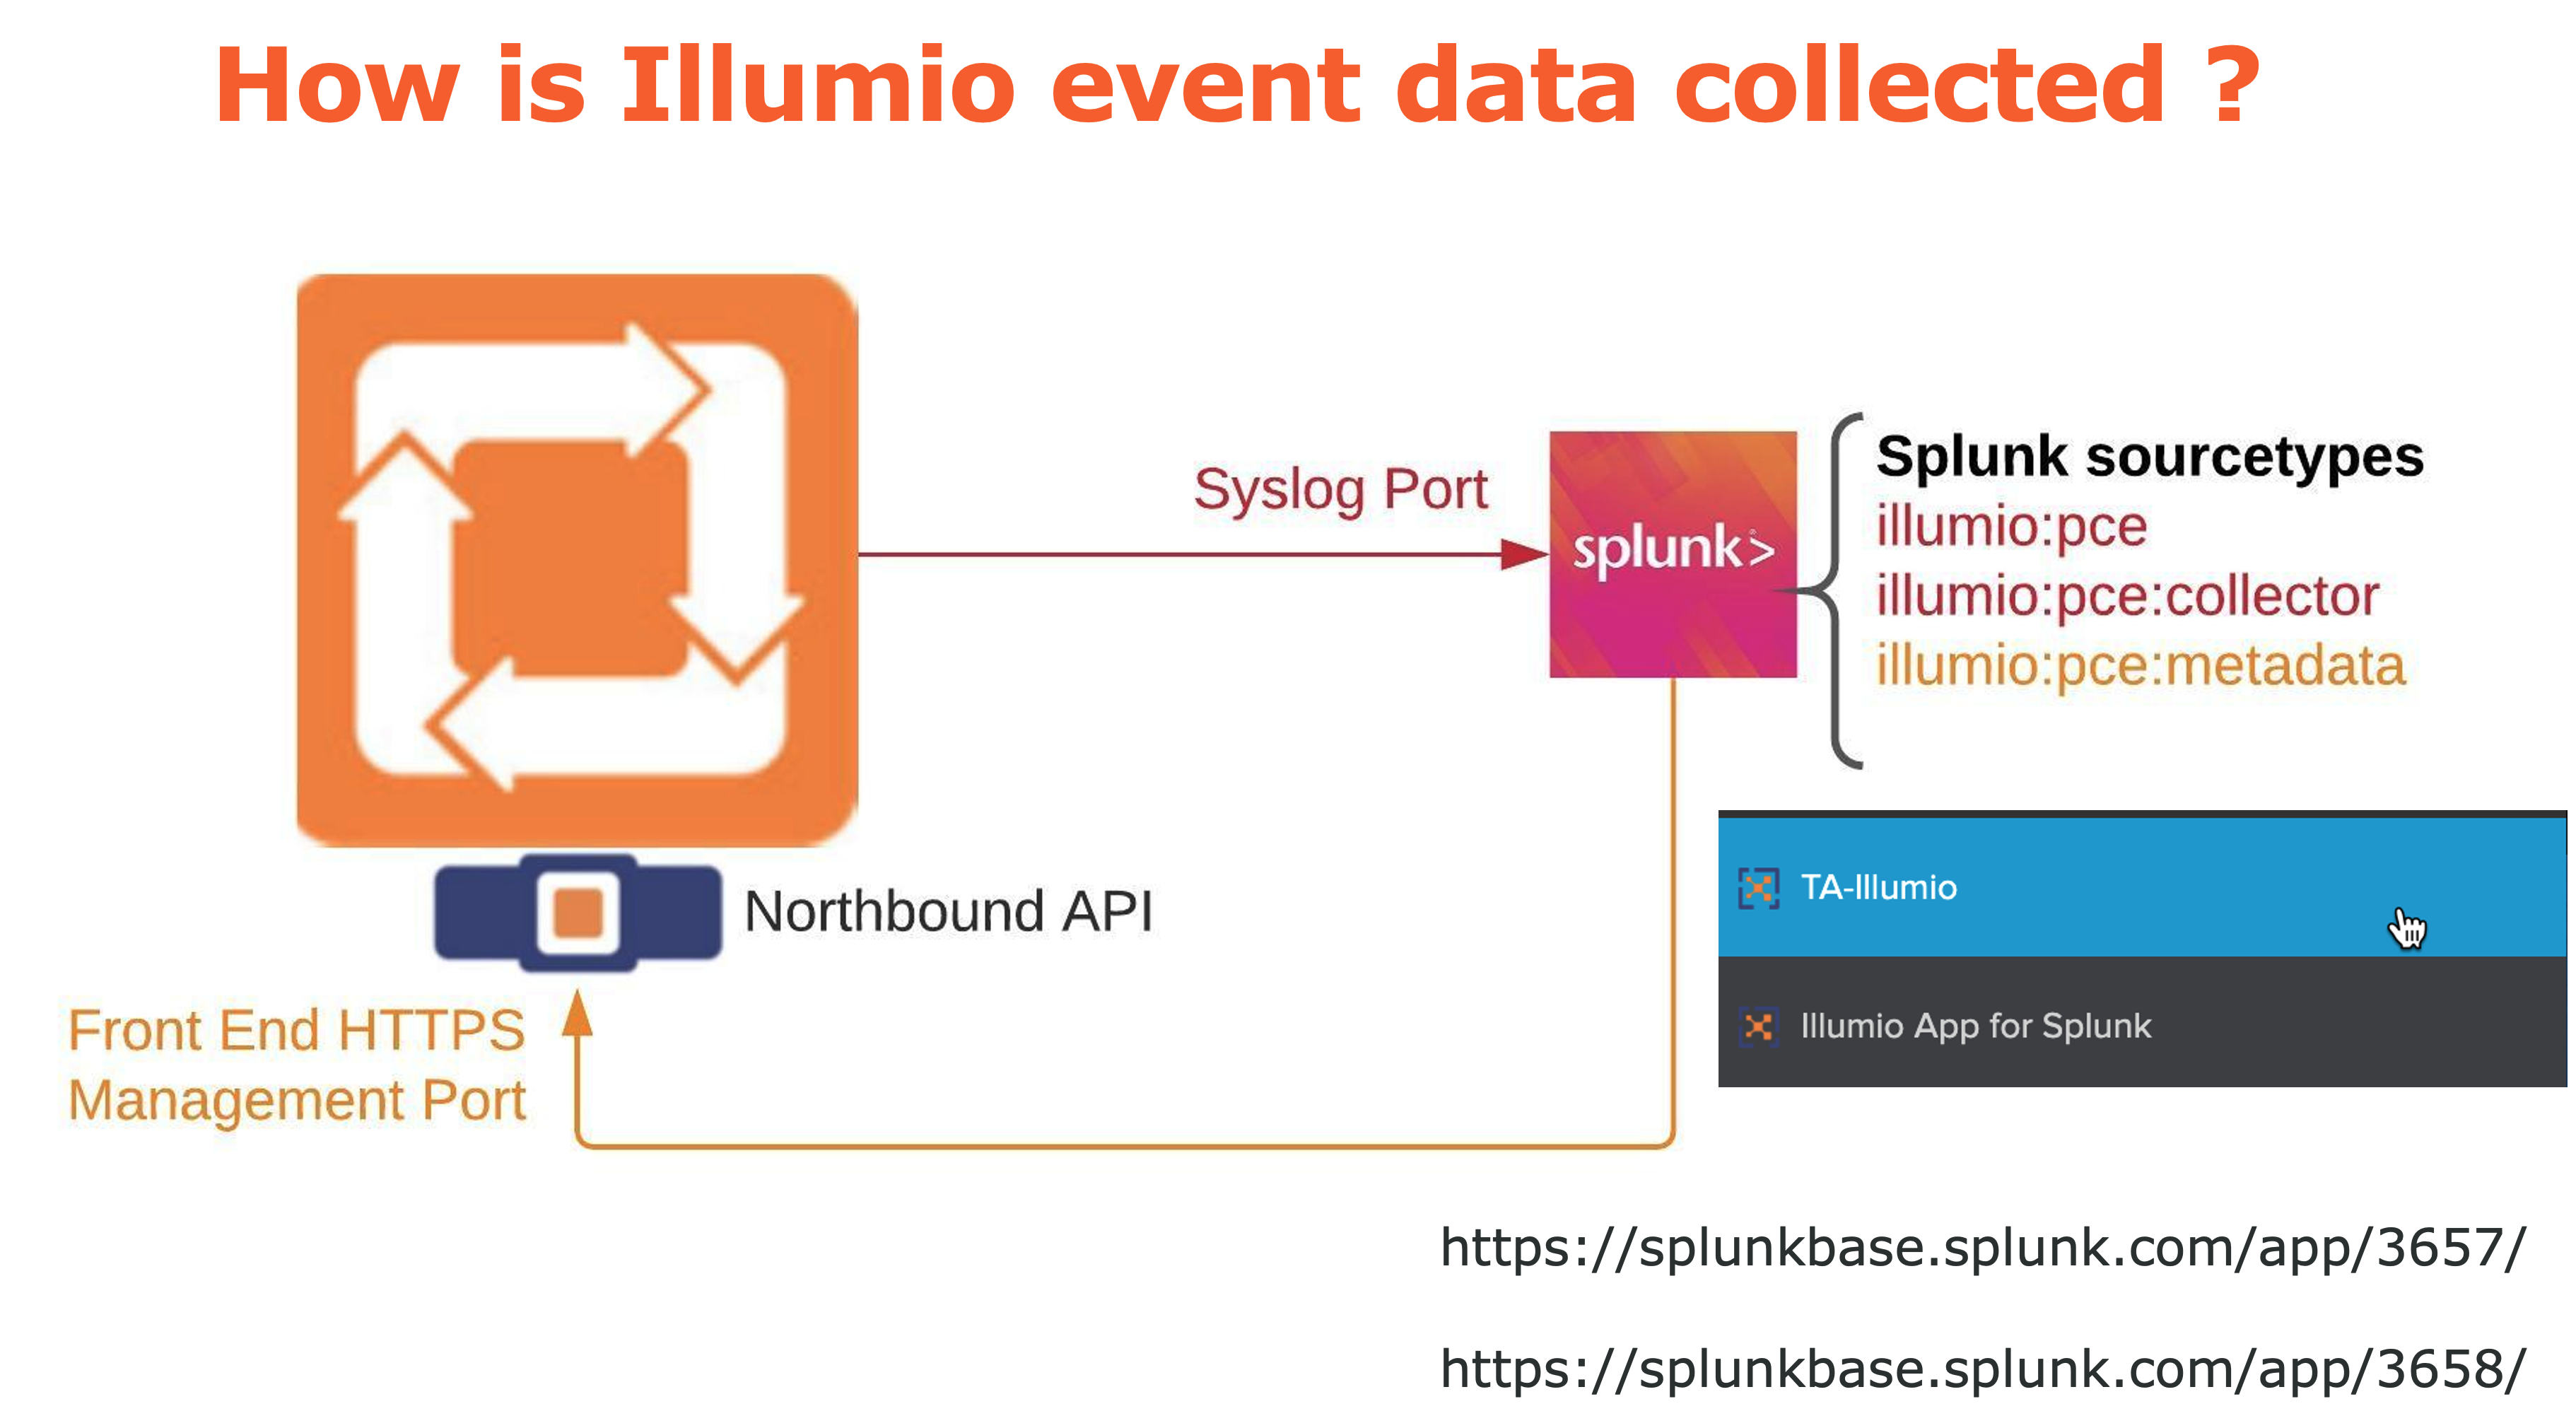
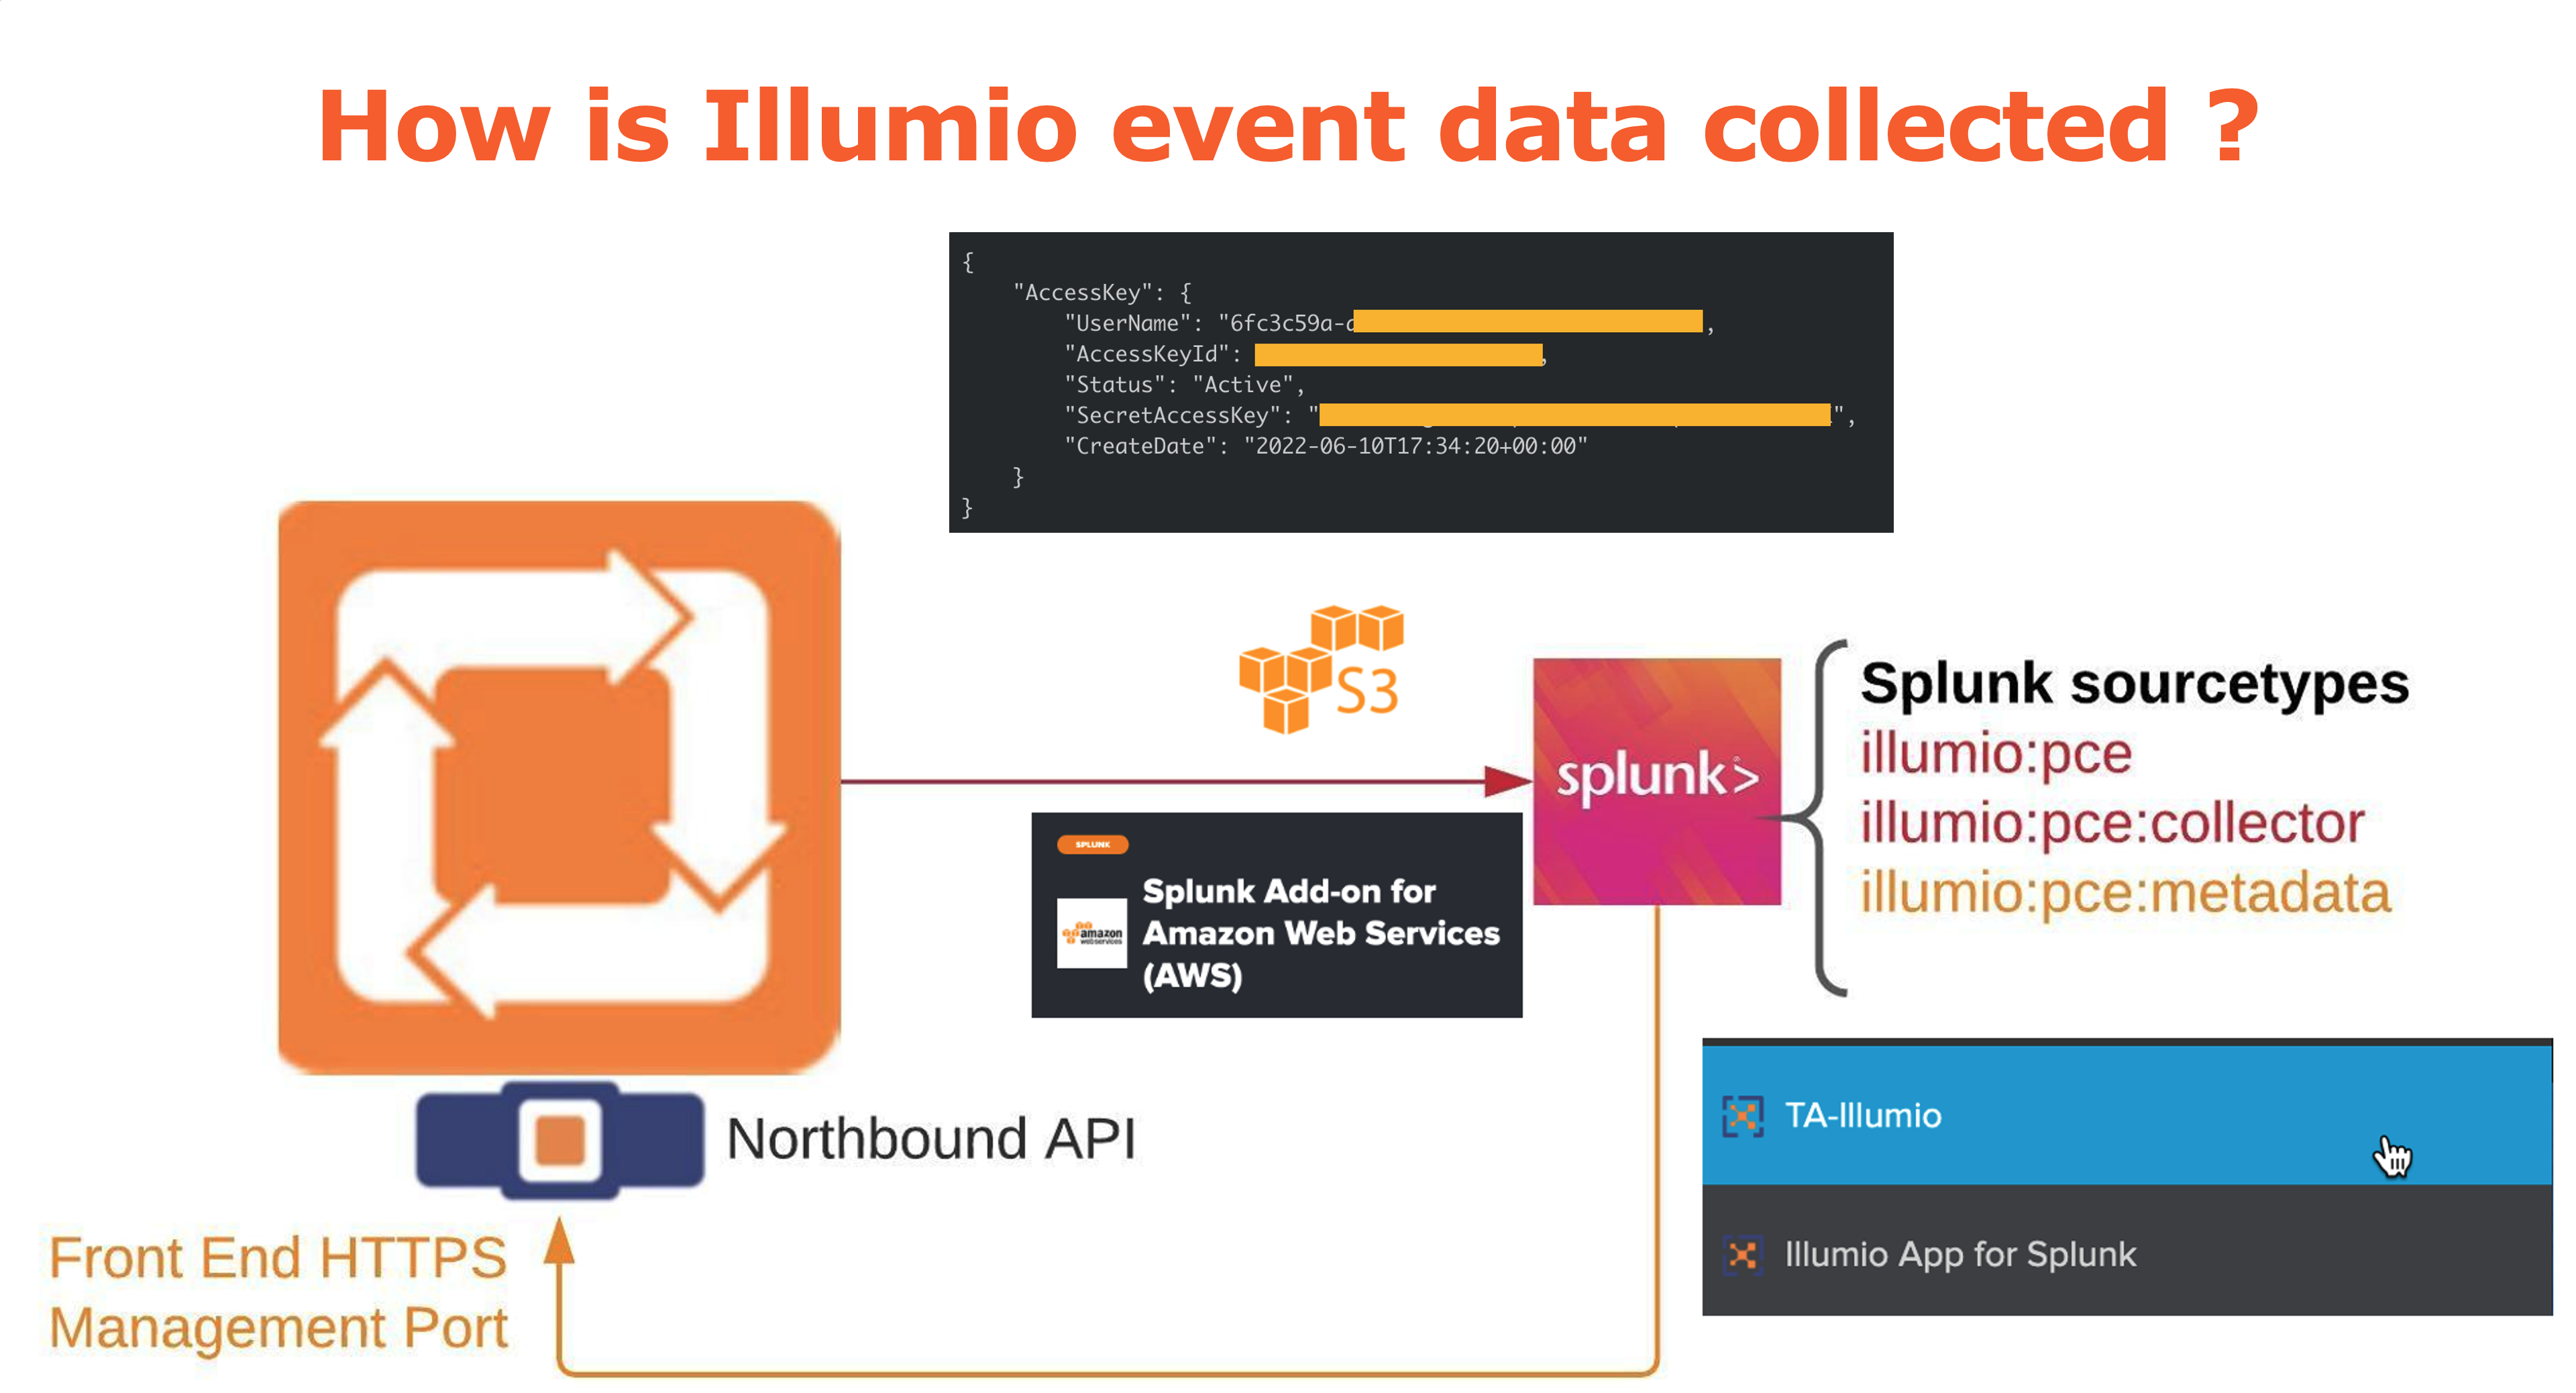
About Illumio Event Data Collection
The following diagram describes how Illumio event data is collected for On-Premises deployments:
 |
The following diagram describes how Illumio event data is collected for Cloud deployments:
 |
The following diagram describes how often Illumio event data is collected and is then available for search:
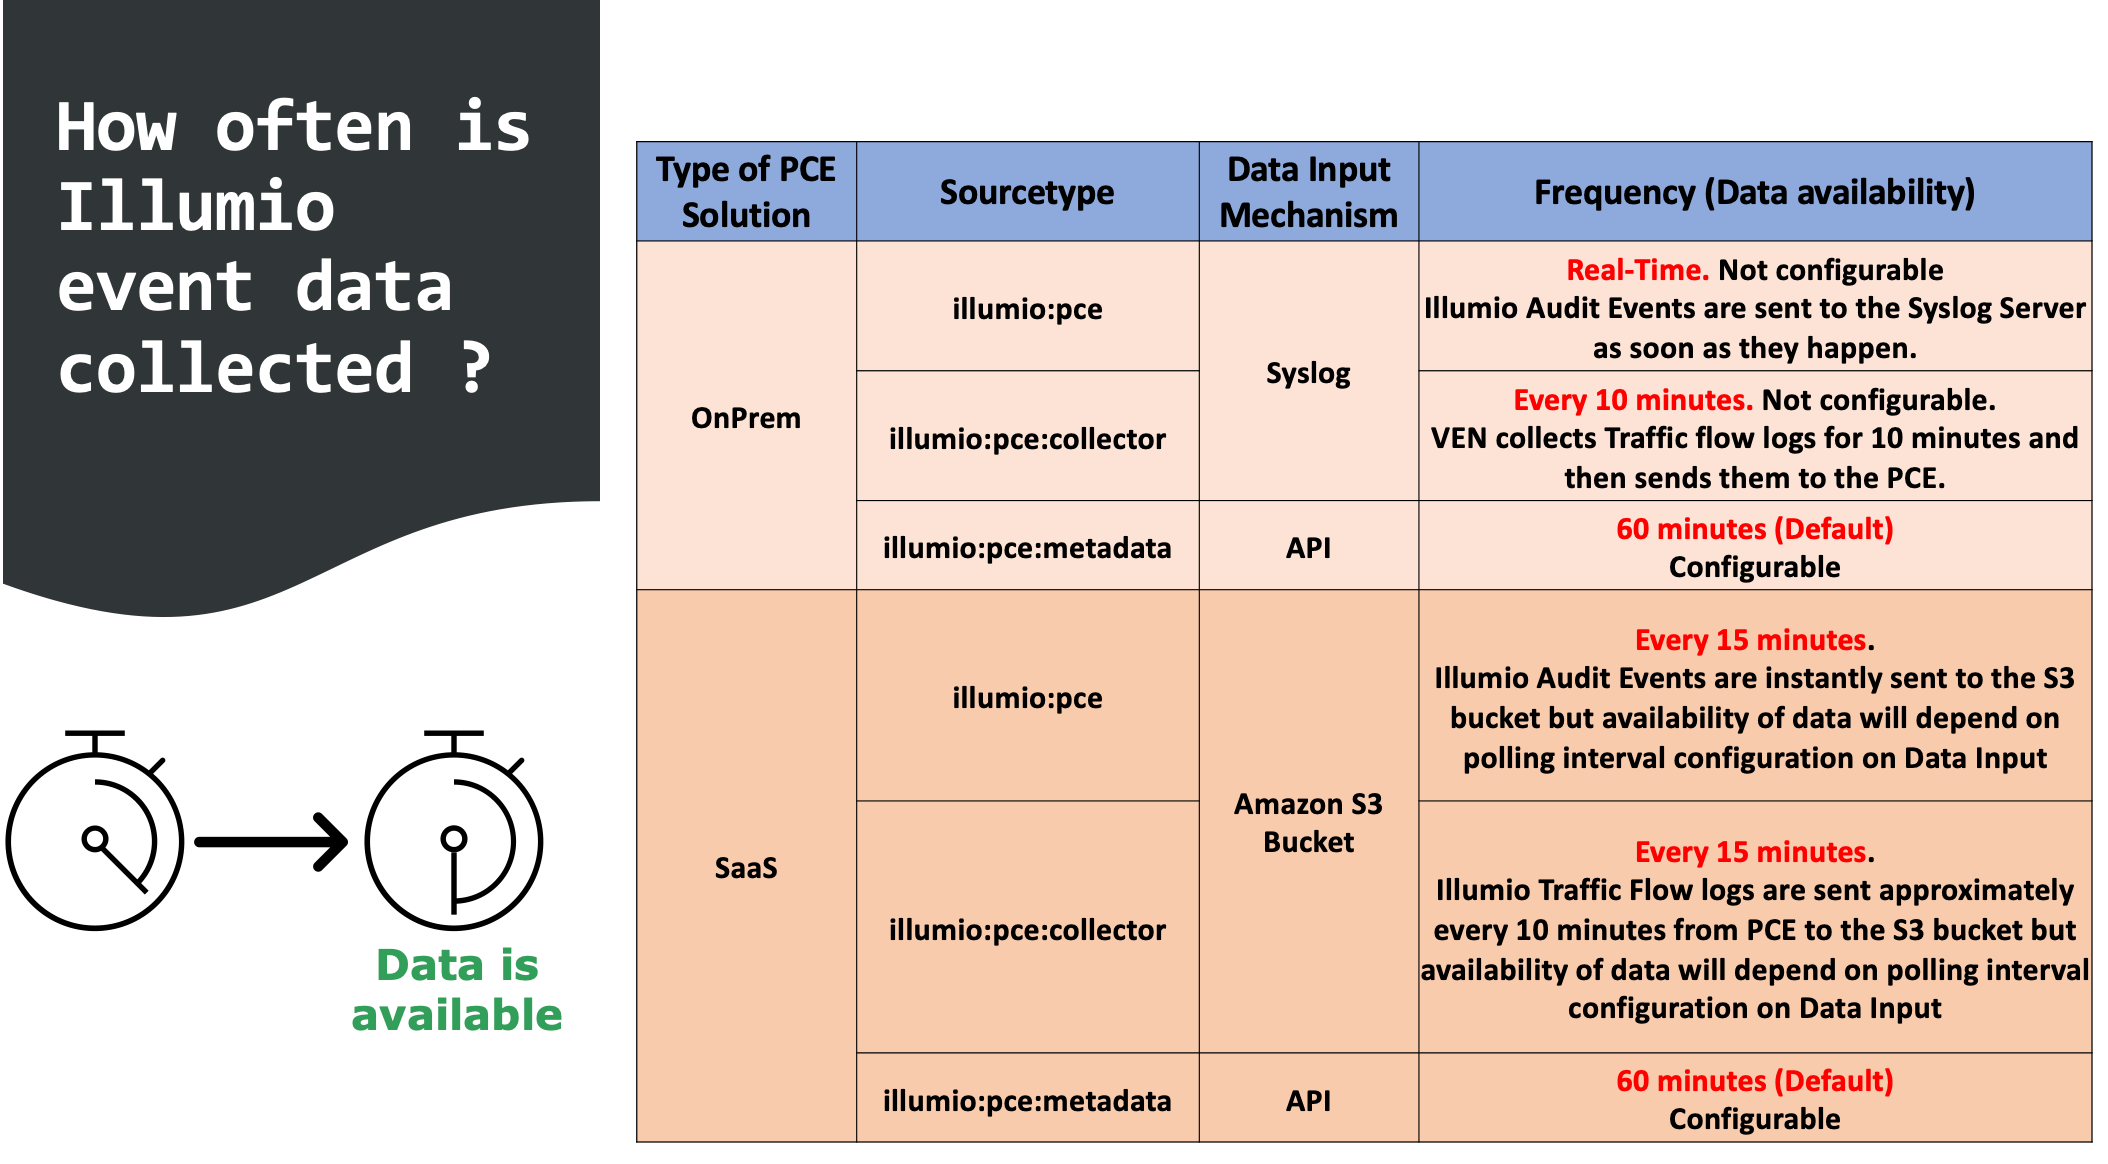 |
About the Illumio Technology Add-On for Splunk (TA-Illumio)
The Illumio Technology Add-On for Splunk (TA-Illumio) is a Splunk module that receives PCE data for Splunk and performs data normalization. TA-Illumio collects data from the PCE and enriches the data according to the Common Informational Model (CIM). CIM is the native data representation used by Splunk. Illumio data in CIM format can be used easily with Splunk applications such as Splunk Enterprise Security and Splunk App for PCI Compliance.
Data collection from the PCE is accomplished in two ways: through the Illumio ASP REST API and the Illumio PCE syslog.
The Adaptive Response Framework components that are used by Splunk Enterprise Security Suite are packaged with TA-Illumio.
Illumio ASP REST API
TA-Illumio pulls data using the Illumio ASP REST API. For data collection to work, you must set up the API configuration in TA-Illumio to use Data Input, also known as modular input. Data collected from API calls is used to create metadata for workloads, labels, and services. The API data is used to enrich syslog data, such as traffic flow summaries and auditable events.
The following Illumio ASP REST API endpoints are called:
GET /api/v2/orgs/1/workloads/
GET /api/v2/orgs/1/labels/
GET /api/v2/orgs/1/health/
GET /api/v2/product_version
GET /api/v2/orgs/1/sec_policy/draft/ip_lists
GET /api/v2/orgs/1/sec_policy/draft/services
Illumio PCE Syslog
TA-Illumio receives and processes messages directly from the PCE using the TCP configured in Data Input (modular input). The types of messages are:
Events, which are structured JSON messages that represent auditing information.
Traffic flow summaries, which are structured JSON messages that represent enriched traffic flows. Traffic flow summaries contain flows, Illumio labels, and other data about the flow.
PCE System Health messages in syslog format (key-value pairs).
Other syslog messages.
Splunk Index, Source, and Source Types
Index and source type are default Splunk fields used to categorize and filter the indexed data to narrow down search results.
Indexes
In Splunk, raw syslog data is stored in indexes, classified by source type. With TA-Illumio, you can select an index while creating Data Input (modular input). Data collected from that modular input will be collected into the selected index.
If you choose the default index in Data Input, you do not need to perform any further configuration.
If you choose a non-default index, you must also update the search macros as follows to use the custom index. Otherwise, the dashboards will not display charts.
Use the following procedure to modify the search macro:
In Settings > Advanced Search > Search Macros > App: Illumio App for Splunk, select Illumio_get_index.
In Definition, do one of the following:
If you use the default index, enter open and close parentheses: ()
If you have created a custom index, enter the name of your index in parentheses:
(index=custom_index_name)

Source Type
The following table shows how Illumio data is classified by source types.
Source Type | Description |
|---|---|
illumio:pce | Events collected from the Illumio PCE through syslog. |
illumio:pce:metadata | Workloads, labels, iplists, and services collected from the PCE using REST API calls. |
illumio:pce:collector | Traffic flow summaries collected from the Illumio PCE through syslog. Note that the time stamp for traffic flow summaries is the stamp in the message itself and is not the time when the message is received by the PCE or relayed to Splunk. Effectively, the timestamp of traffic flow summaries is the time when the traffic actually occurred. |
Field Extractions
TA-Illumio extracts fields from various source types using regular expressions.
Data Model and Data Model Acceleration
The app consists of one data model named "Illumio". The data model used in this application is not accelerated by default. If you want to improve the responsiveness of the dashboards, you should enable data model acceleration with a 1-week period. Accelerated data models help improve the performance of the dashboard, but also increase the disk usage on the indexer node.
To enable acceleration:
On the Splunk menu bar, click Settings > Data models.
From the list of data models, click Edit in the Action column of the row for the Illumio data model.
From the list of actions, select Edit Acceleration.
Check the Accelerate checkbox to enable data model acceleration.
Select the summary range and specify an acceleration period of 1 week.
Click Save.
If you don’t need to use the already indexed accelerated data model, the data model can be configured to rebuild from scratch for the specified acceleration period.
To rebuild the data model:
On the Splunk menu bar, click Settings > Data models.
From the list for Data models, expand the Illumio row by clicking the > arrow in the first column.
From the Acceleration section, click Rebuild.
Monitor the status of the rebuild in the Status field of the Acceleration section. Reload the page to get the latest rebuild status.
CIM Mapping
PCE events are mapped to multiple Common Information Model (CIM) data models as shown in the following table.
Event Type | CIM Data Model | CIM Field | Illumio Field |
|---|---|---|---|
sourcetype="illumio:pce" category = "auditable" event_type="user.sign_in" OR event_type="user.login" | Authentication | src | src_ip |
user | created_by.user.username | ||
app | "Illumio" | ||
action | "failure" OR "success" | ||
sourcetype="illumio:pce" category = "auditable" event_type="agent.tampering" OR event_type="agent.firewall_config" | Network Changes | action | "modified" |
status | status | ||
vendor_product | "illumio:pce" | ||
change_type | change_type | ||
src | src_ip | ||
user | created_by.user.username | ||
sourcetype="illumio:pce" category = "auditable" (event_type="*.create" OR event_type="*.delete" OR event_type="*.update") (event_type!="user.*") | Auditing Changes | action | "created" OR "deleted" OR "modified" |
src | src_ip | ||
status | status | ||
vendor_product | "illumio:pce" | ||
user | created_by.user.username | ||
change_type | change_type | ||
sourcetype="illumio:pce" category = "auditable" event_type="user.create" OR event_type="user.update" OR event_type="user.delete" | Account Management Changes | action | "created" OR "deleted" OR "modified" |
src | src_ip | ||
status | status | ||
vendor_product | "illumio:pce" | ||
src_user | created_by.user.username | ||
change_type | change_type | ||
user | resources_changes.resource.username | ||
sourcetype="illumio:pce:collector" | Network Traffic | action | pd |
bytes | tbi + tbo | ||
bytes_in | tbi | ||
bytes_out | tbo | ||
dest | dst_ip | ||
dest_ip | dst_ip | ||
dest_port | dst_port | ||
src | src_ip | ||
protocol | proto |
About the Illumio App for Splunk
The Illumio App for Splunk integrates Splunk with the Illumio PCE to provide security and operational insights into your Illumio-secured data center. Multiple dashboards display an overview of your data center while monitoring the PCE and Illumio Virtual Enforcement Nodes (VENs) installed in your data center.
With improved visibility of east-west traffic, your Security Operations Center (SOC) staff can detect unauthorized activity and potential attacks from traffic blocked by Illumio segmentation policies on workloads in the "Enforced" policy state (policy is enforced). Additionally, the Illumio App for Splunk provides visibility into potentially blocked traffic for workloads in the "Test" policy state (policy is visualized but not enforced). This enables SOC staff to quickly pinpoint potential attacks and remedy those situations.
Dashboards
The Illumio App for Splunk has multiple dashboards to display system activities associated with the PCE instance. You can access the following dashboards from the top row of the app:
Security Operations Dashboard
PCE Operations (On-Prem Only) Dashboard
PCE Authentication Events Dashboard
Workload Operations Dashboard
Workload Investigation Dashboard
Traffic Explorer Dashboard
Alert Configuration Page
Change Monitoring Dashboard
Alerts Page
Security Operations Dashboard
The Security Operations dashboard provides an overview that allows Splunk administrators to monitor the overall security state of the network, as determined from traffic flows reported by PCE instances. Top Blocked, Potentially Blocked, and Allowed traffic is displayed by host and by service. To see Allowed traffic, choose it in the drop-down list under Top Workloads With or Top Services With. In most panels, you can filter flows using Illumio labels. You can also drill down to investigate notable events, such as Port Scans and Firewall Tampering.
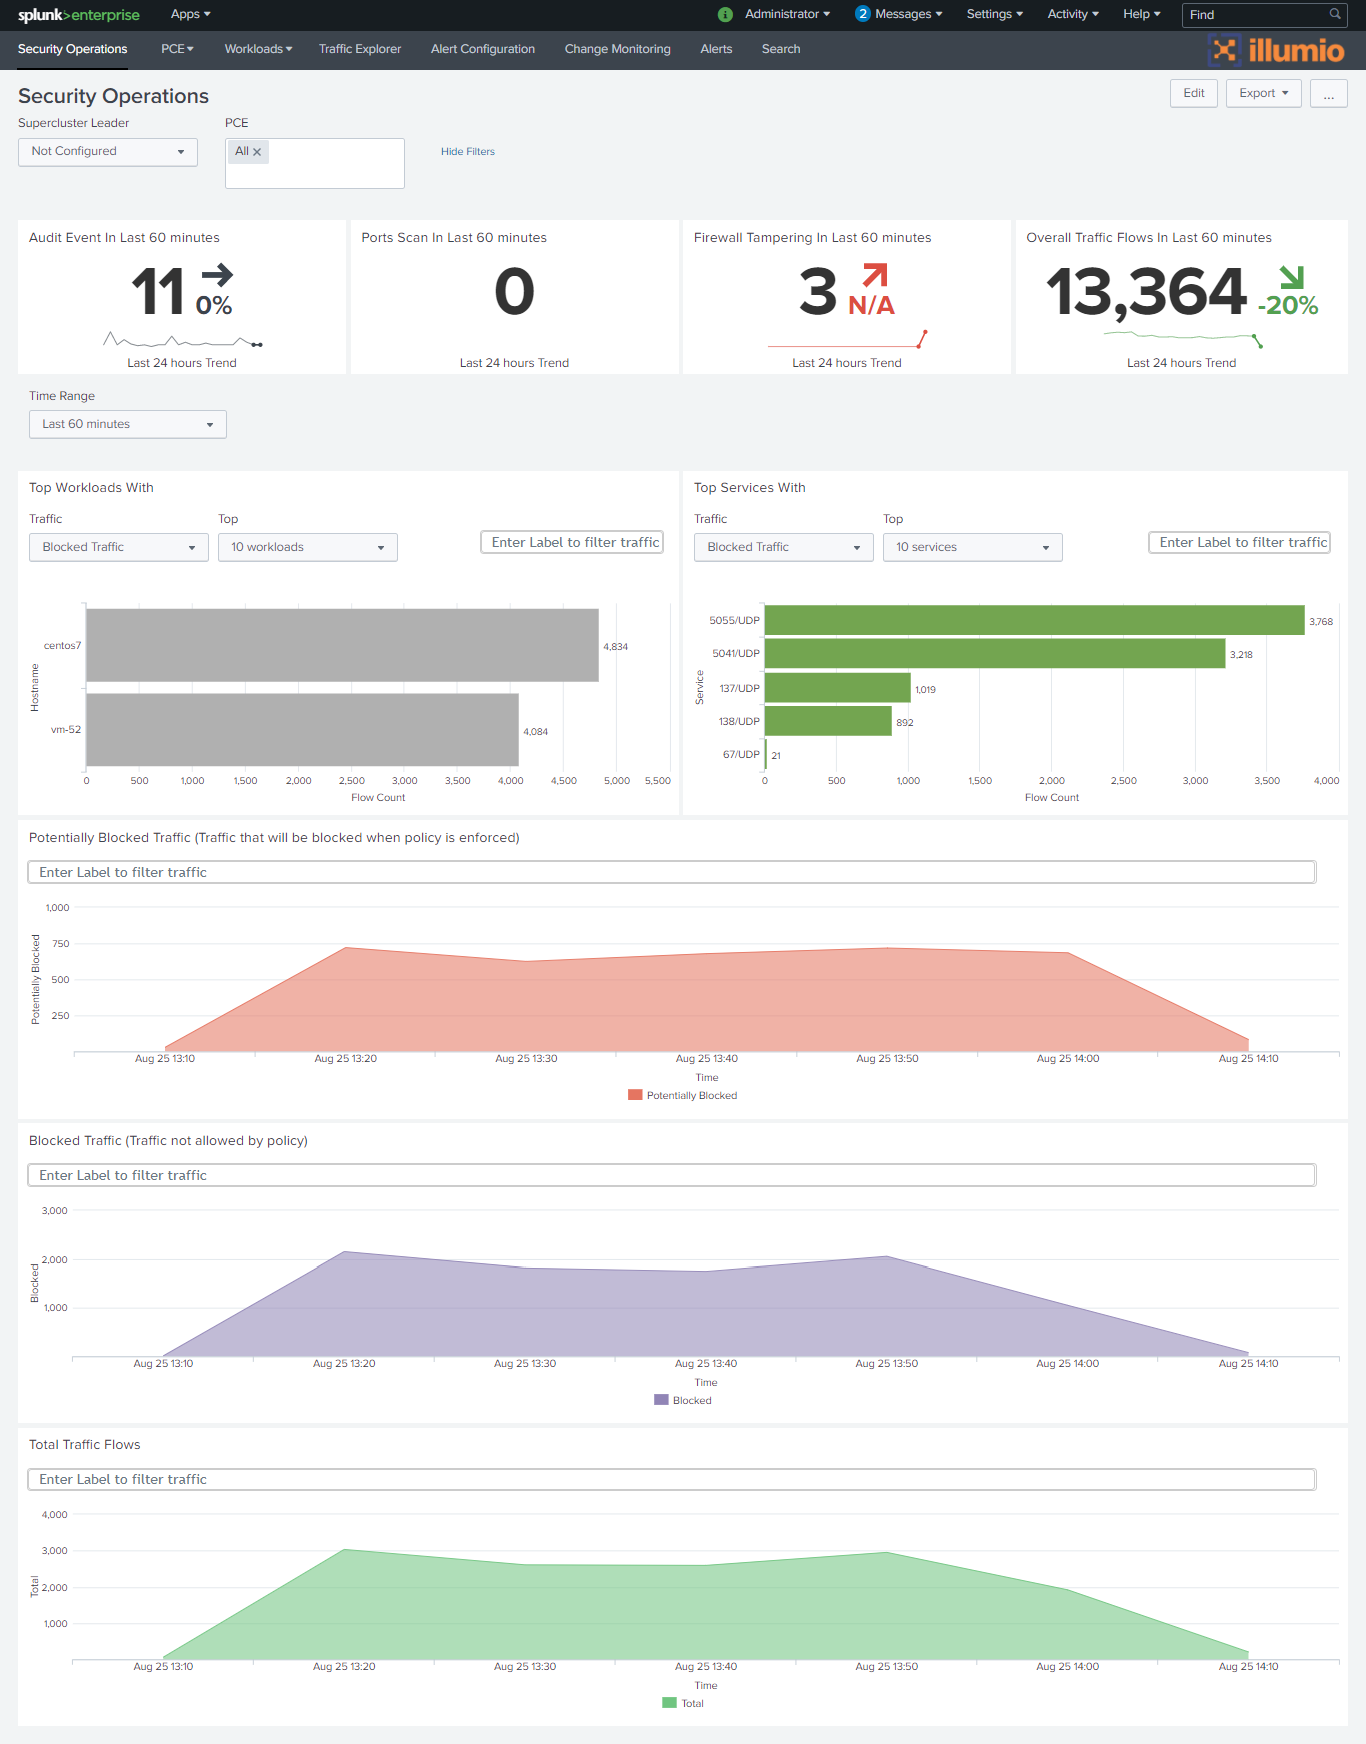 |
The Security Operations dashboard is built using data from the following sources:
Traffic flow summaries
REST API calls made to the PCE
Events
Investigate Workload from Illumio Splunk App
When you are viewing a list of workloads, such as through the Port Scan or Firewall Tampering screens, you can click Investigate to view the Workload Investigation dashboard for the selected workload. See Workload Investigation Dashboard.
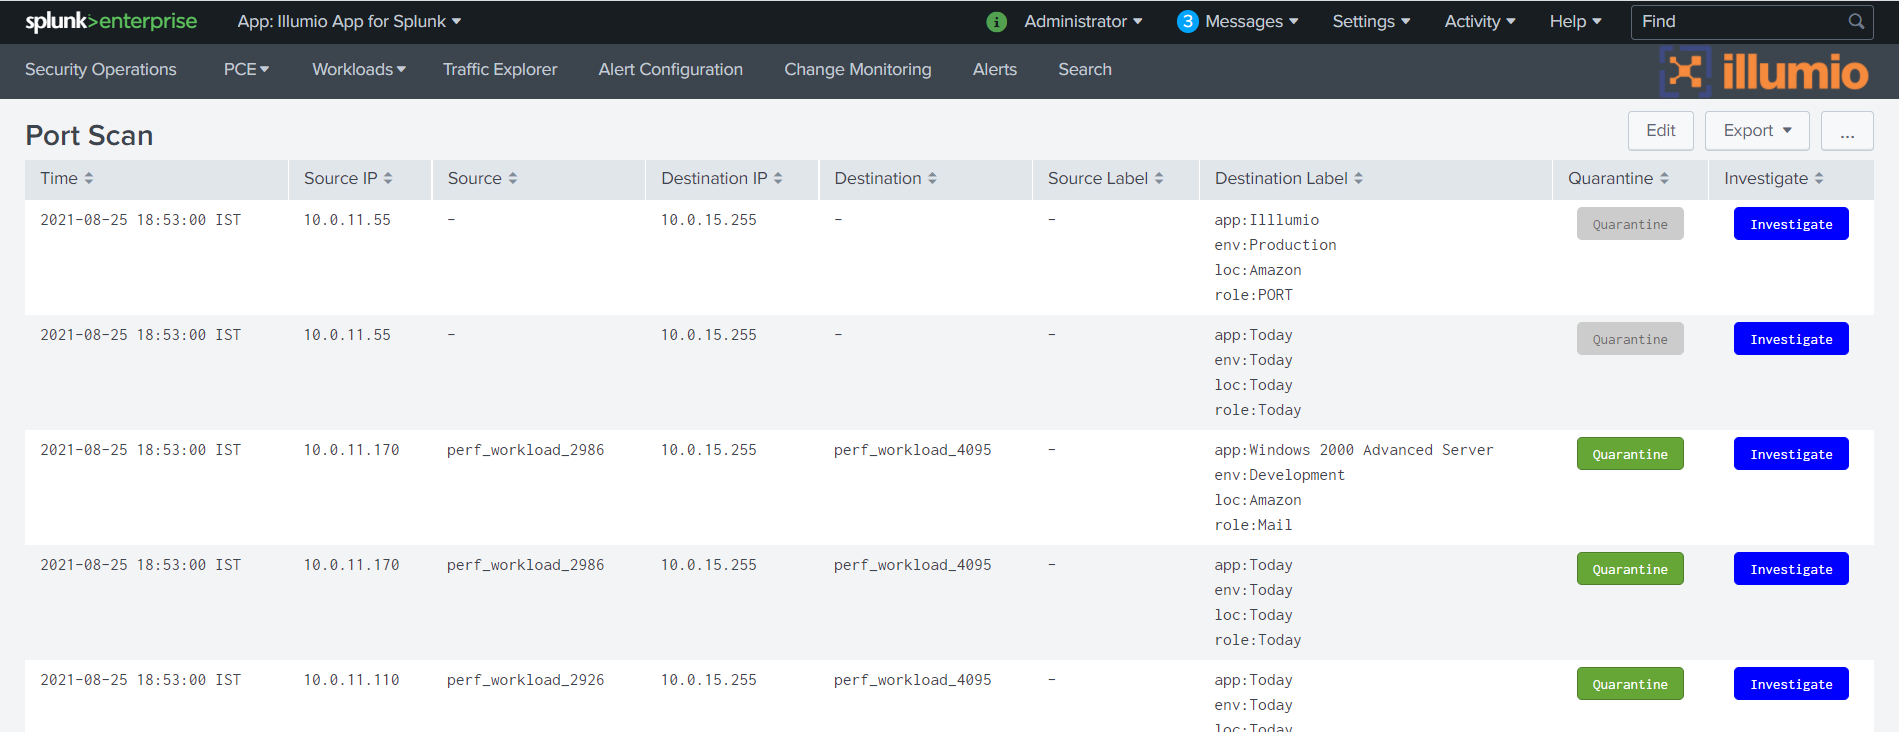
Depending on the results of the investigation, you might want to quarantine the workload. To quarantine a workload, click on the Security Operations dashboard and drill down on the panels.
PCE Operations Dashboard
Note
The PCE Operations dashboard is only available for on-premises deployments.
The PCE Operations dashboard enables Splunk administrators to monitor the health of multiple on-premises PCE instances from one Splunk server. This includes the overall PCE cluster status, service status summary, per-node service status, CPU, Memory and Disk utilization metrics. If multiple PCE instances are connected to Splunk, you can use the drop-down list at the top of the dashboard to choose which PCE to monitor.
The PCE Operations dashboard is built using data from the following source:
REST API calls made to the PCE (PCE 17.2 and later)
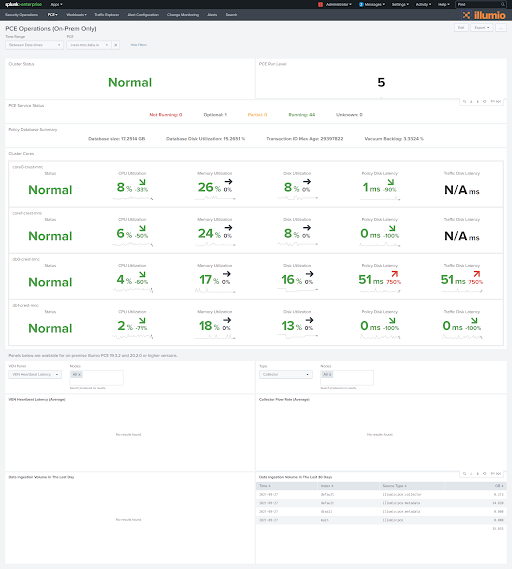 |
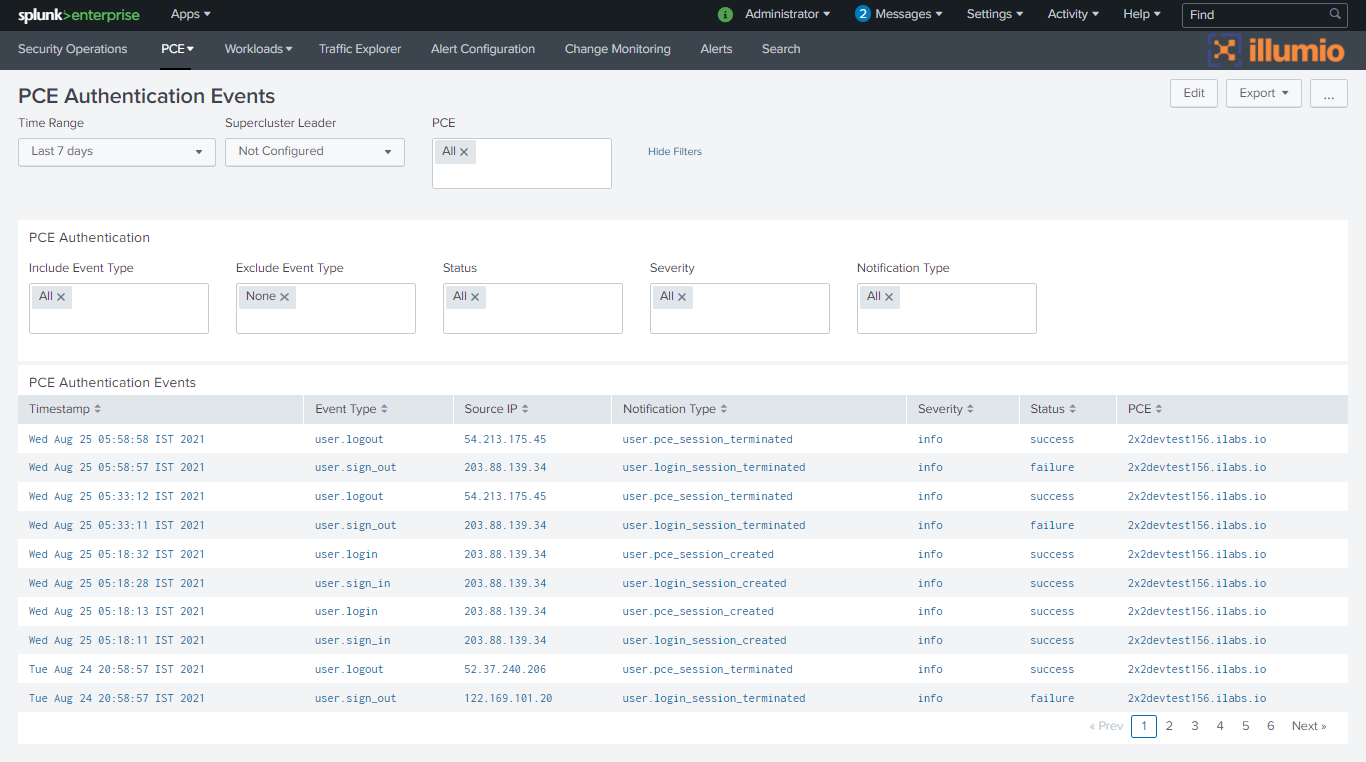
PCE Authentication Events Dashboard
The PCE Authentication Events dashboard enables you to search for and filter types of user authentication data.
 |
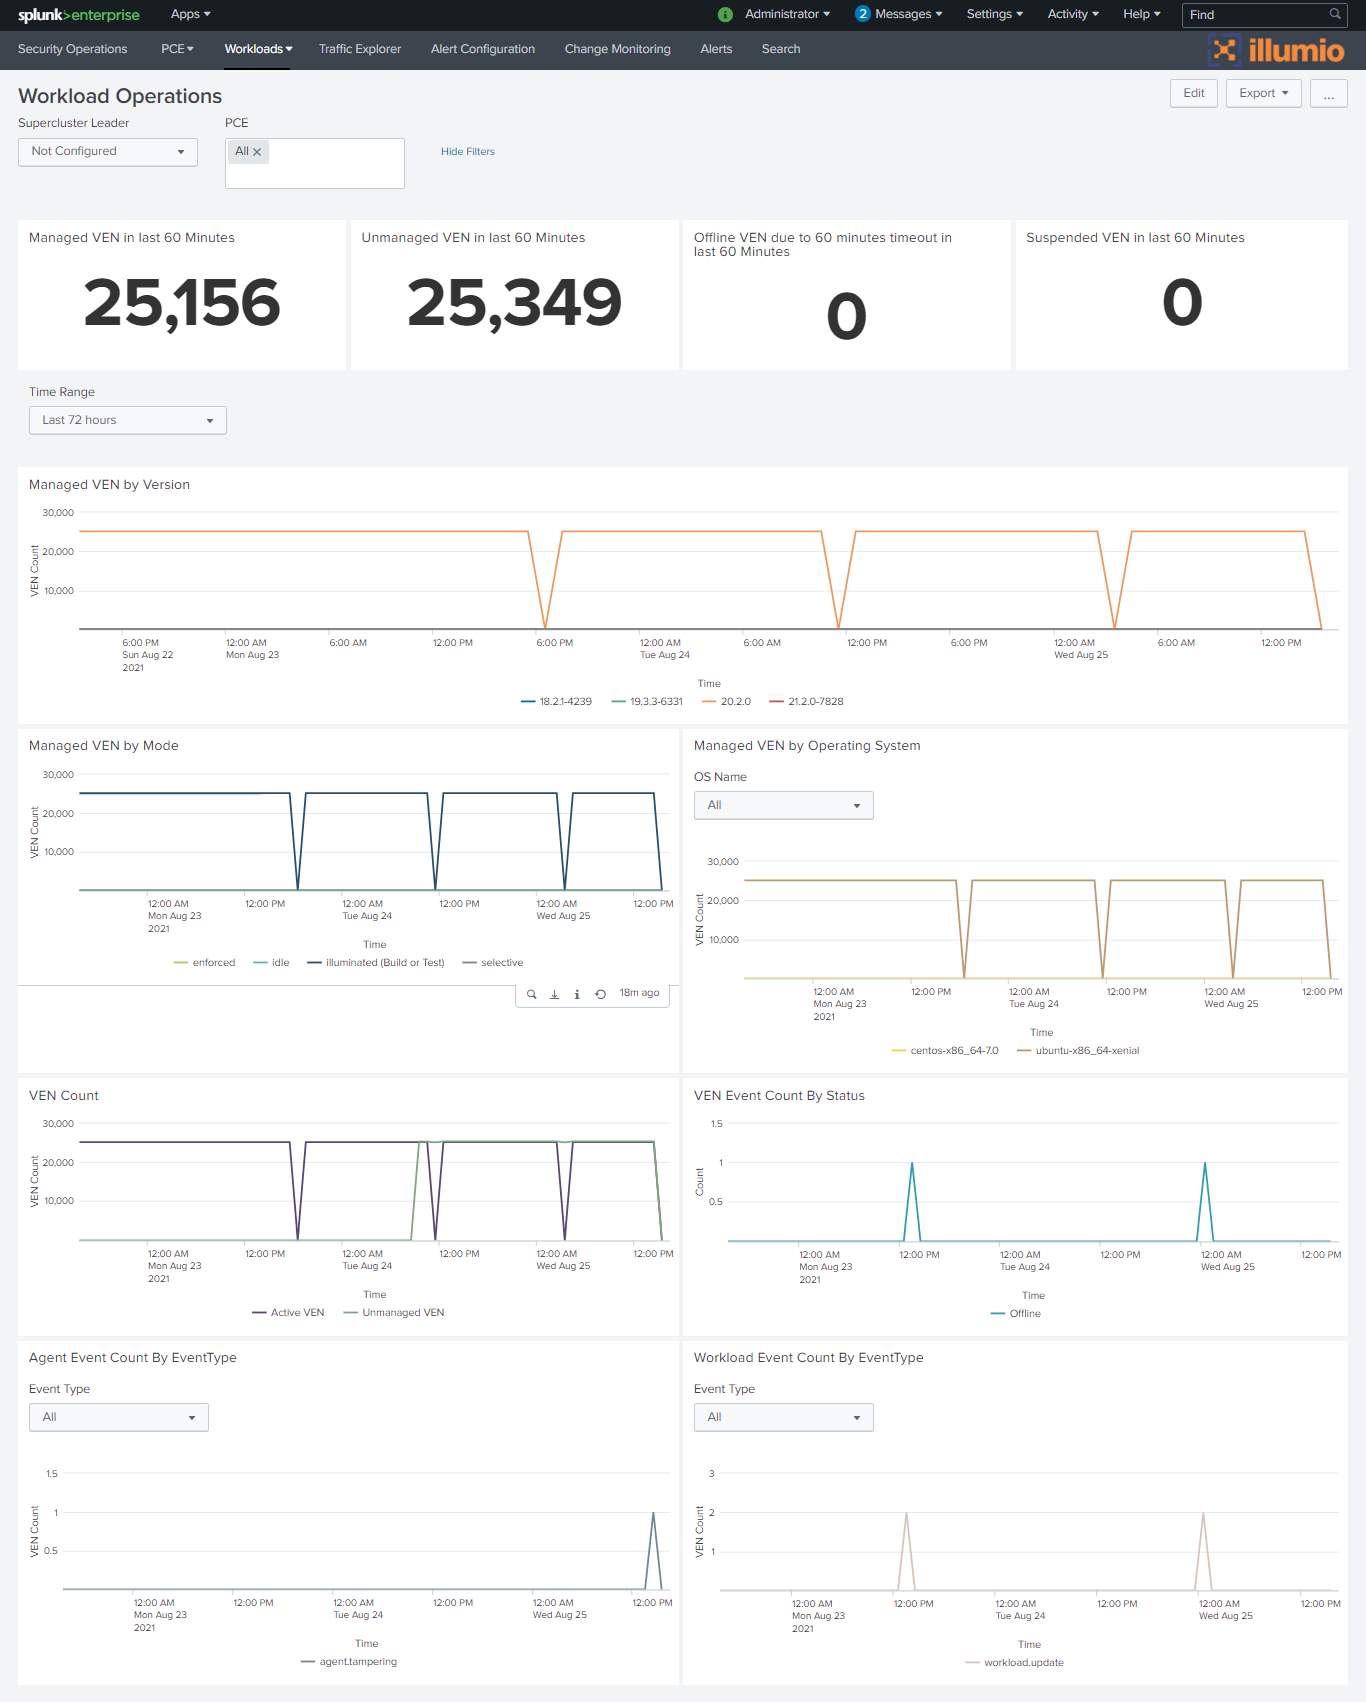
Workload Operations Dashboard
The Workload Operations dashboard enables you to monitor the Workloads managed by the PCE instances. The dashboard displays VEN deployment statistics and VEN-reported events. If multiple PCE instances are connected to Splunk, you can use the drop-down list at the top of the dashboard to choose which PCE to monitor.
The Workload Operations dashboard is built using data from the following sources:
REST API calls made to the PCE
Events
 |
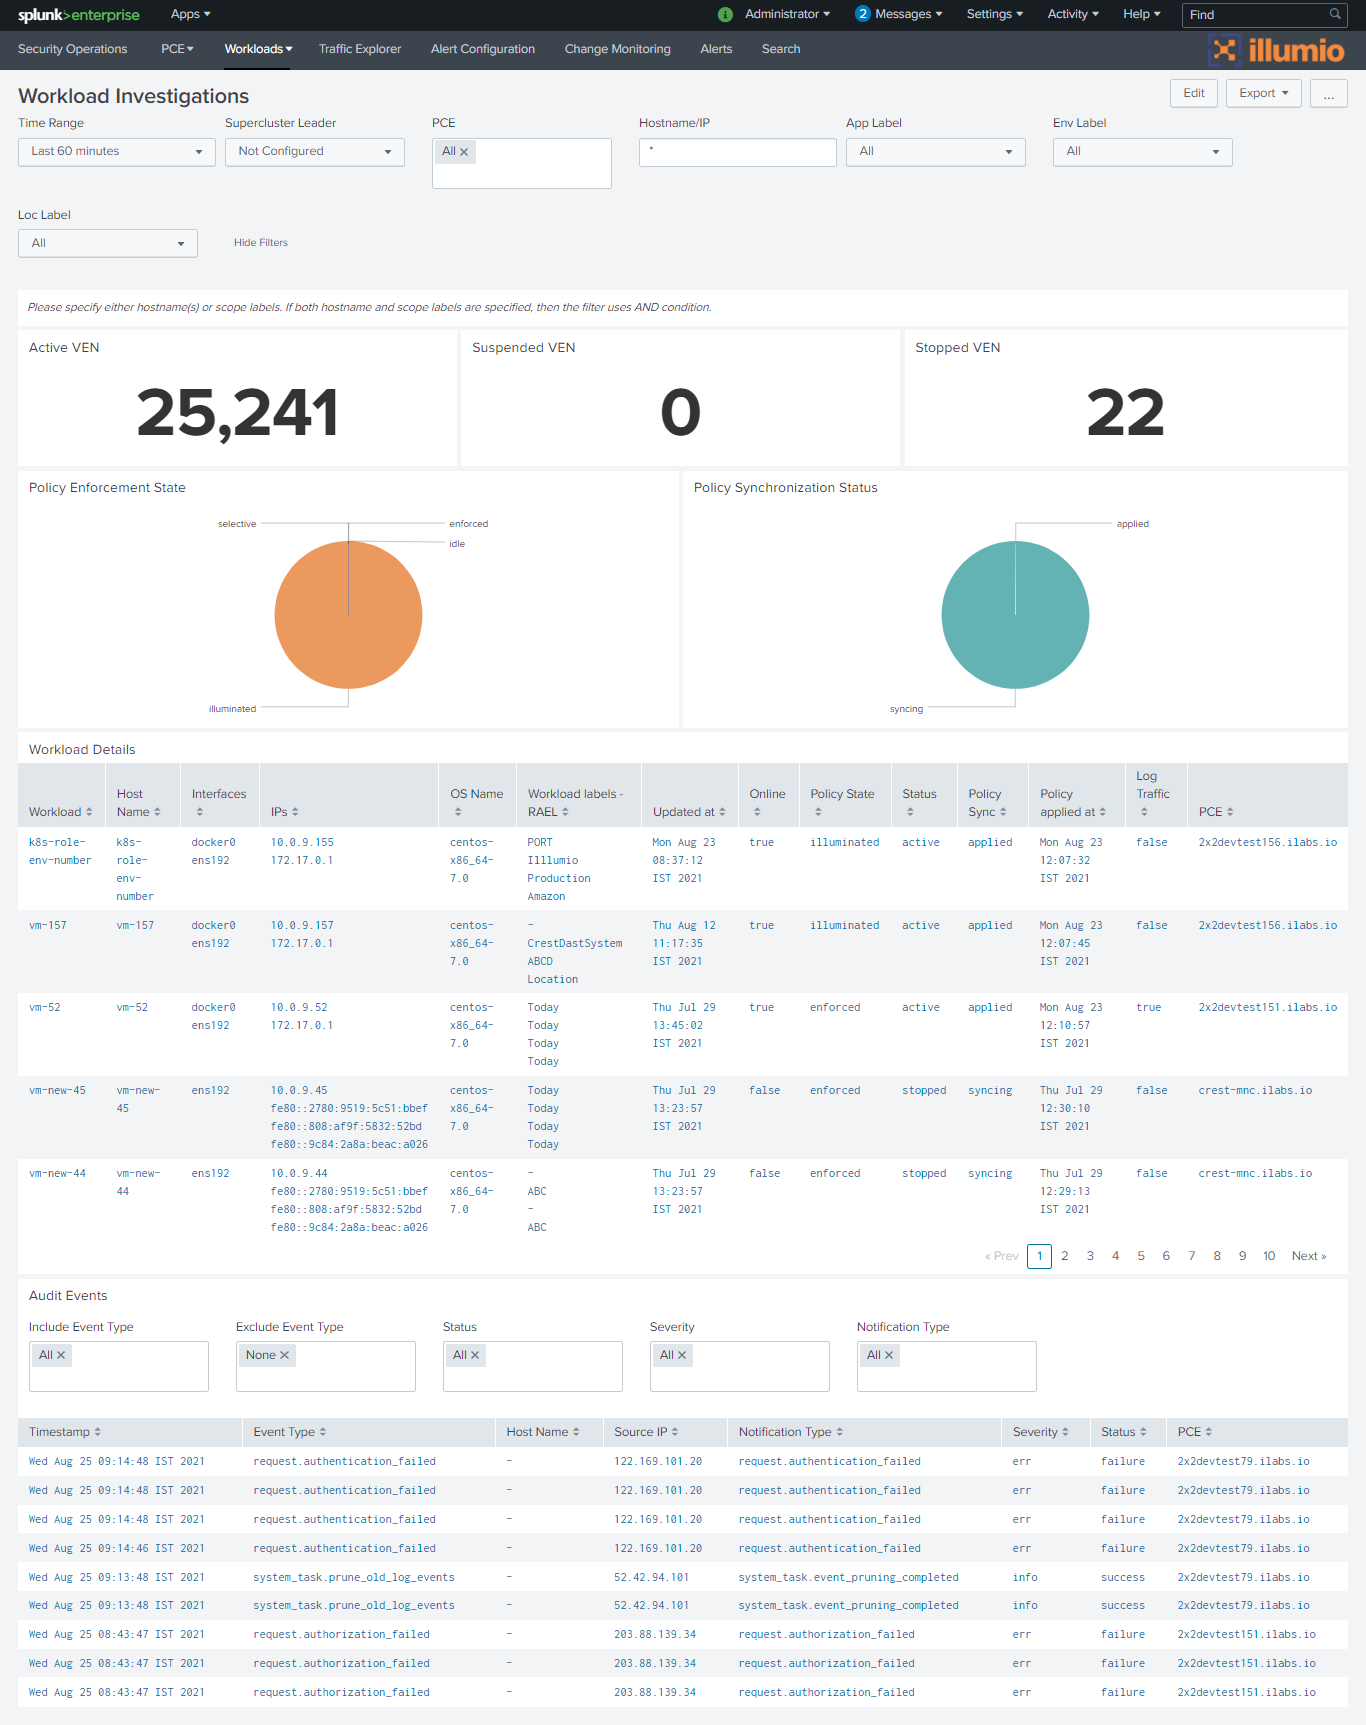
Workload Investigation Dashboard
The Workload Investigation dashboard enables you to search for detailed information about one or more workloads. If multiple PCE instances are connected to Splunk, you can use the drop-down list to choose which PCE to monitor. You can use the Time Range drop-down list to filter the display. You can use wildcards or IP addresses to select multiple workloads. Instead of using hostnames or IP addresses to select workloads, you can define a workload scope using the App Label, Env Label, and Loc Label drop-down lists.
The Workload Investigation dashboard has two panels:
Workload Details: Hostname, IP, Operating System, Status of policy, PCE
Audit Events: Events recorded for the workloads. You can click an event in the list to drill down for more details about the event.
 |
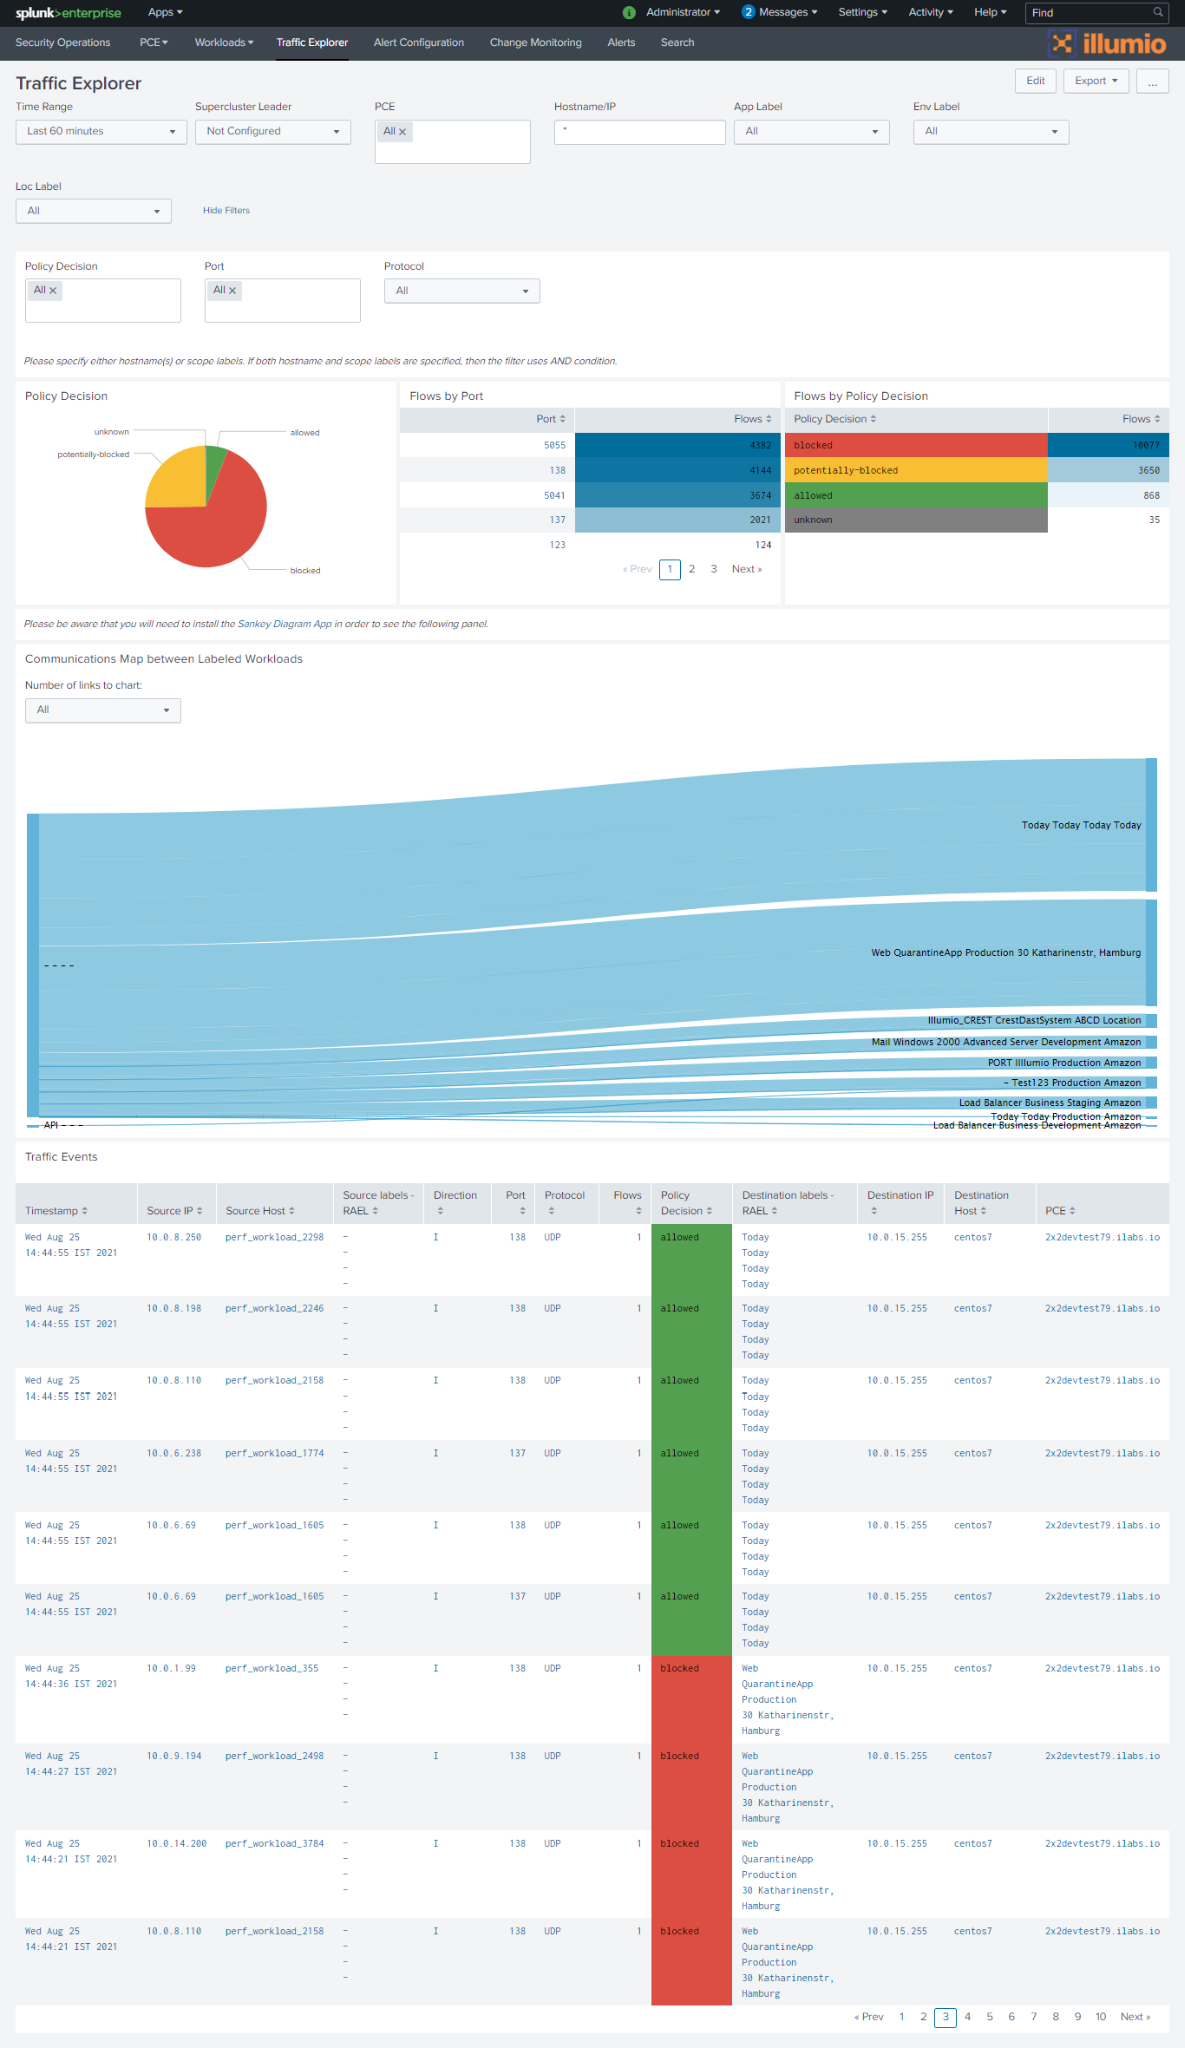
Traffic Explorer Dashboard
The Traffic Explorer dashboard helps you to visualize traffic data that is coming from syslog, and enables you to search for and filter traffic events.
 |
Note
The Traffic Explorer dashboard uses the Splunk Sankey Diagram app for visualization. You must install this app to use this dashboard.
Alert Configuration Page
See Configuring Alerts in the Configuration section later in this document.
Alerts Page
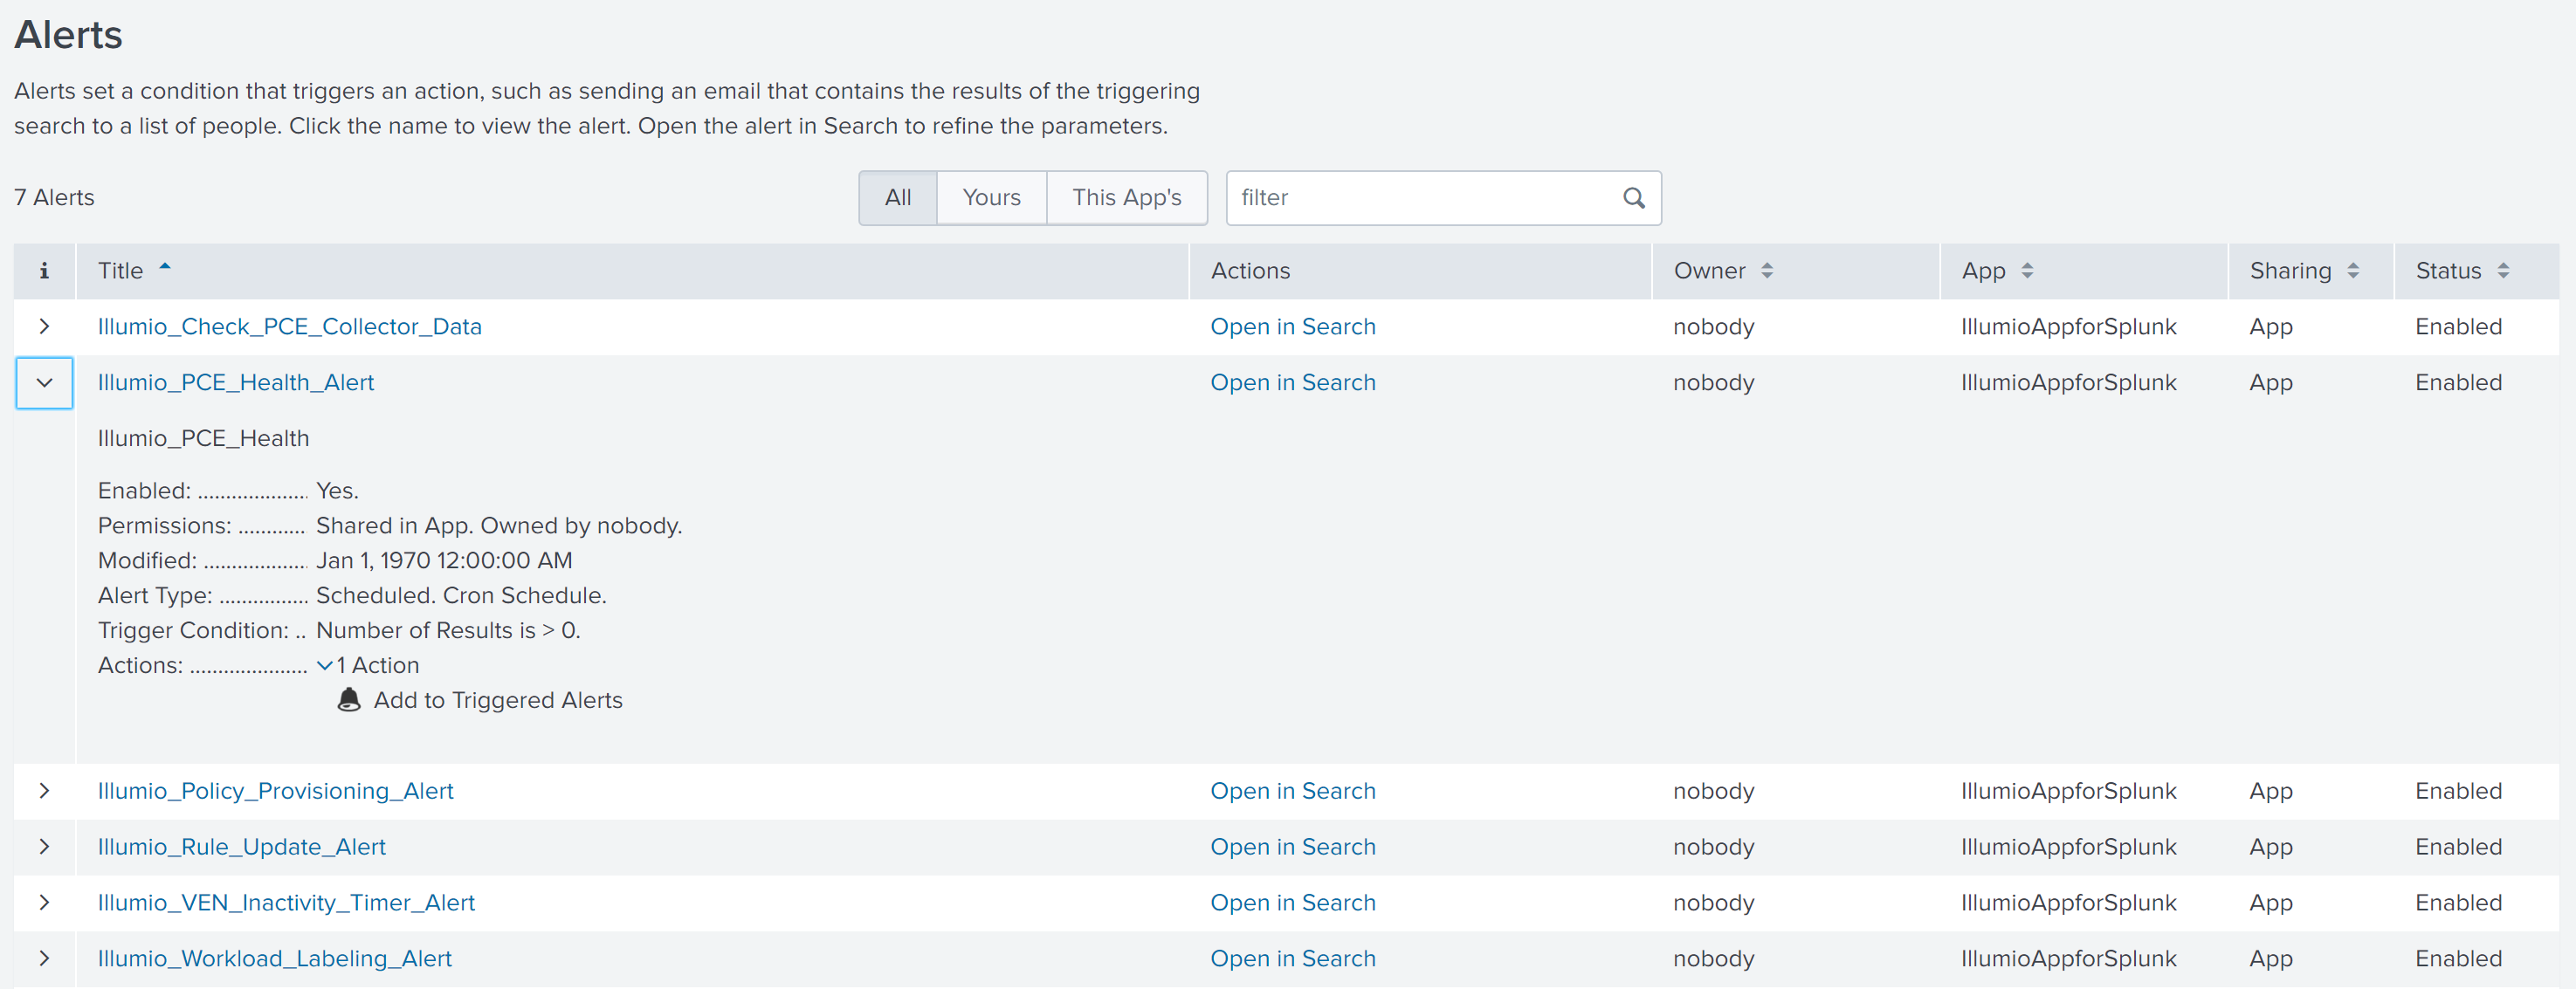
Click the Alerts link to view the Splunk Alerts page. On this page, you can view all alerts for the Illumio for Splunk app. This page contains links, such as Edit and Open in Search. Use the Edit link to set up email notifications for alerts. See the Splunk documentation for more information about this page.
 |
Change Monitoring Dashboard
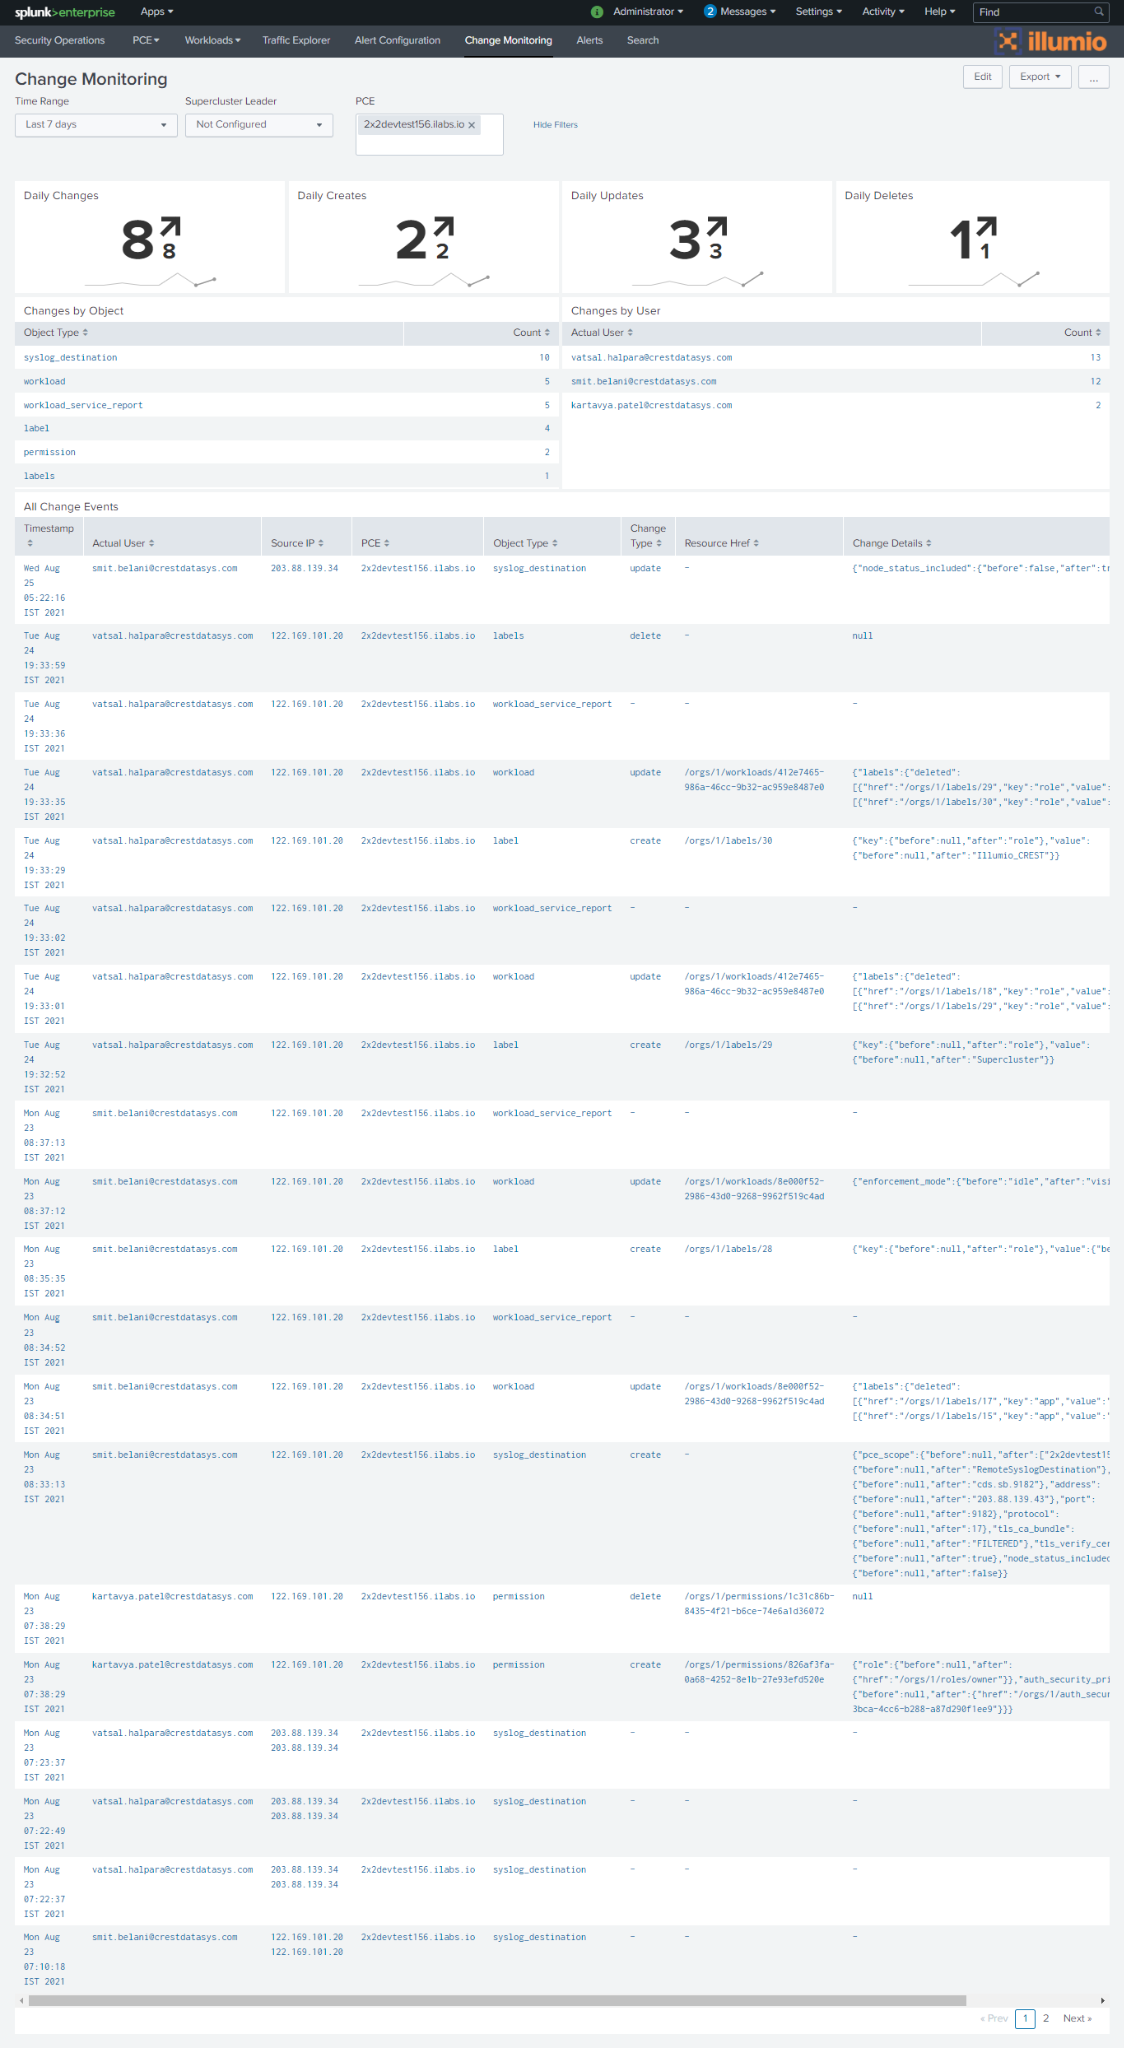
The Change Monitoring dashboard helps Splunk administrators search for detailed level information about changes performed by users.
Install the Illumio App for Splunk and Illumio Technology Add-On for Splunk
The following topics describe the installation prerequisites and how to install Splunk in different types of environments.
Installation Prerequisites
The SPLUNK_HOME environment variable must be set to the Splunk directory.
Splunk Enterprise 7.3.x, 8.0.x, 8.1.x, or 8.2.x.
You must have installed the Illumio PCE. For compatible PCE versions, see Compatibility Matrix.
Splunk Single-Server Deployment
In a single server deployment, a single instance of Splunk Enterprise works as a data collection node, indexer, and search head. In such scenarios, install both TA-Illumio and Illumio App for Splunk applications on this node. Then complete the setup of TA-Illumio to start data collection.
Splunk Distributed Deployment
In a distributed deployment, install Splunk Enterprise on at least on two instances. One node works as the search head, and the other node works as the indexer and data collection node. In a Splunk distributed deployment, the data collection node and indexer are deployed on separate servers. In this environment, install the Illumio App for Splunk application on each search head node and TA-Illumio on each indexer/forwarder and search head node.
Install the Illumio Technology Add-On for Splunk
This section describes how to install TA-Illumio.
How TA-Illumio Works with Splunk Components
This topic describes how TA-Illumio works with various Splunk components.
Splunk Heavy Forwarder
On the heavy forwarder, which is a Splunk Enterprise instance, TA-Illumio is used for data collection. TA-Illumio is required because the Illumio App for Splunk depends on both API and syslog data from Illumio. TA-Illumio provides both.
To make TA-Illumio data collection work, you must configure Data Input (modular input) as described in the Installation topics in this guide.
Depending on the Splunk deployment, the heavy forwarder might not be a separate component. It can be deployed on the same node as the indexer or search head.
Splunk Indexer
TA-Illumio has a special purpose on the indexer. The PCE might send invalid JSON data that does not need to be indexed. TA-Illumio filters out invalid JSON events. If invalid JSON events are not a concern, TA-Illumio does not need to be installed on the indexer. On the Splunk indexer, you can manually create the index in which the data is stored.
Splunk Search Head
TA-Illumio is used with the Splunk search haed to extract time fields, which the Illumio App for Splunk then uses in dashboard visualizations.
Install the Illumio App for Splunk in a Distributed Environment
The following table describes the apps to deploy when installing within a Splunk distributed environment.
App Name | Search Head | Indexer | Heavy Forwarder/Data Collection Node |
|---|---|---|---|
Data Input (also known as Modular Input or REST Modular Input) | Configure data input with API keys and data collection disabled (not checked) | Configure data input with API keys and data collection disabled (not checked) | Configure data input with API keys and data collection enabled |
Illumio App for Splunk | Yes | Not applicable | Not applicable |
Illumio Technology Add-On for Splunk | Yes | Optional (if you want invalid JSON filtered) | Yes |
The deployment procedure varies depending on whether you are using Heavy Forwarder or Splunk Universal Forwarder.
Use Splunk Heavy Forwarder
In a distributed environment with Splunk Heavy Forwarder:
On the search head, install the Illumio App for Splunk and the Illumio Technology Add-On for Splunk.
On the Splunk Heavy Forwarder, install the Illumio Technology Add-On for Splunk.
Use Splunk Universal Forwarder
In a distributed environment with Splunk Universal Forwarder:
Set up a data collection node with Splunk Universal Forwarder.
Configure the PCE to forward data from all nodes to the Splunk Universal Forwarder.
Configure the Splunk Universal Forwarder to send the data to Splunk Indexer or Splunk Heavy Forwarder.
Use the following procedure:
Configure the Splunk Universal Forwarder to collect data from the Illumio PCE:
Create a TCP stanza in the
$SPLUNK_HOME/etc/system/local/inputs.conffile.[tcp://<PORT>] index=<INDEX-NAME> sourcetype=illumio:pce
Configure the Splunk Universal Forwarder to send the data to the Splunk Indexer. Execute the following command on the Splunk Universal Forwarder (for
<IP>:<PORT>, fill in the Splunk Indexer IP and Listening Port:$SPLUNK_HOME/bin/splunk add forwardserver <IP>:<PORT>Configure the Splunk Indexer to receive data from SUF. Create the following stanza in the
$SPLUNK_HOME/etc/system/local/inputs.conffile.[splunktcp://<PORT>]
In a distributed environment:
If you have a separate data-collection node, be sure that it is running a full Splunk Enterprise version.
Complete the Data Input configuration on the data-collection node (Heavy Forwarder) with API keys and data collection enabled.
On all other nodes, configure the data input with the API keys and data collection disabled.
In setups where a non-default index is used, you may need to configure the
Illumio_get_indexsearch macro with the "index=Illumio" definition. See Splunk Index, Source, and Source Types.
Using Splunk Heavy Forwarder
In a distributed environment with Splunk Heavy Forwarder:
On the search head, install the Illumio App for Splunk and TA-Illumio.
On the Splunk Heavy Forwarder, install TA-Illumio.
Using Splunk Universal Forwarder
In a distributed environment with Splunk Universal Forwarder:
Set up a data collection node with Splunk Universal Forwarder.
Configure the PCE to forward data from all nodes to the Splunk Universal Forwarder.
Configure the Splunk Universal Forwarder to send the data to Splunk Indexer or Splunk Heavy Forwarder.
Configure the Splunk Universal Forwarder to collect data from the Illumio PCE.
Create a TCP stanza in the
$SPLUNK_HOME/etc/system/local/inputs.conffile.[tcp//<PORT>] index=<INDEX-NAME> sourcetype=illumio:pce
Configure the Splunk Universal Forwarder to send the data to the Splunk Indexer. Execute the following command on the Splunk Universal Forwarder (for <IP>:<PORT>, fill in the Splunk Indexer IP and Listening Port):
$SPLUNK_HOME/bin/splunk add forwardserver <IP>:<PORT>
Configure the Splunk Indexer to receive data from SUF. Create the following stanza in the
$SPLUNK_HOME/etc/system/local/inputs.conffile.[splunktcp://<PORT>]
In a distributed environment:
If you have a separate data collection node, be sure it is running a full Splunk Enterprise version.
Complete the Data Input configuration on the data collection node (Heavy Forwarder) with API keys and data collection enabled.
On all other nodes, configure the data input with the API keys and data collection disabled.
In setups where a non-default index is used, you may need to configure the search macro Illumio_get_index with a definition of “index=Illumio”. Use the steps in Splunk Index, Source, and Source Types.
Deploy to a Splunk Cloud Instance
In the Splunk Cloud, data indexing takes place in a cloud instance. The data collection can take place in an on-premises Splunk instance in your environment that will work as heavy forwarder.
Install from the Command Line or Use the Splunk Commands
You can install the Illumio App for Splunk and Illumio Technology Add-On for Splunk either through the command line or from the Splunk UI.
Use these commands for a fresh installation. If you are upgrading from a previous version, see Upgrade the App.
To install from the UI:
Log into Splunk, navigate to App > Manage Apps and click Install app from a file.
Choose the SPL file to install and click Upload the SPL.
To install from the command line:
Navigate to the
$SPLUNK_HOME/binfolder and execute the following command, substituting the rest of the actual file name for the XXs:./splunk install app TA-Illumio-XX-XXXX-XX.spl ./splunk install app IllumioAppForSplunk-XX-XXXX-XX.spl
Configure the Illumio App for Splunk, the PCE, and Alerts
This section describes how to configure the following after you install the Illumio App for Splunk:
Configure the Splunk app itself
Configure the on-premises or Cloud PCE
Configure Alerts
Configure the Illumio App for Splunk
After you have installed the Illumio Technology Add-On for Splunk, use the following procedure to configure Splunk to receive the data from the Illumio PCE syslog and to get workload and label information indexed into the Splunk App using the Illumio ASP REST API.
Log in to the Splunk web app and navigate to Settings > Data inputs.
Locate Illumio and click it.
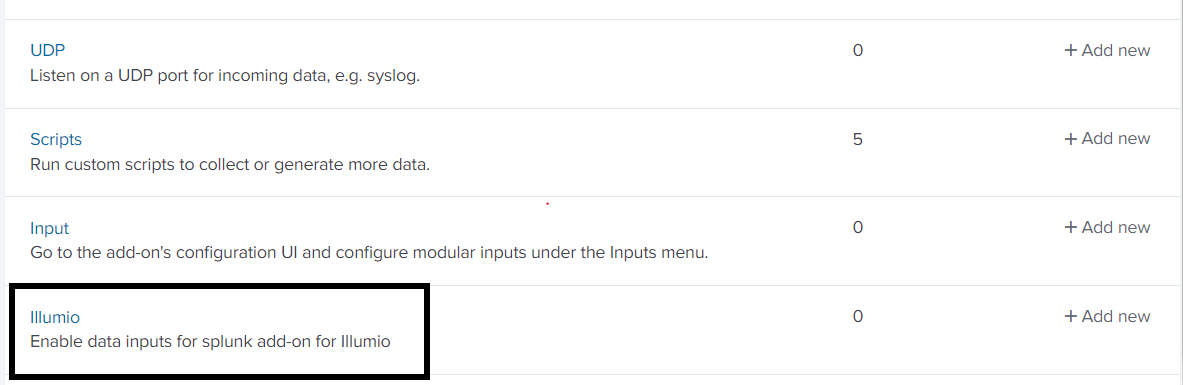
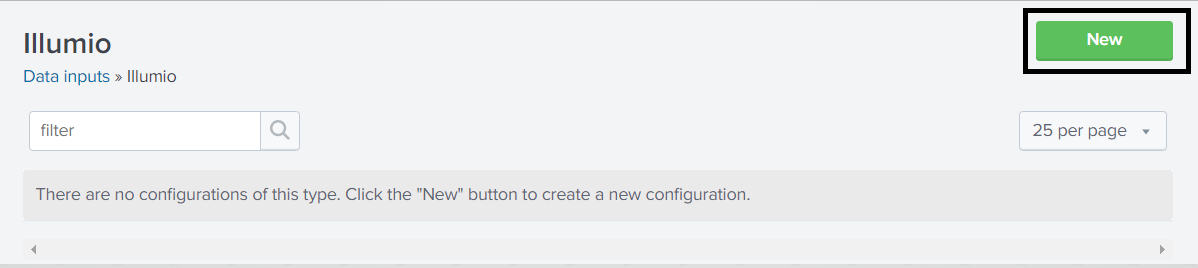
Click New to create the Data Input (Modular Input) for ingesting data from the Illumio PCE to the Illumio App for Splunk.
Note
If you have multiple PCEs sending data to a single Splunk instance, then you need to have a different Data Input with a different TCP port for each PCE.
In the Modular Input page, enter the configuration information using the following table:
Input
Mandatory or Optional
Description
Name
Mandatory
The name to identify the Illumio PCE.
Supercluster Leader/PCE URL
Mandatory
Enter the PCE URL including HTTPS and the port number. (If the provided PCE is part of the supercluster, it must be the leader of the supercluster.)
For example:
https://illumiopce.company.com:443/
API Authentication Username
Mandatory
The API Authentication Username used to authenticate with the Illumio PCE. To generate the API key, log into the Illumio PCE Web Console and click Username > My API Keys > Add New.
For example: api_16175f6af766fcd7b
If you do not specify API Username and API Secret, the PCE Operations and Workload Operations dashboards will not work.
API Authentication Secret
Mandatory
The API Secret is the password for an API key that is used to authenticate with the PCE. The API key generates the API Secret.
For example:
4ed8ff8a5c40201dc52c89a59936f7b1003b950e0027204b2aaaa633ba040d22
TCP Port Number for incoming syslog from PCE
Optional
The Splunk server port on which the Splunk App should listen for syslog messages from the PCE. The PCE should be configured to forward syslog to this port on the Splunk server. If you are creating multiple Data Inputs, use a different TCP port for each PCE.
For example: 5014
Port Scan configuration: Scan interval in seconds
Mandatory
The minimum time duration of connections between two workloads to determine a port scan.
For example, if two workloads show flows between 10 unique ports within 60 seconds, then a port scan is registered.
Default value: 60 seconds.
Port Scan configuration: Unique ports threshold
Mandatory
The minimum threshold of unique ports between two workloads to determine a port scan.
For example, if two workloads show flows between 10 unique ports within 60 seconds, then a port scan is registered.
Default value: 10 ports.
Labels to quarantine Workloads
Optional
Comma-separated list of App, Environment, and Location label types. Whitespaces are not allowed in the comma-separated list. Labels must be supplied with Application, Environment, Location as the exact order. These labels should exist on the PCE with the appropriate policy to quarantine workloads. These labels will be applied while quarantining the workloads using the App or AR action.
Organization ID
Optional
For Illumio Data Center (on-premises) customers, the Organization ID is 1.
For Illumio Cloud customers, the Organization ID can vary. To determine the Organization ID, log into the Illumio PCE Web Console, click the administrator's name in the top-right corner, and then click My API keys > Add New . The Create New API dialog shows the Organization ID.
IP addresses of the PCE Nodes
Optional
Comma-separated IP addresses (private, public) of all of the nodes managed by this PCE instance. You must provide all IP addresses. Use only commas and do not add space characters.
Data Collection
Mandatory
When enabled, the TA will collect data on this instance. If you are using a Splunk Cluster, this should be enabled on the indexer node but disabled on the search head nodes.
Default: Enabled
Note
When you are invoking Quarantine Workload with Splunk Cluster, you need to configure the TA-Illumio search head node with data collection disabled and the TA-Illumio data-collection indexer node enabled.
If necessary, enter the optional settings in the following table:
Input Parameter
Mandatory or Optional
Description
Interval
Optional
Interval between REST API calls made by the Splunk App to refresh data from the PCE. The minimum value is 3600 seconds (60 minutes).
Default: 3600
Interval
Optional
Interval for the polling between AWS and the Splunk App. The default value is 1800 seconds (30 minutes)
Host
Optional
Host information added into events to be indexed by Splunk. Illumio recommends using the FQDN of the Splunk server.
Index
Optional
For use by advanced Splunk users. Change the index name under which received events are categorized. If you use a non-default (custom) index such as "Illumio", create the index manually and modify the search macros to return "index=illumio". See Splunk Index, Source, and Source Types.
Custom (Self-Signed or Local CA) Certificate Path
Optional
If you use a local certificate authority SSL certificate or a self-signed SSL certificate with the PCE, you need to upload the SSL Certificate to the Splunk server and provide the full path to the directory.
For correct SSL operation, the Splunk server must be able to fully trust the PCE's certificate. If you are using a local certificate authority or a certificate issued by a secondary certificate authority, you must update the Splunk server certificate authority trust chain to verify the certificate presented by the PCE. For example, on Linux, use the
update-ca-trusttool.Allowed port scanner IP addresses
Optional
Whitelist IP addresses of known port scanners, such as Qualys hosts. These addresses are excluded when determining port scans, which avoids false positives in the Port Scans panels.
Click Next after you have added the values for data input (modular input).
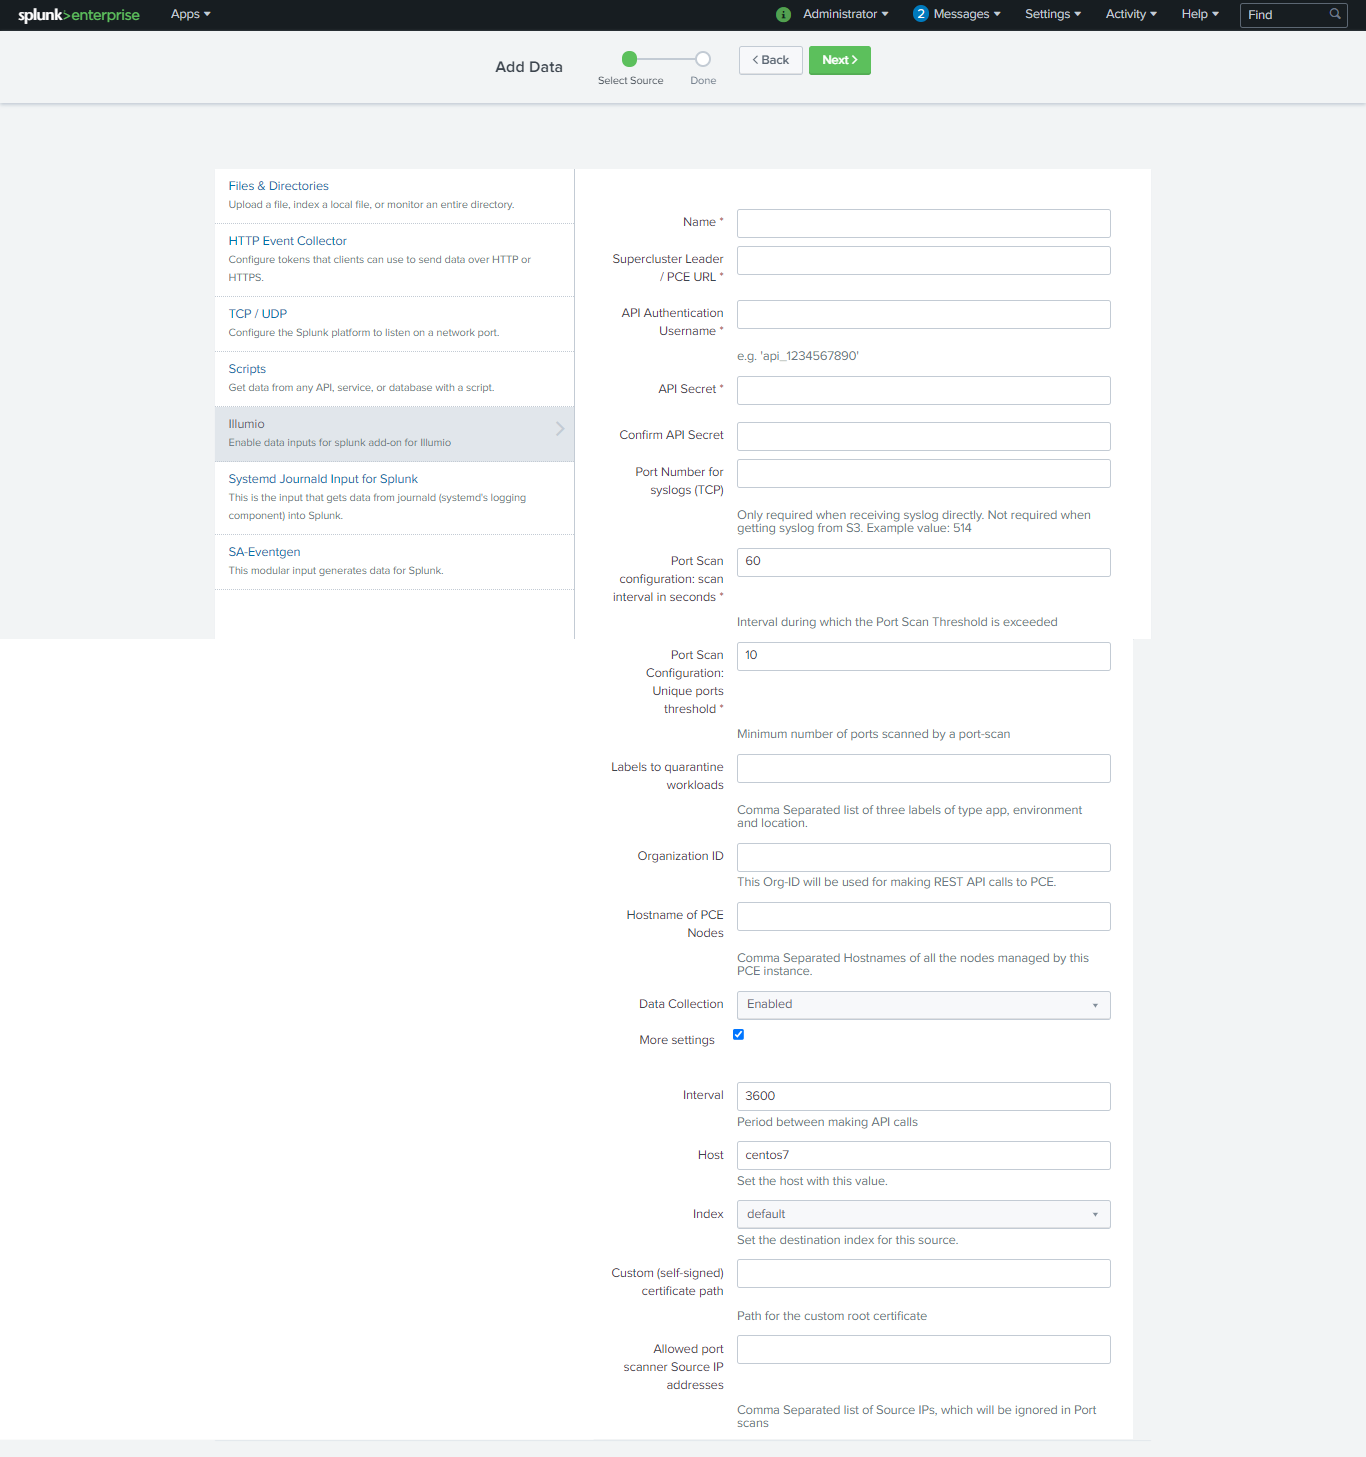
Look for a success message displayed as a header in the setup page. This indicates that the credentials passed validation. If the credentials were incorrect or there were validation errors, a failure message displays. See Troubleshooting.
About Intervals for On-Premises and Cloud Deployments
The data flow for On-Premises and Cloud is similar, but with a Cloud deployment, there are more servers to collect, receive, and send the data flow logs and then push them to the S3 bucket. Whatever the PCE logs collect is pushed to S3.
The S3 bucket can be managed by Illumio or you can create and manage it using the CloudFormation template. For more information, see Flow Logs and Auditable Event Logs for Illumio Secure Cloud PCE.
Note that the interval for the VEN to send traffic data logs is always 10 minutes.
Configure the On-Premises PCE
You must make configuration changes on the PCE so that data is forwarded to the Splunk server.
Configure the Syslog
Use the information in the "Additional PCE Installation Tasks" topic in PCE Installation and Upgrade Guide.
Configure the Runtime PCE
Note
This procedure is for PCE versions earlier than 18.2.1. If you are running version 18.2.1 or later, skip this procedure.
To generate and send traffic flow summaries to the PCE syslog and forward them to Splunk, you need to make the following changes to the runtime_env.yml PCE Runtime Environment file. You need to make changes to the runtime_env.yml file on all PCE nodes in the cluster, and you need to restart the PCE to make your changes take effect.
export_flow_summaries_to_syslog:

- accepted

- potentially_blocked

- blocked
For more information about runtime_env.yml and the export_flow_summaries_to_syslog setting, see PCE Installation and Upgrade Guide.
PCE runtime_env.yml Configuration
export_flow_summaries_to_syslog:
- accepted
- potentially_blocked
- blocked
For more information about runtime_env.yml and the setting export_flow_summaries_to_syslog, see the Illumio ASP PCE Deployment Guide.
Configure the Illumio PCE on Illumio Cloud
If you are using Illumio Cloud, perform the configuration steps in Configure the On-Premises PCE .
You need the following two components so that your PCE data can be relayed to the Illumio App for Splunk:
An Amazon S3 bucket, which permits reliably storing events from Illumio Cloud.
The Splunk Add-On for AWS, which permits reading events from an Amazon S3 bucket.
Illumio PCE on Cloud logs all traffic flows, including allowed traffic, blocked traffic, potentially blocked traffic, and auditable events to your Amazon S3 bucket. You may choose to disable specific types of events in Illumio Cloud by filing a support ticket. The Splunk Add-on for AWS reads the data from Amazon S3, enriches the data with the source type, and enables data to be processed by TA-Illumio. You then can see the data in Illumio App for Splunk.
Starting with the Illumio App for Splunk 2.3.0, the consumption of data from S3 is more robust than in earlier versions.
Configure the Amazon S3 Bucket
To implement the Illumio App for Splunk with your Illumio PCE in the Cloud, you must provide an AWS S3 bucket. You can create and configure an using an Illumio-provided CloudFormation template, which is available here: Flow Logs for Illumio Secure Cloud PCE and within this guide: Using the AWS CloudFormation Template .
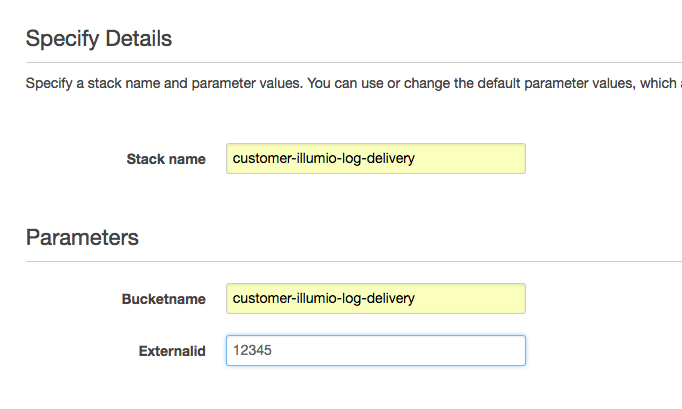
The CloudFormation template contains the Illumio AWS account ID. "Externalid" is an extra password to ensure that root access to the Illumio production account is not enough to access your S3 bucket, to prevent a poorly functioning third-party service. For more information, see How to Use External ID When Granting Access to Your AWS Resources on the Amazon Blog.
When you contact Illumio, provide the following information:
The AWS S3 bucket name that you have chosen.
Your AWS account ID. This is available under My Account or https://console.aws.amazon.com/billing/home?#/account in the AWS console.
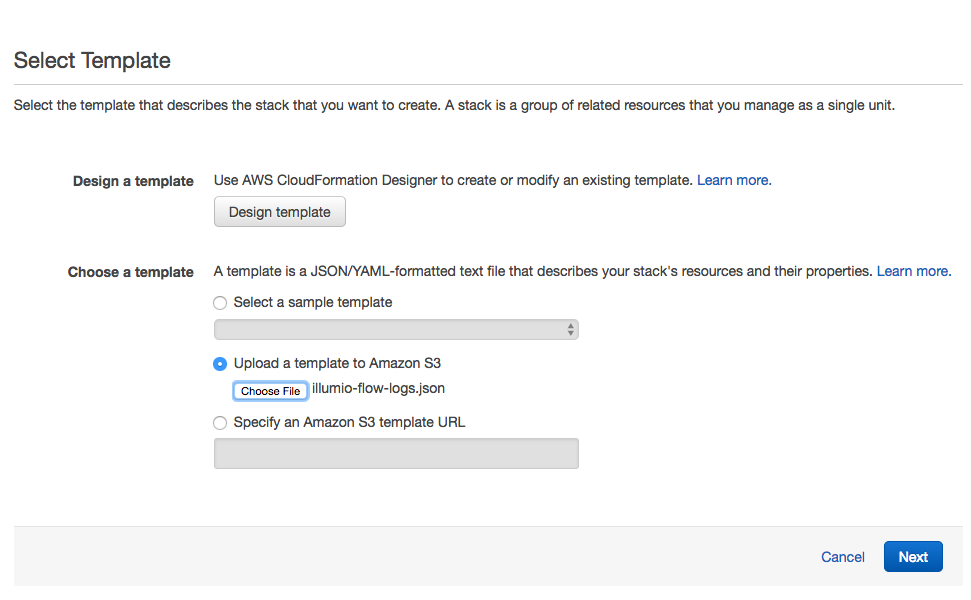
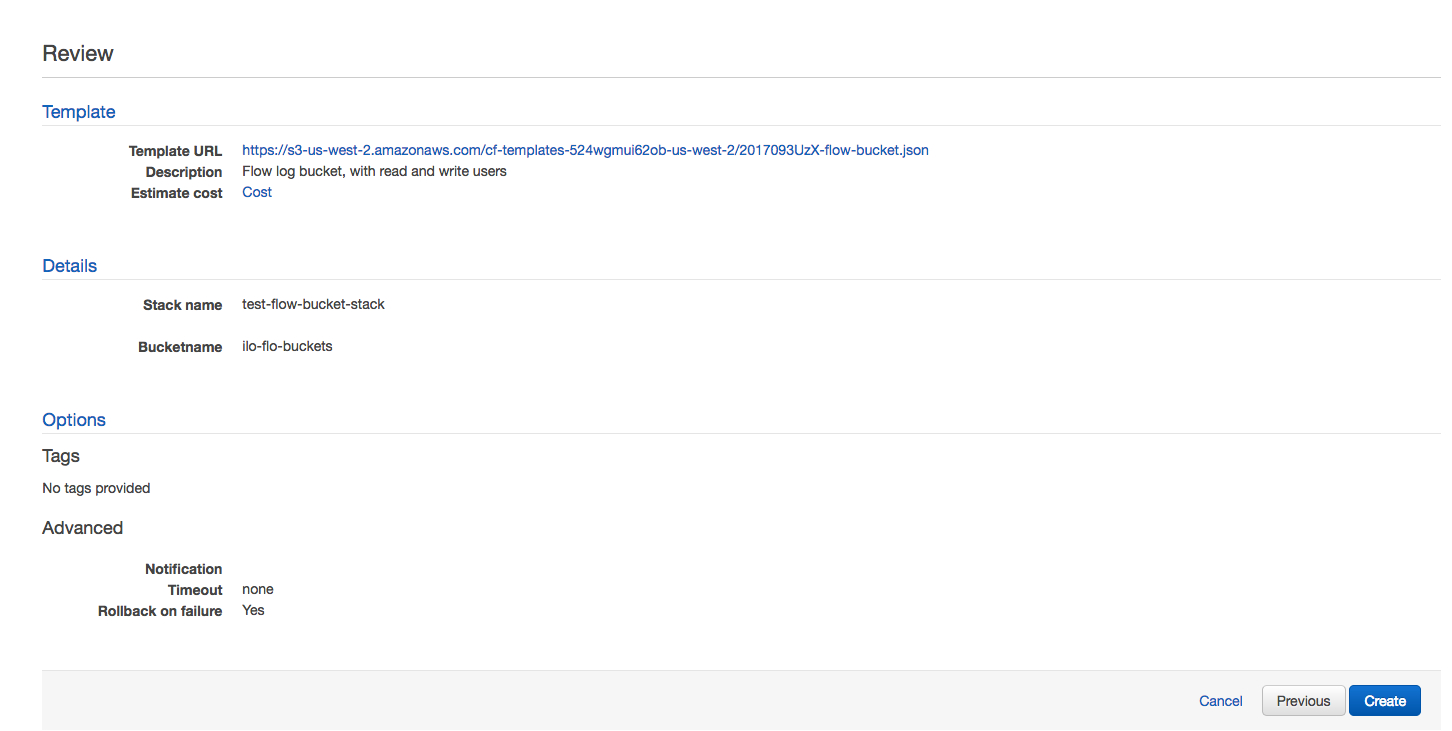
Load the template into CloudFormation as follows:
Select a template.
Specify the details. You can use whatever label you want for Stack name, because the name is for convenience only.
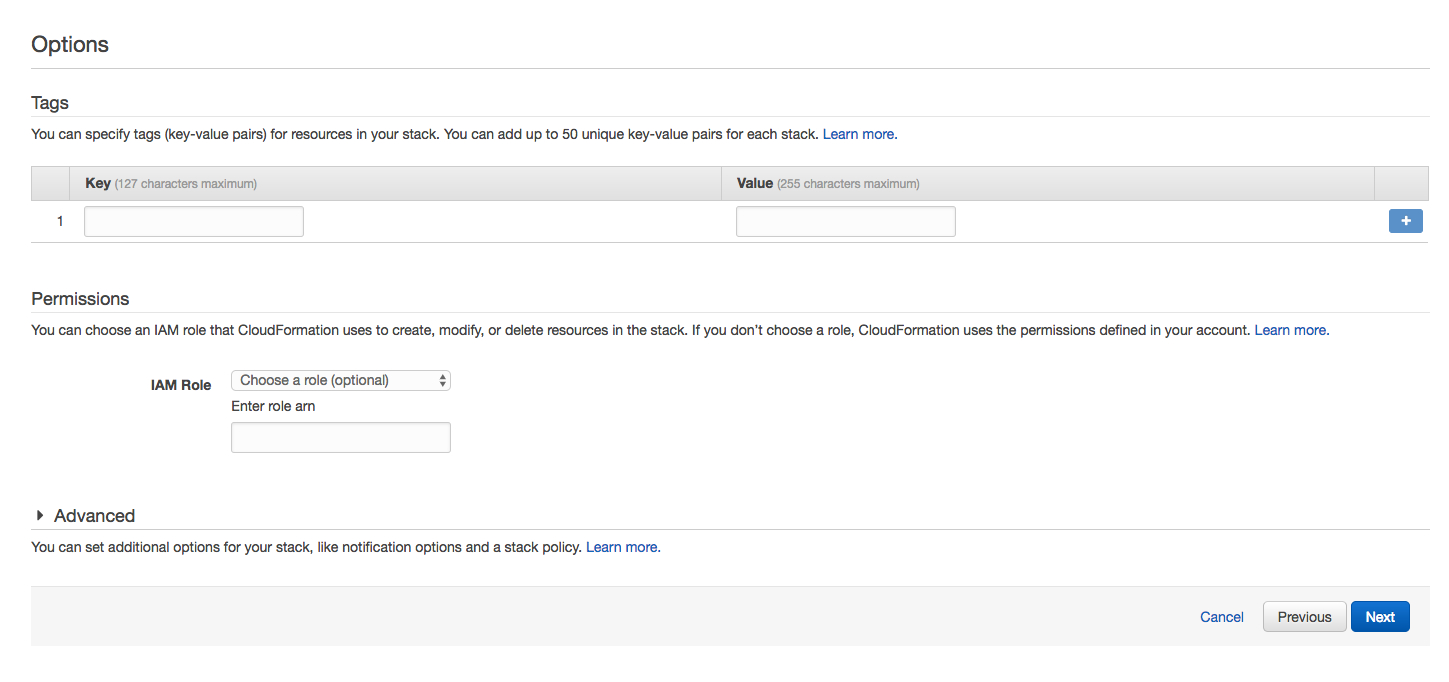
Specify the options.
Review the configuration and click Create.
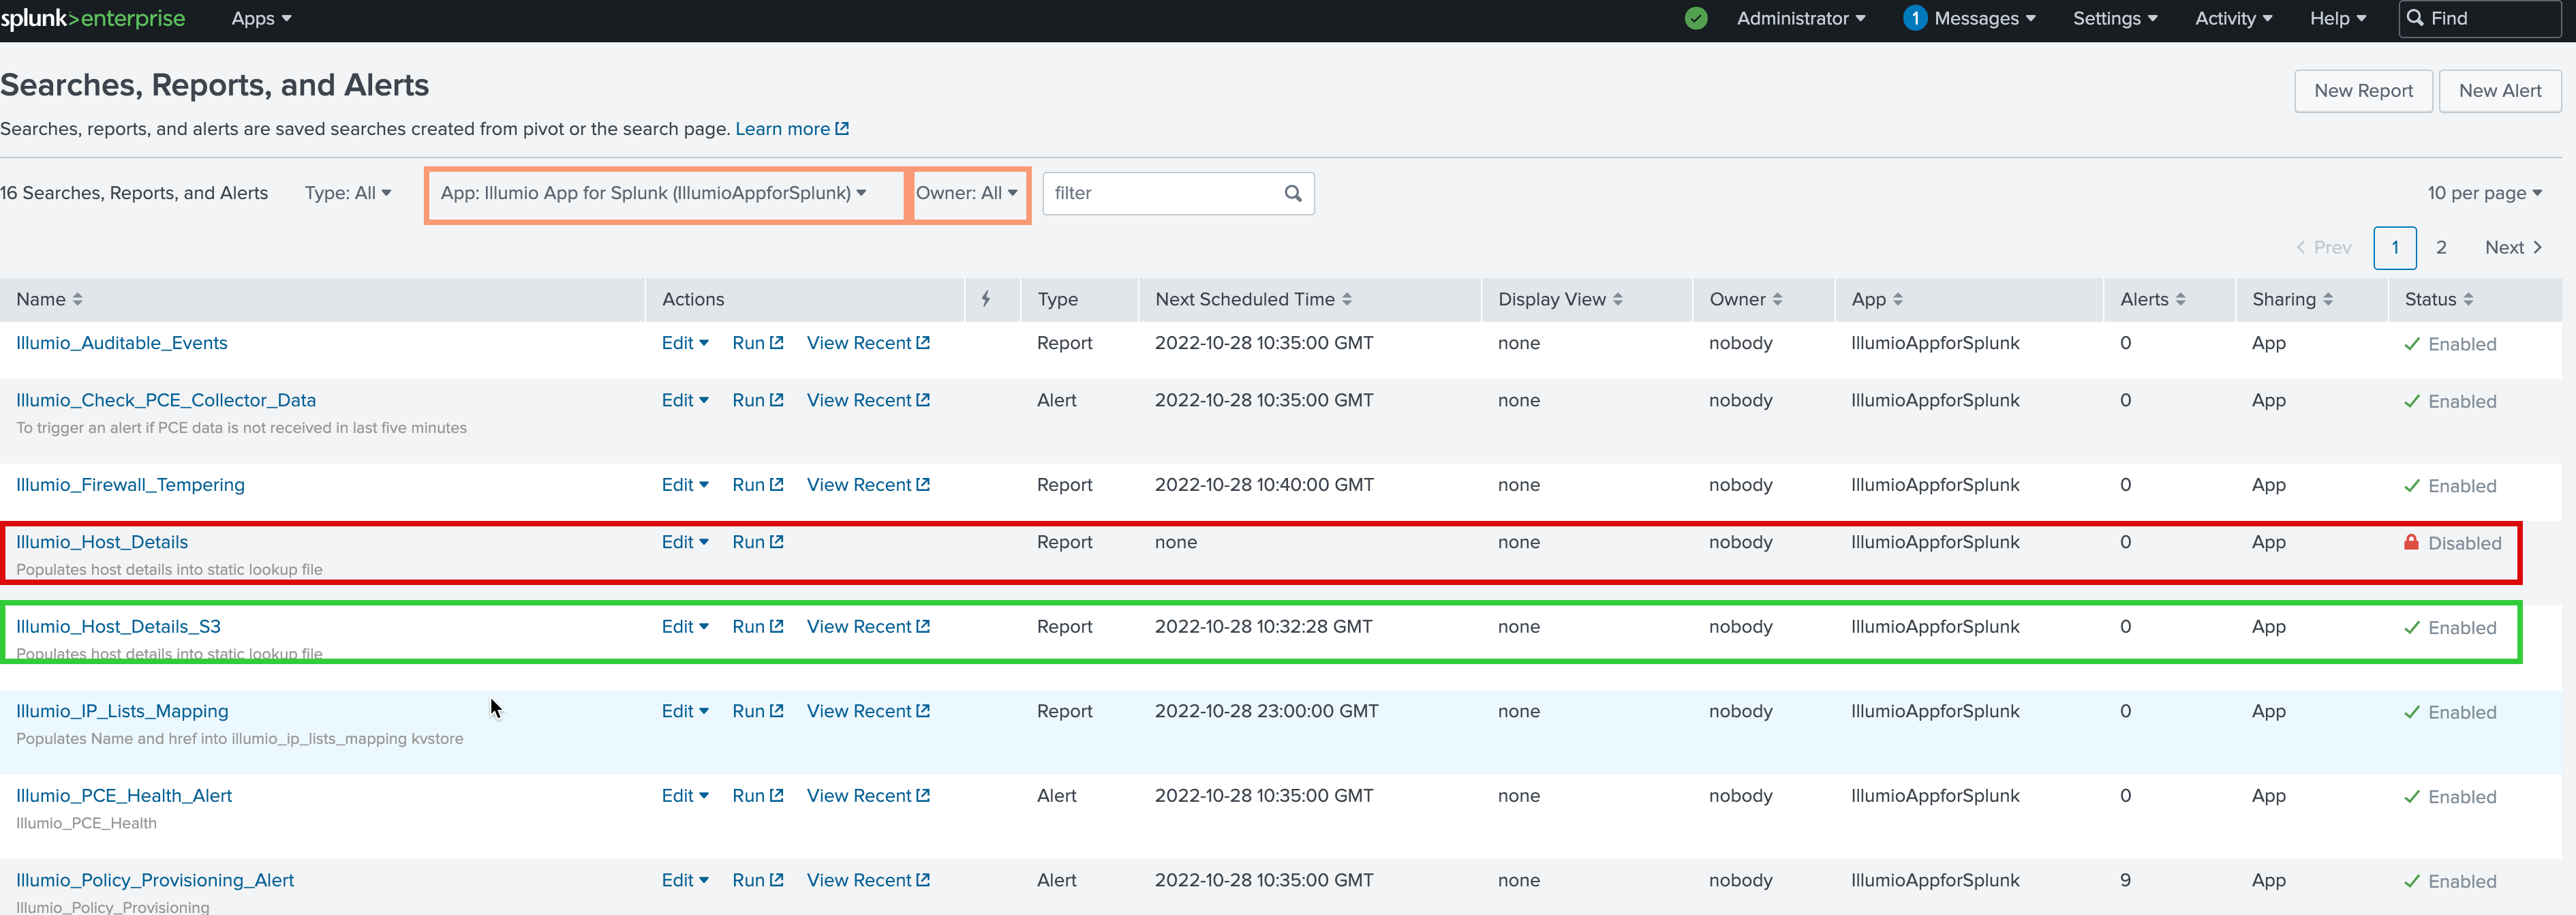
After you have configured the Amazon S3 bucket, you need to perform the following steps so that all of the inputs will display on the dashboards.
Navigate to Searches, Reports, and Alerts and filter for IllumioAppForSplunk in the App field and All in the Owner field.
In the list, disable Illumio_Host_Details and enable Illumio_Host_Details_S3.
Configure the Splunk Add-On for AWS
Install the Splunk Add-On for AWS.
Note
The Splunk App for AWS is a different app than the Splunk Add-On for AWS.
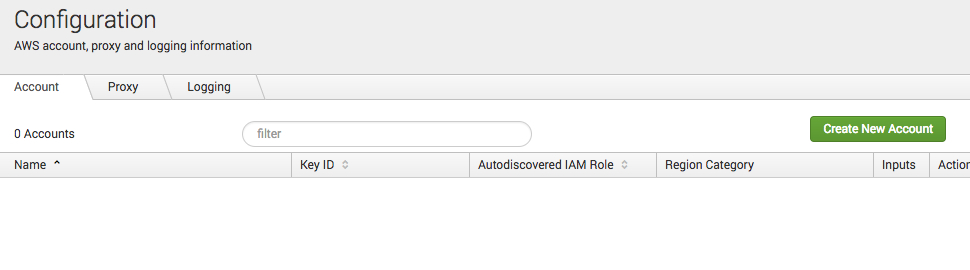
Enter your account into the Splunk Add-On for AWS app:
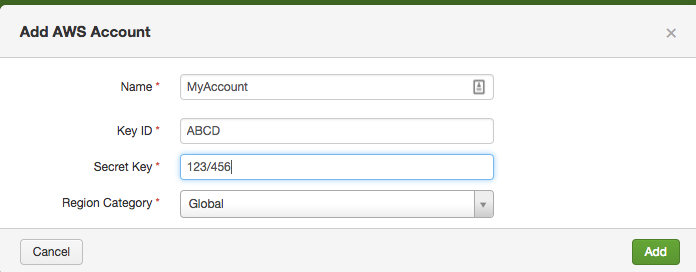
Enter values into the Name, Key ID, and Secret Key fields, and select Global from the Region Category drop-down:
Be sure to create an IAM S3 bucket policy that allows Splunk to access the S3 bucket. See Configure S3 permissions in the Splunk documentation.
Navigate to Settings > Data inputs:
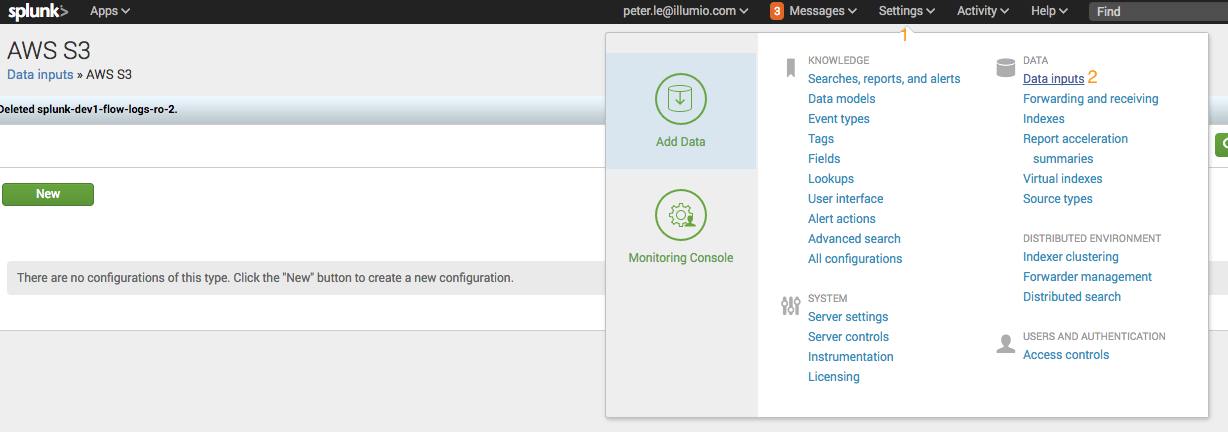
Create two data inputs for AWS S3:
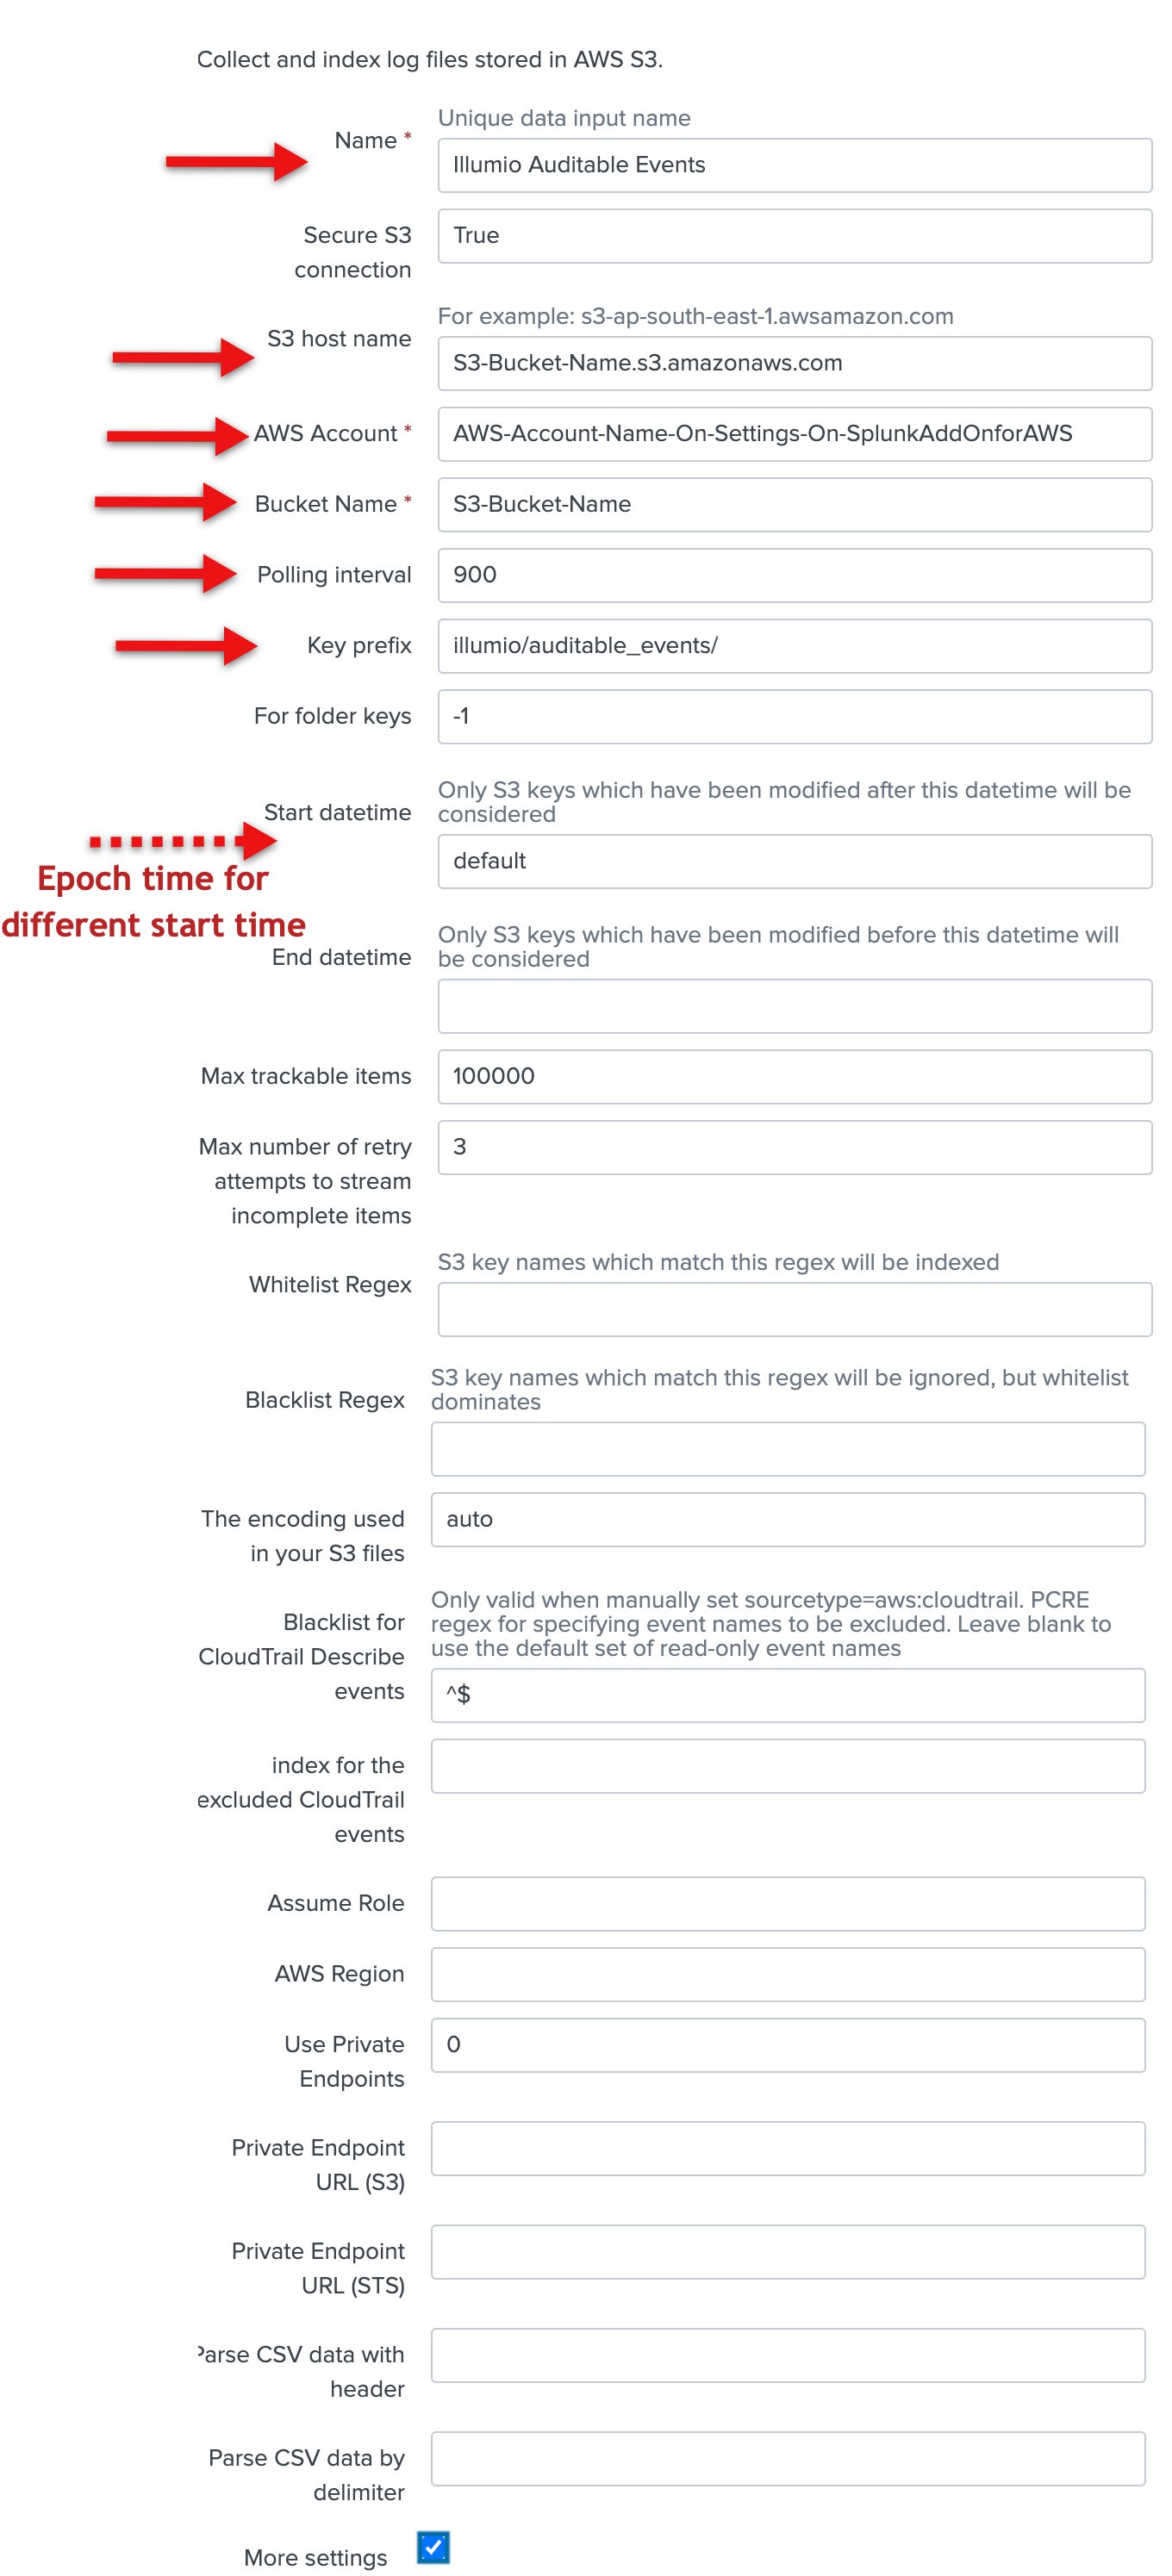
Create one data input for events and set the source type to Illumio:pce.
Create one data input for traffic flow summaries and set the source type to Illumio:pce:collector.
Find AWS S3 and click Add New:

Add the following configuration data for events:
Enter the name in the Name field.
Enter the account in the AWS Account field.
Enter the S3 bucket name in the Bucket Name field.
Enter the polling interval (900 seconds, optional).
Enter Illumio/auditable_events/ in the Key prefix field.
You can accept the default values for everything else on this screen.
Note that you cannot edit the initial time scan parameter of an S3 input after you create it. If you need to adjust the start time of an S3 input, delete it and recreate it.
Check the More settings checkbox, and enter illumio:pce in the Source type field. You can accept the default values for the other fields.
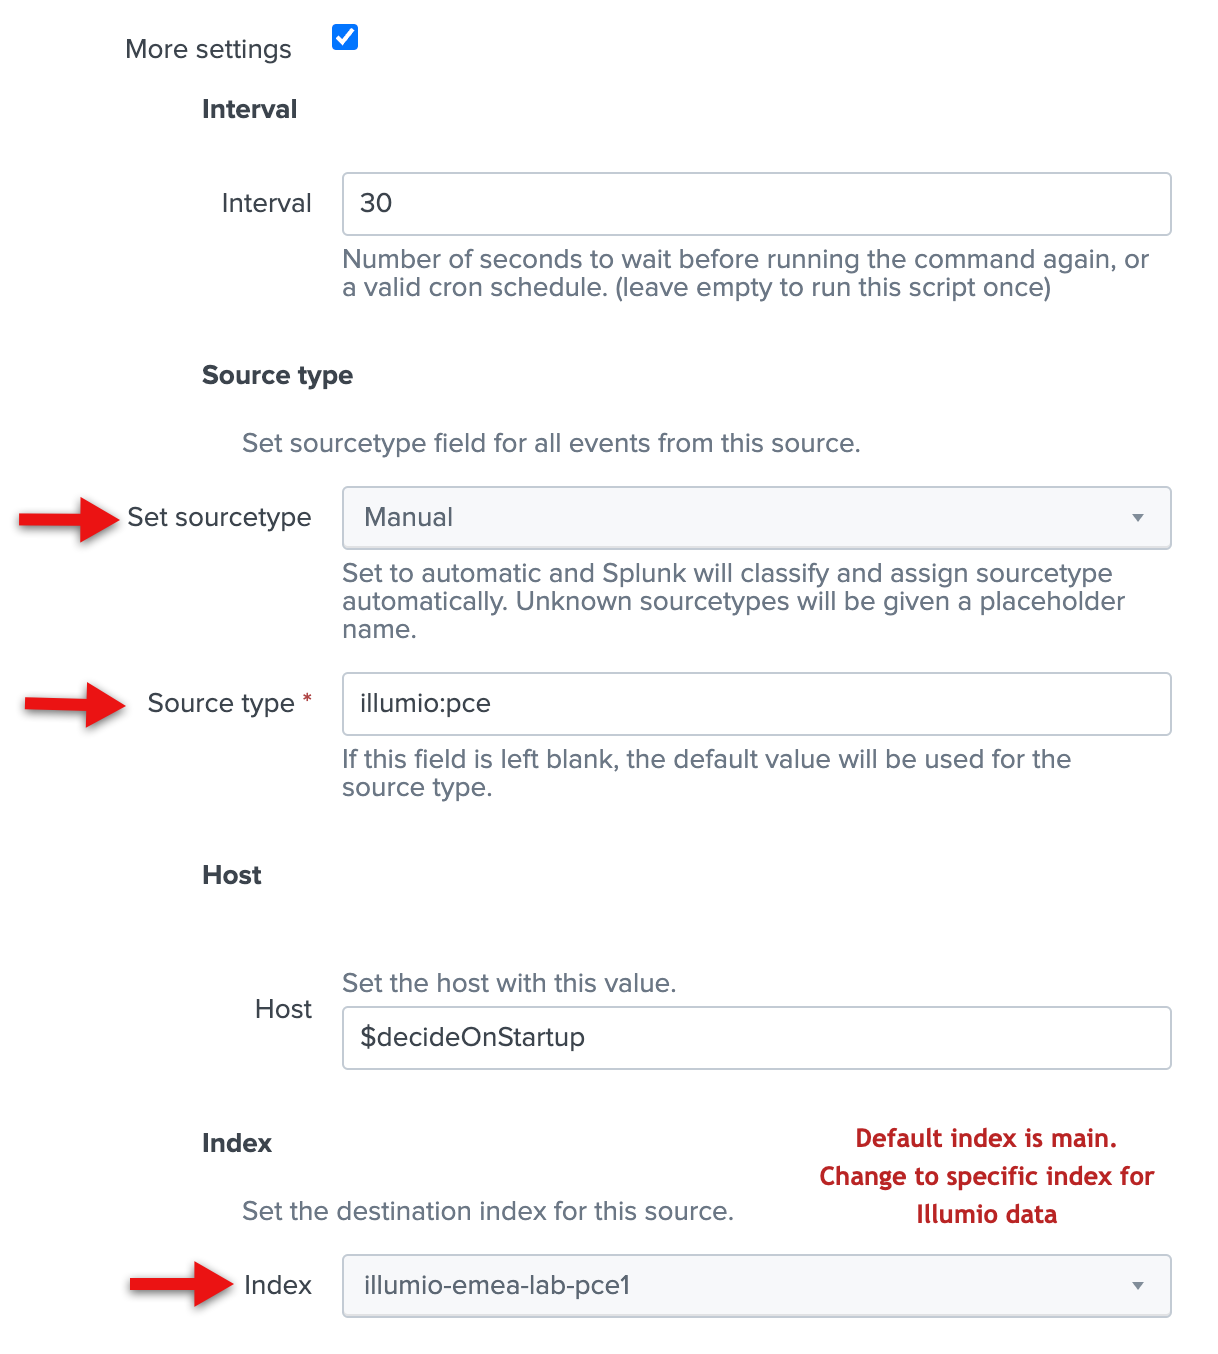
Click Save.
Add the following configuration data for traffic flow summaries:
Enter the name in the Name field.
Enter the account in the AWS Account field.
Enter the S3 bucket name in the Bucket Name field.
Enter the polling interval (900 seconds, optional).
Enter
Illumio/summaries/in the Key prefix field.Check the More settings checkbox, and enter illumio:pce:collector in the Source type field.
You can accept the default values for everything else.
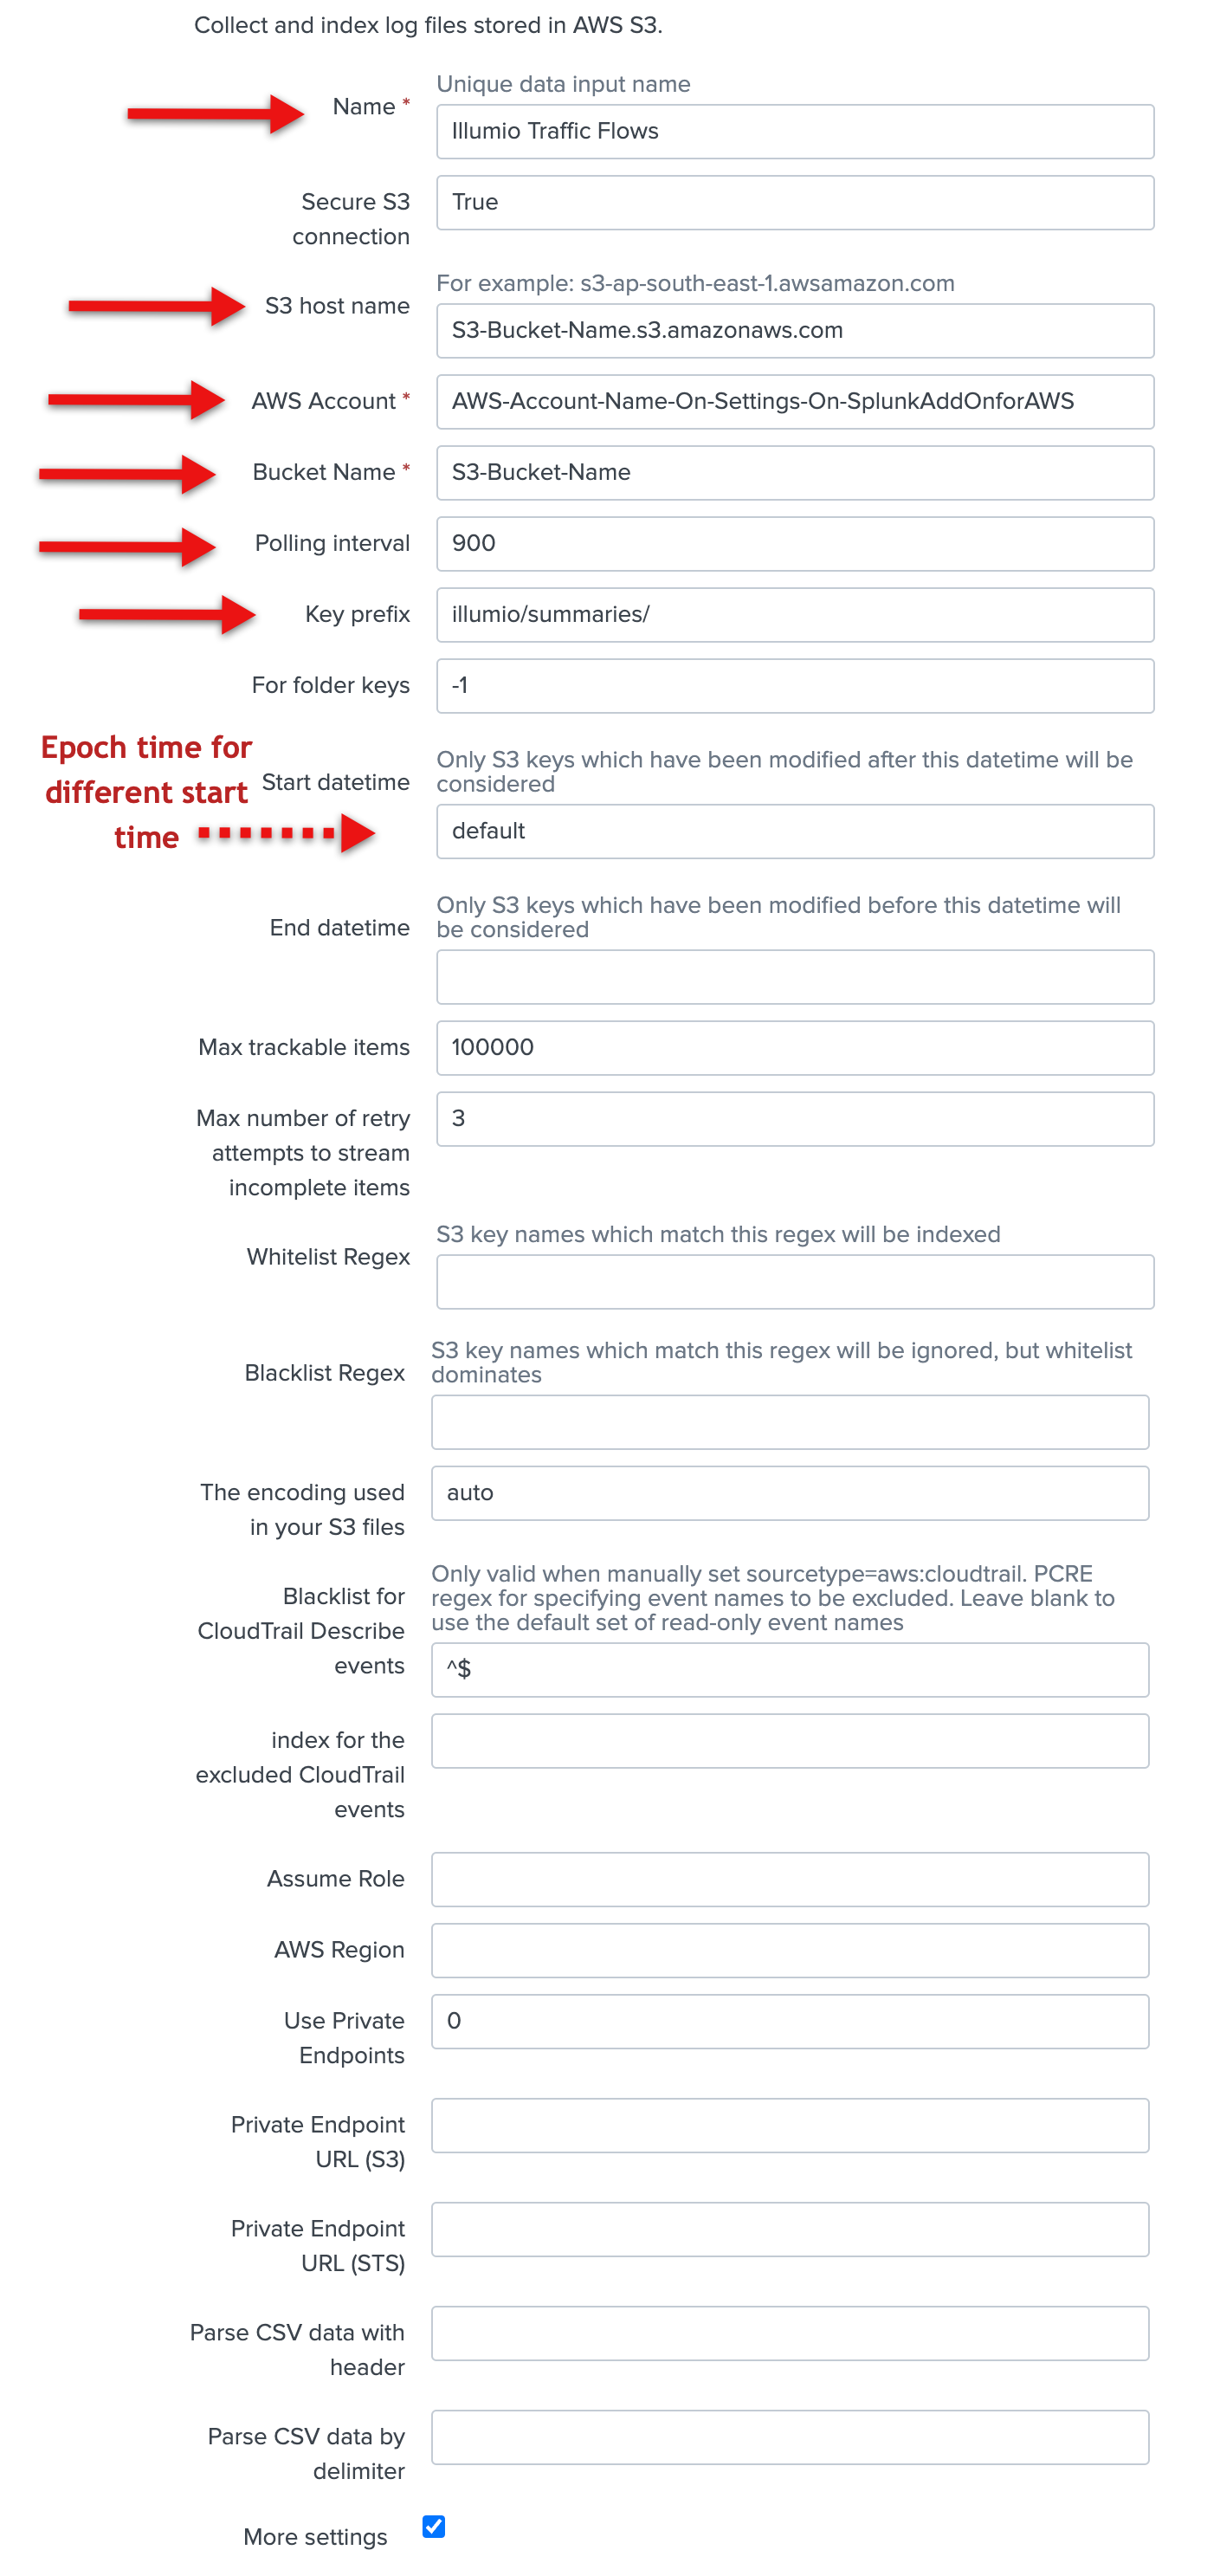
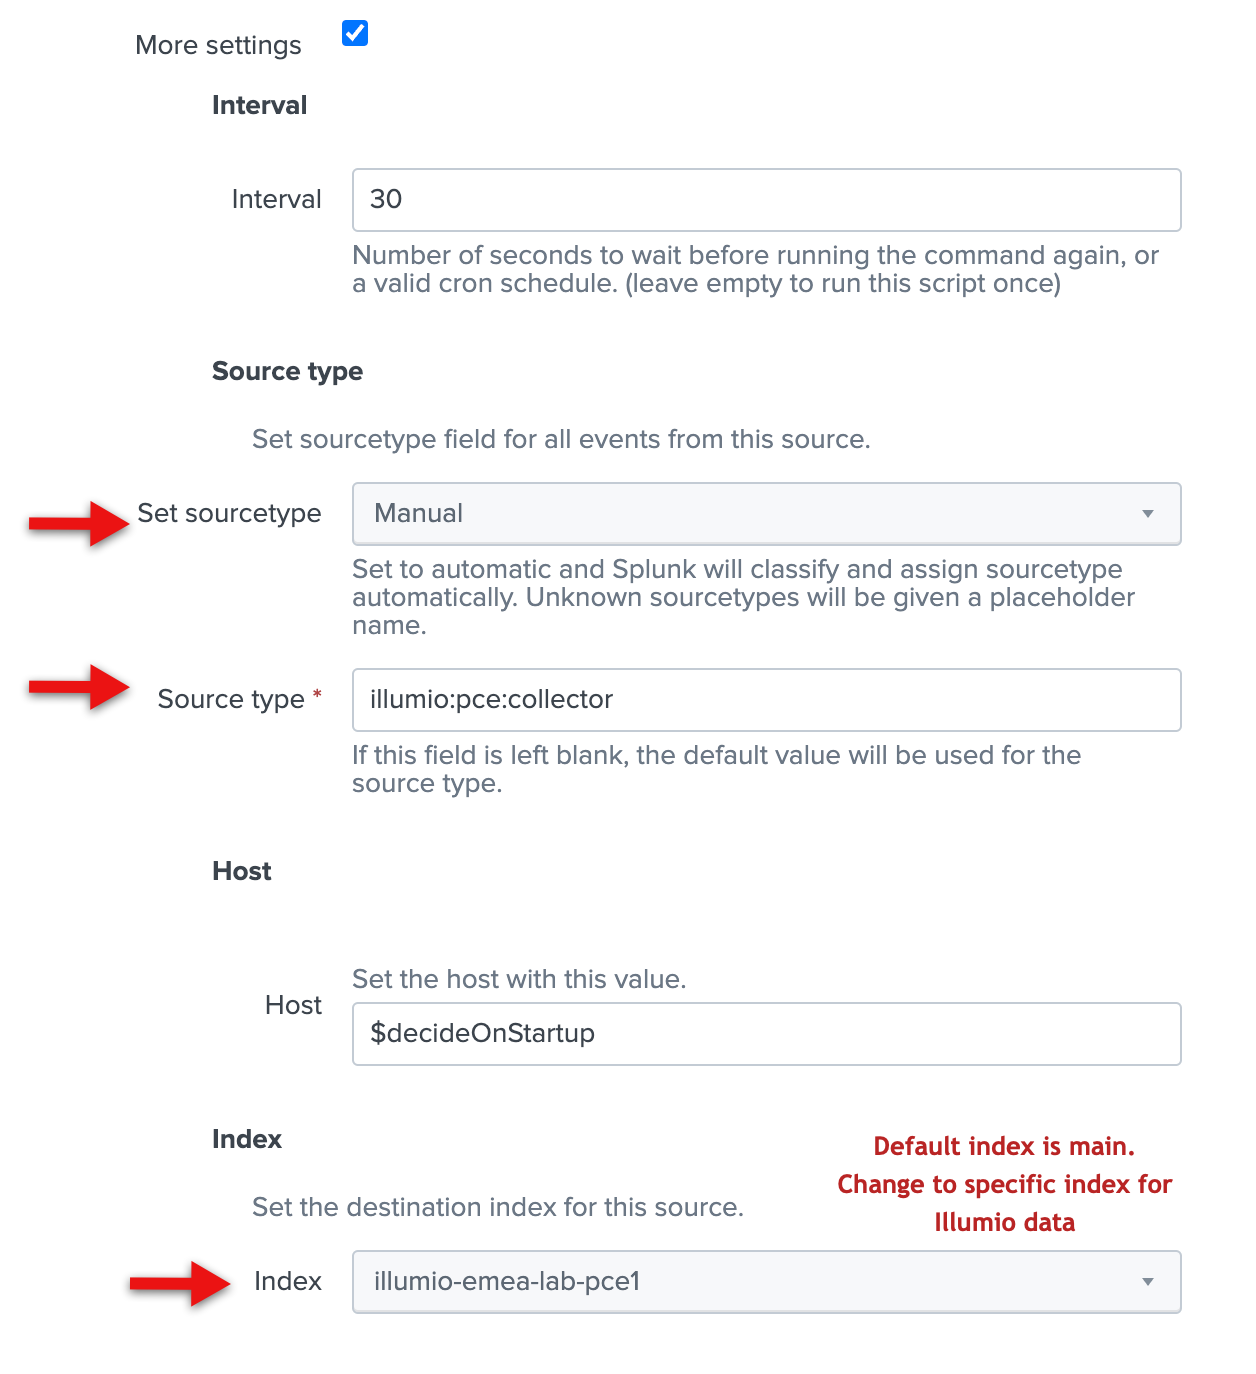
Click Save.
In the Inputs screen, you should see your two new inputs. Click the arrow next to the input name to view details about the input.
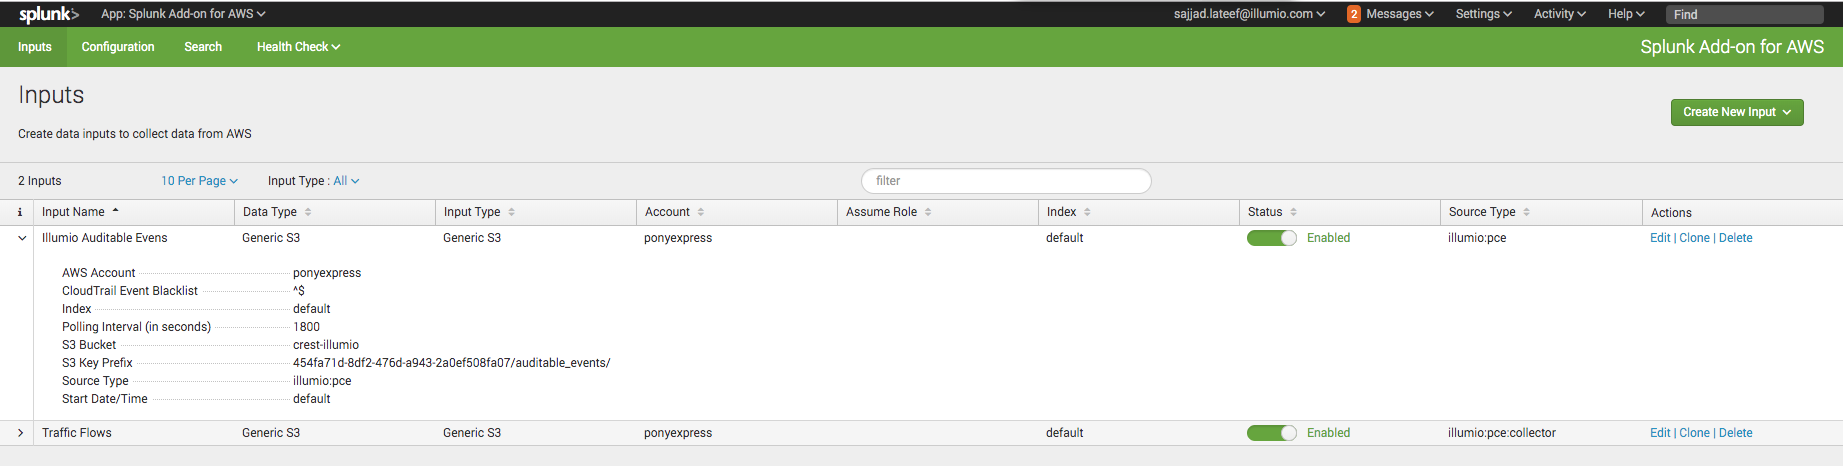
You should also have access to your VEN flow data and auditable event logs. See Example Splunk Queries for examples of how to access the data. Illumio can provide additional Splunk queries if you need them. Contact Illumio Technical Support for assistance.
Speed Up UI Rendering
If most of your searches will cover a time period of 7 days or less, you can make the panels in the app respond more quickly by modifying the summariesonly macro.
Choose Settings > Advanced Search > Search Macros.
Click the
summariesonlymacro.Change the definition of the macro to
"summariesonly=true".
Configure Alerts
If you have administrator privileges on the Illumio App for Splunk, you can create or update alert configurations using the Alert Configuration page. By using alert configurations, you can watch for events that are of interest related to a variety of Illumio PCE entities such as rules and workloads.
To display the Alert Configuration page, click Alert Configuration in the top-level navigation menu. This link only appears if your user account has the admin role.
After creating alert configurations, use the Alerts page to set up the usage of the alerts, such as sending emails whenever an alert is triggered. See the Splunk documentation for details about alert configuration and the Alerts page.
In the Illumio App for Splunk, you can configure five different types of alerts. Choose the desired alert type in the drop-down list on the Alert Configuration screen.
The options in the drop-down are:
PCE System Health Events
Rule Set Writing/Update
Rule Writing Update
Policy Provisioning
Workload Labeling
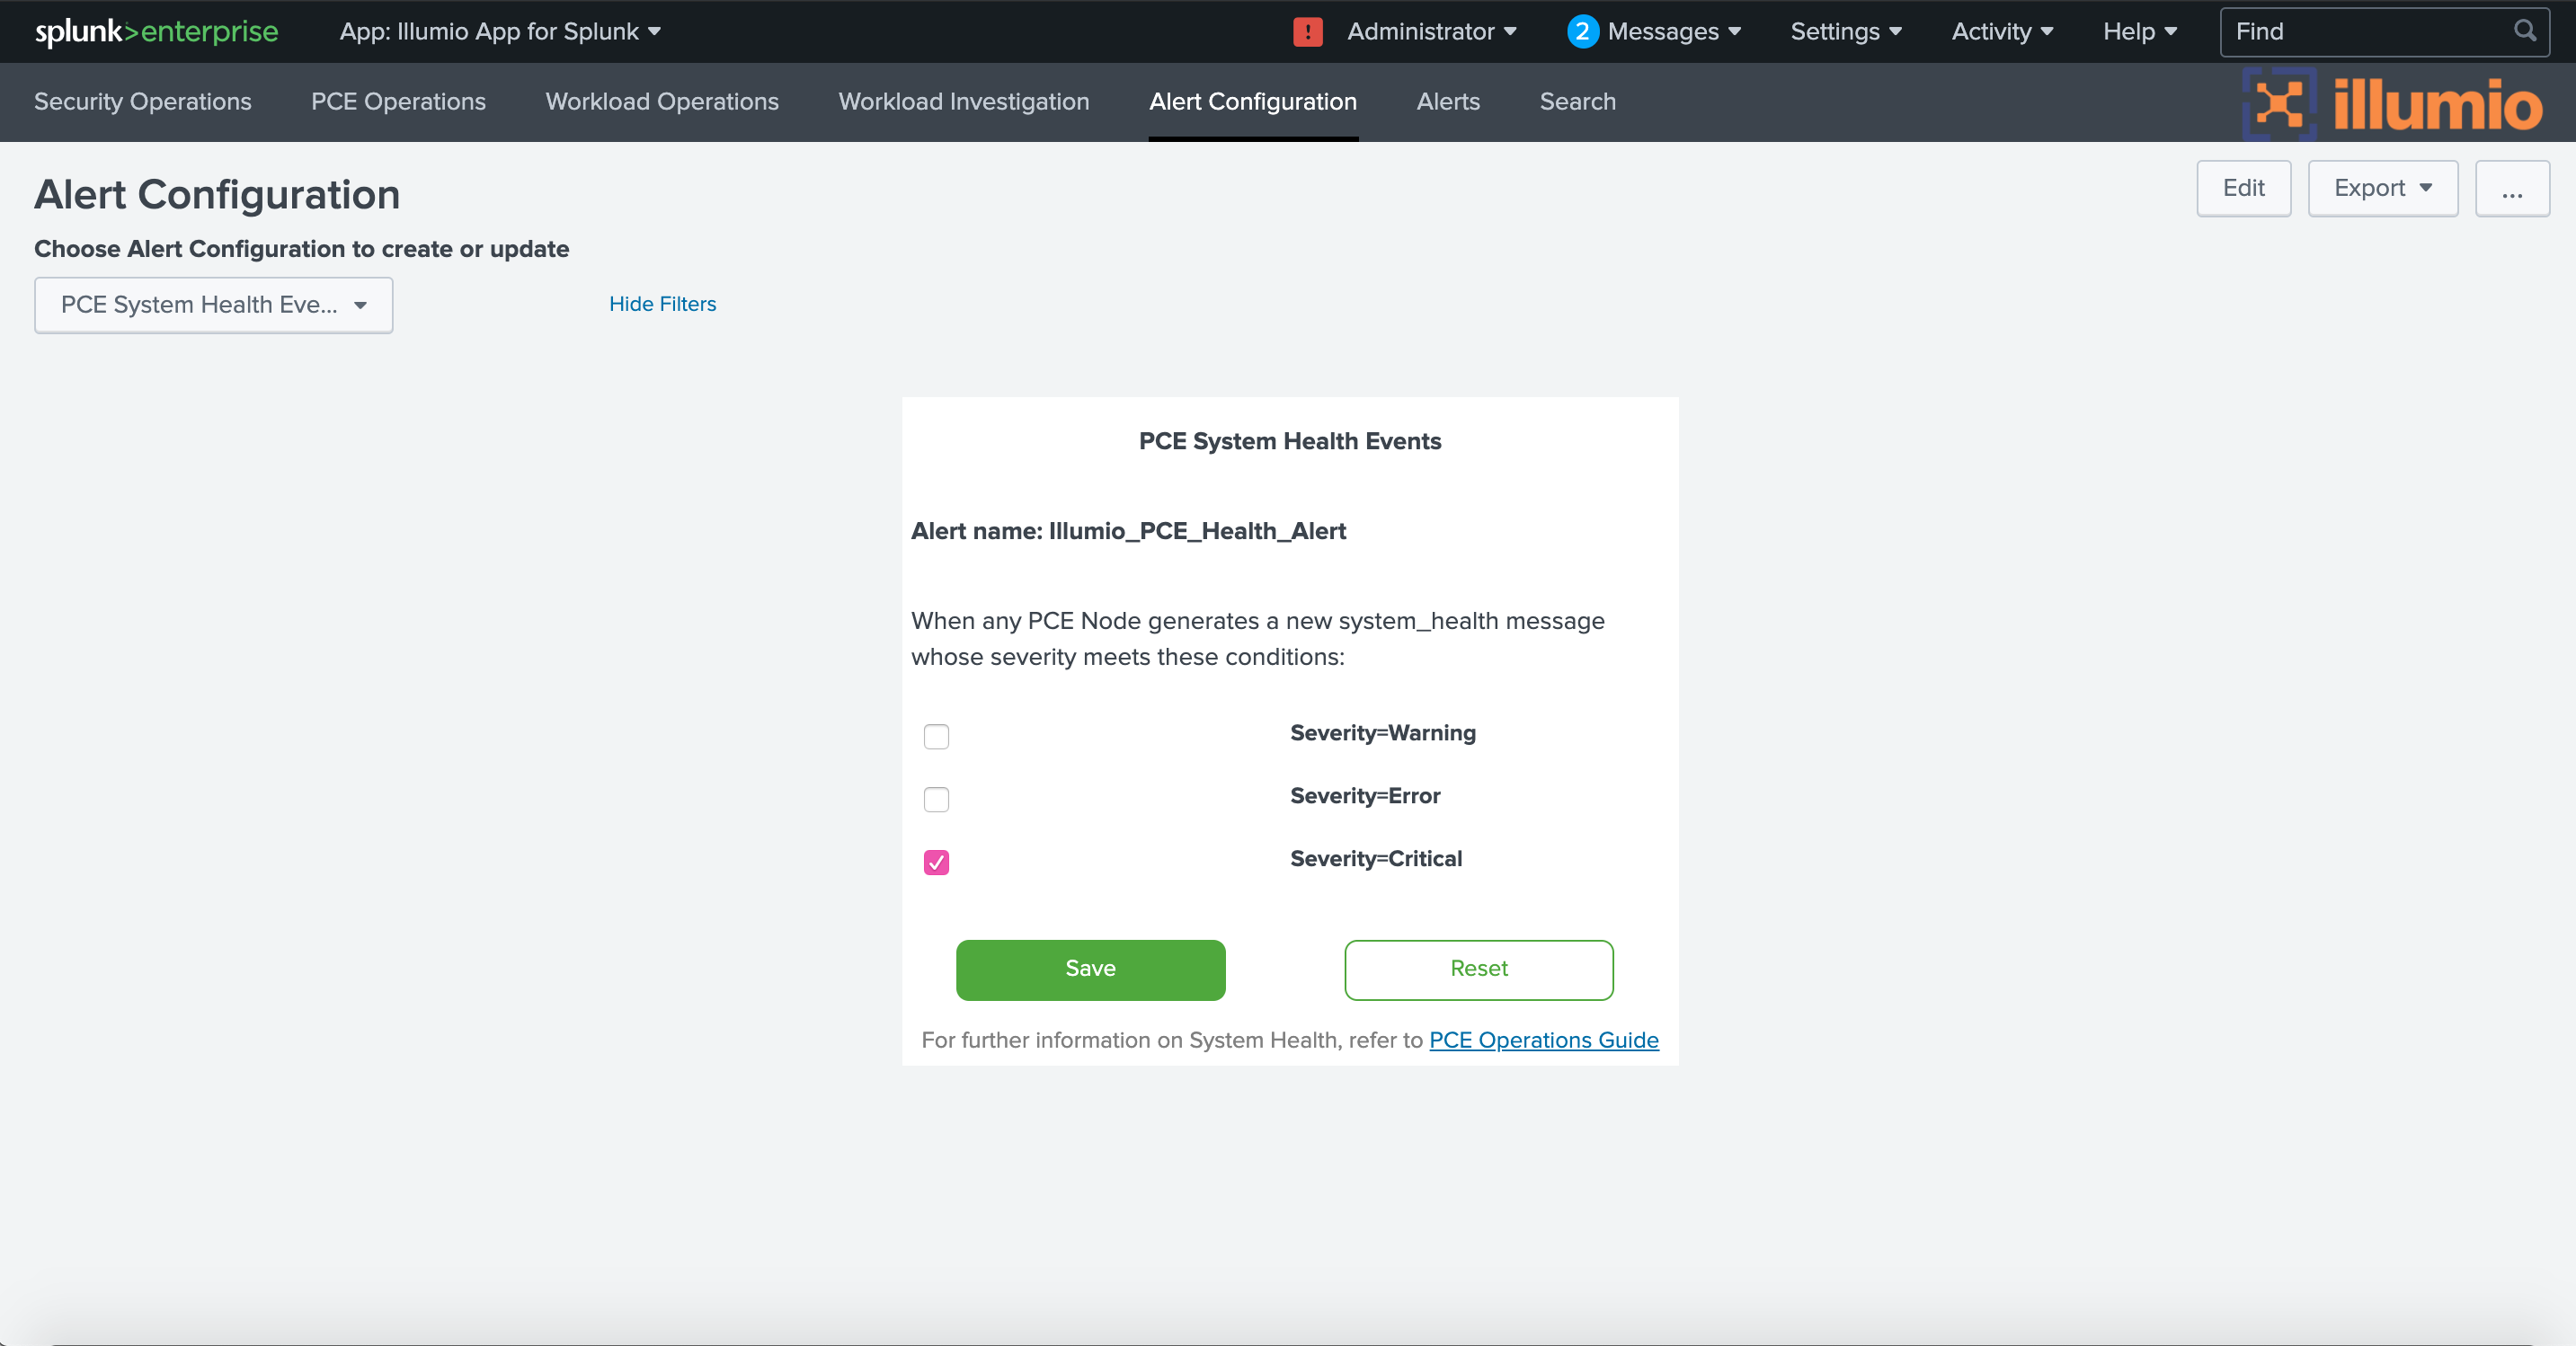
To configure alerts about system health events, choose PCE System Health Events from the drop-down, then choose which level of event severity to include (warning, error, or critical). For details on conditions that trigger event severity warnings, see the Monitor PCE Health topic in the PCE Administration Guide. (Download the zip file.)
 |
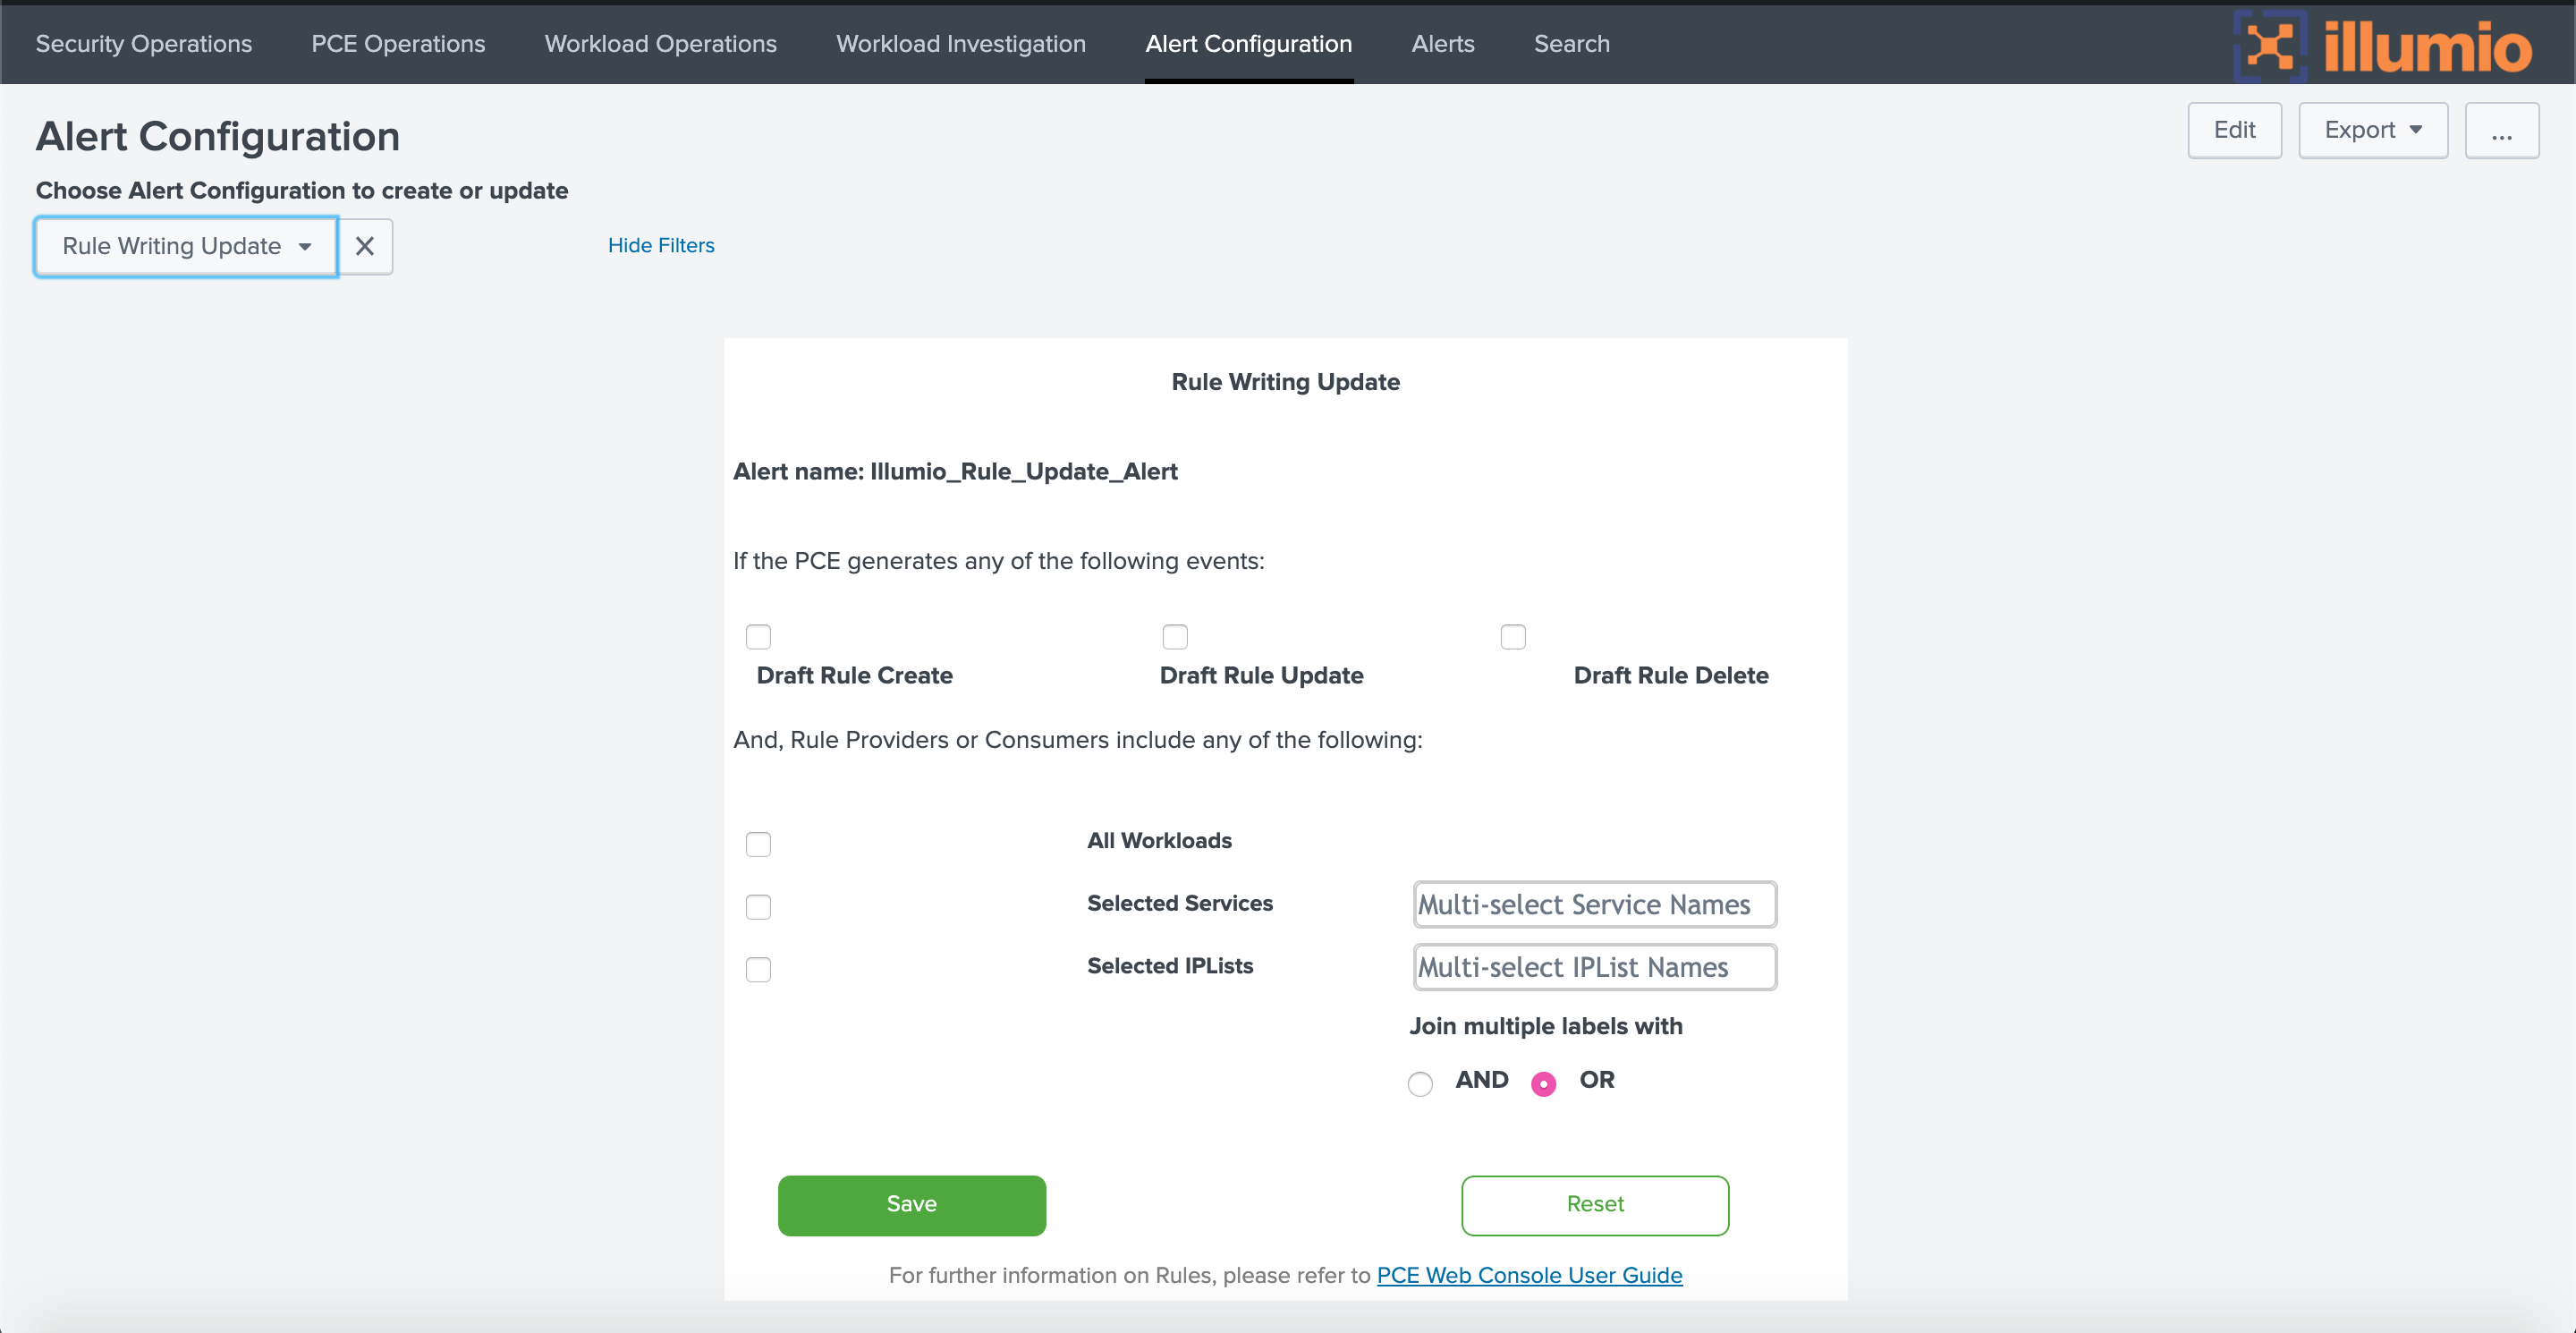
You can configure alerts about changes to rules on the PCE. For example, a draft rule might be created that affects all workloads. Because this is a very wide-ranging effect, which might have been unintentional, you might want to be alerted so you can confirm the rule is correct.
To configure alerts about changes to draft rules, choose Rule Writing Update in the drop-down, then choose which type of rule change to include (create a new rule, update a rule, or delete a rule, or any combination) and which rule providers or consumers to include (all workloads, or a subset based on service names or IP lists). Choose the AND operator if all the selected rule providers/consumers must be matched. Choose the OR operator to match any one provider/consumer from the selected list.
 |
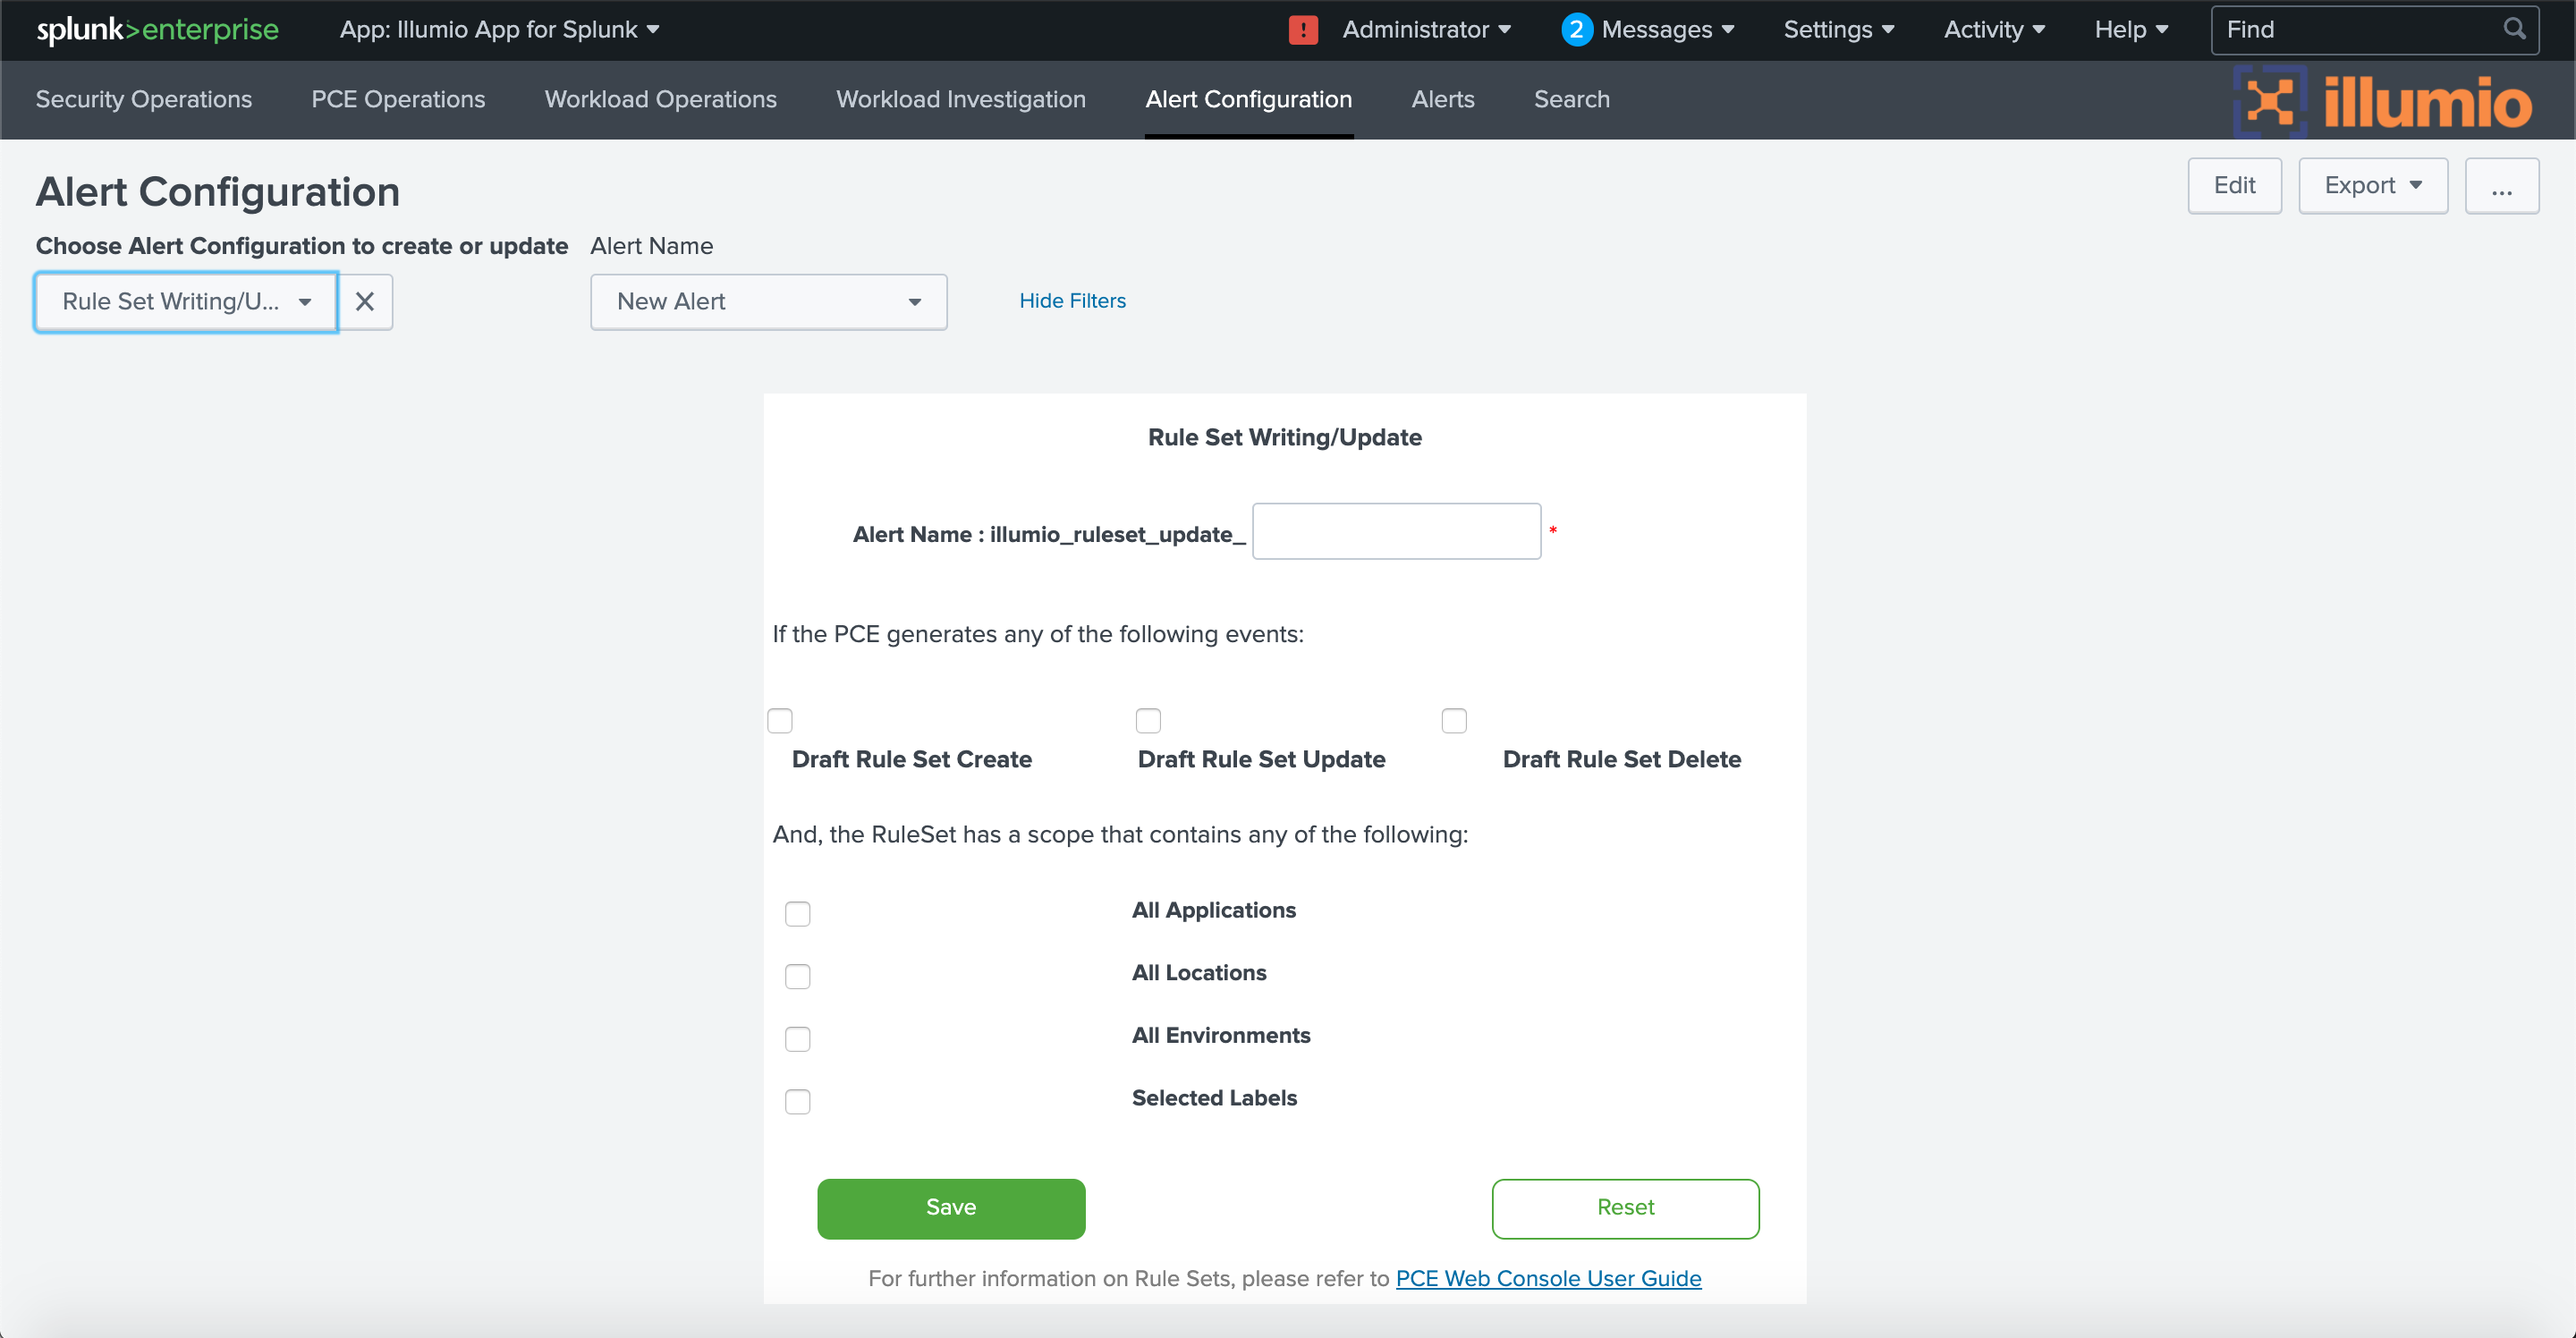
Similarly to rules, you can configure alerts about changes to draft rulesets on the PCE. For example, a draft ruleset might be created that has a broad scope. When provisioned, the ruleset might affect too many workloads unintentionally. It is useful to be alerted so you can confirm the ruleset’s scope is correct.
To configure alerts about new, changed, or deleted rulesets, choose Rule Set Writing/Update from the drop-down. In the Alert Name drop-down, choose New Alert if you are setting up a new alert, or choose the name of an existing alert if you want to make changes to its configuration. If you are creating a new alert, give it a name in the Alert Name field. Choose which type of ruleset change to include (create new ruleset, update a ruleset, or delete a ruleset) and which ruleset scopes to include (based on applications, locations, environments, or labels).
 |
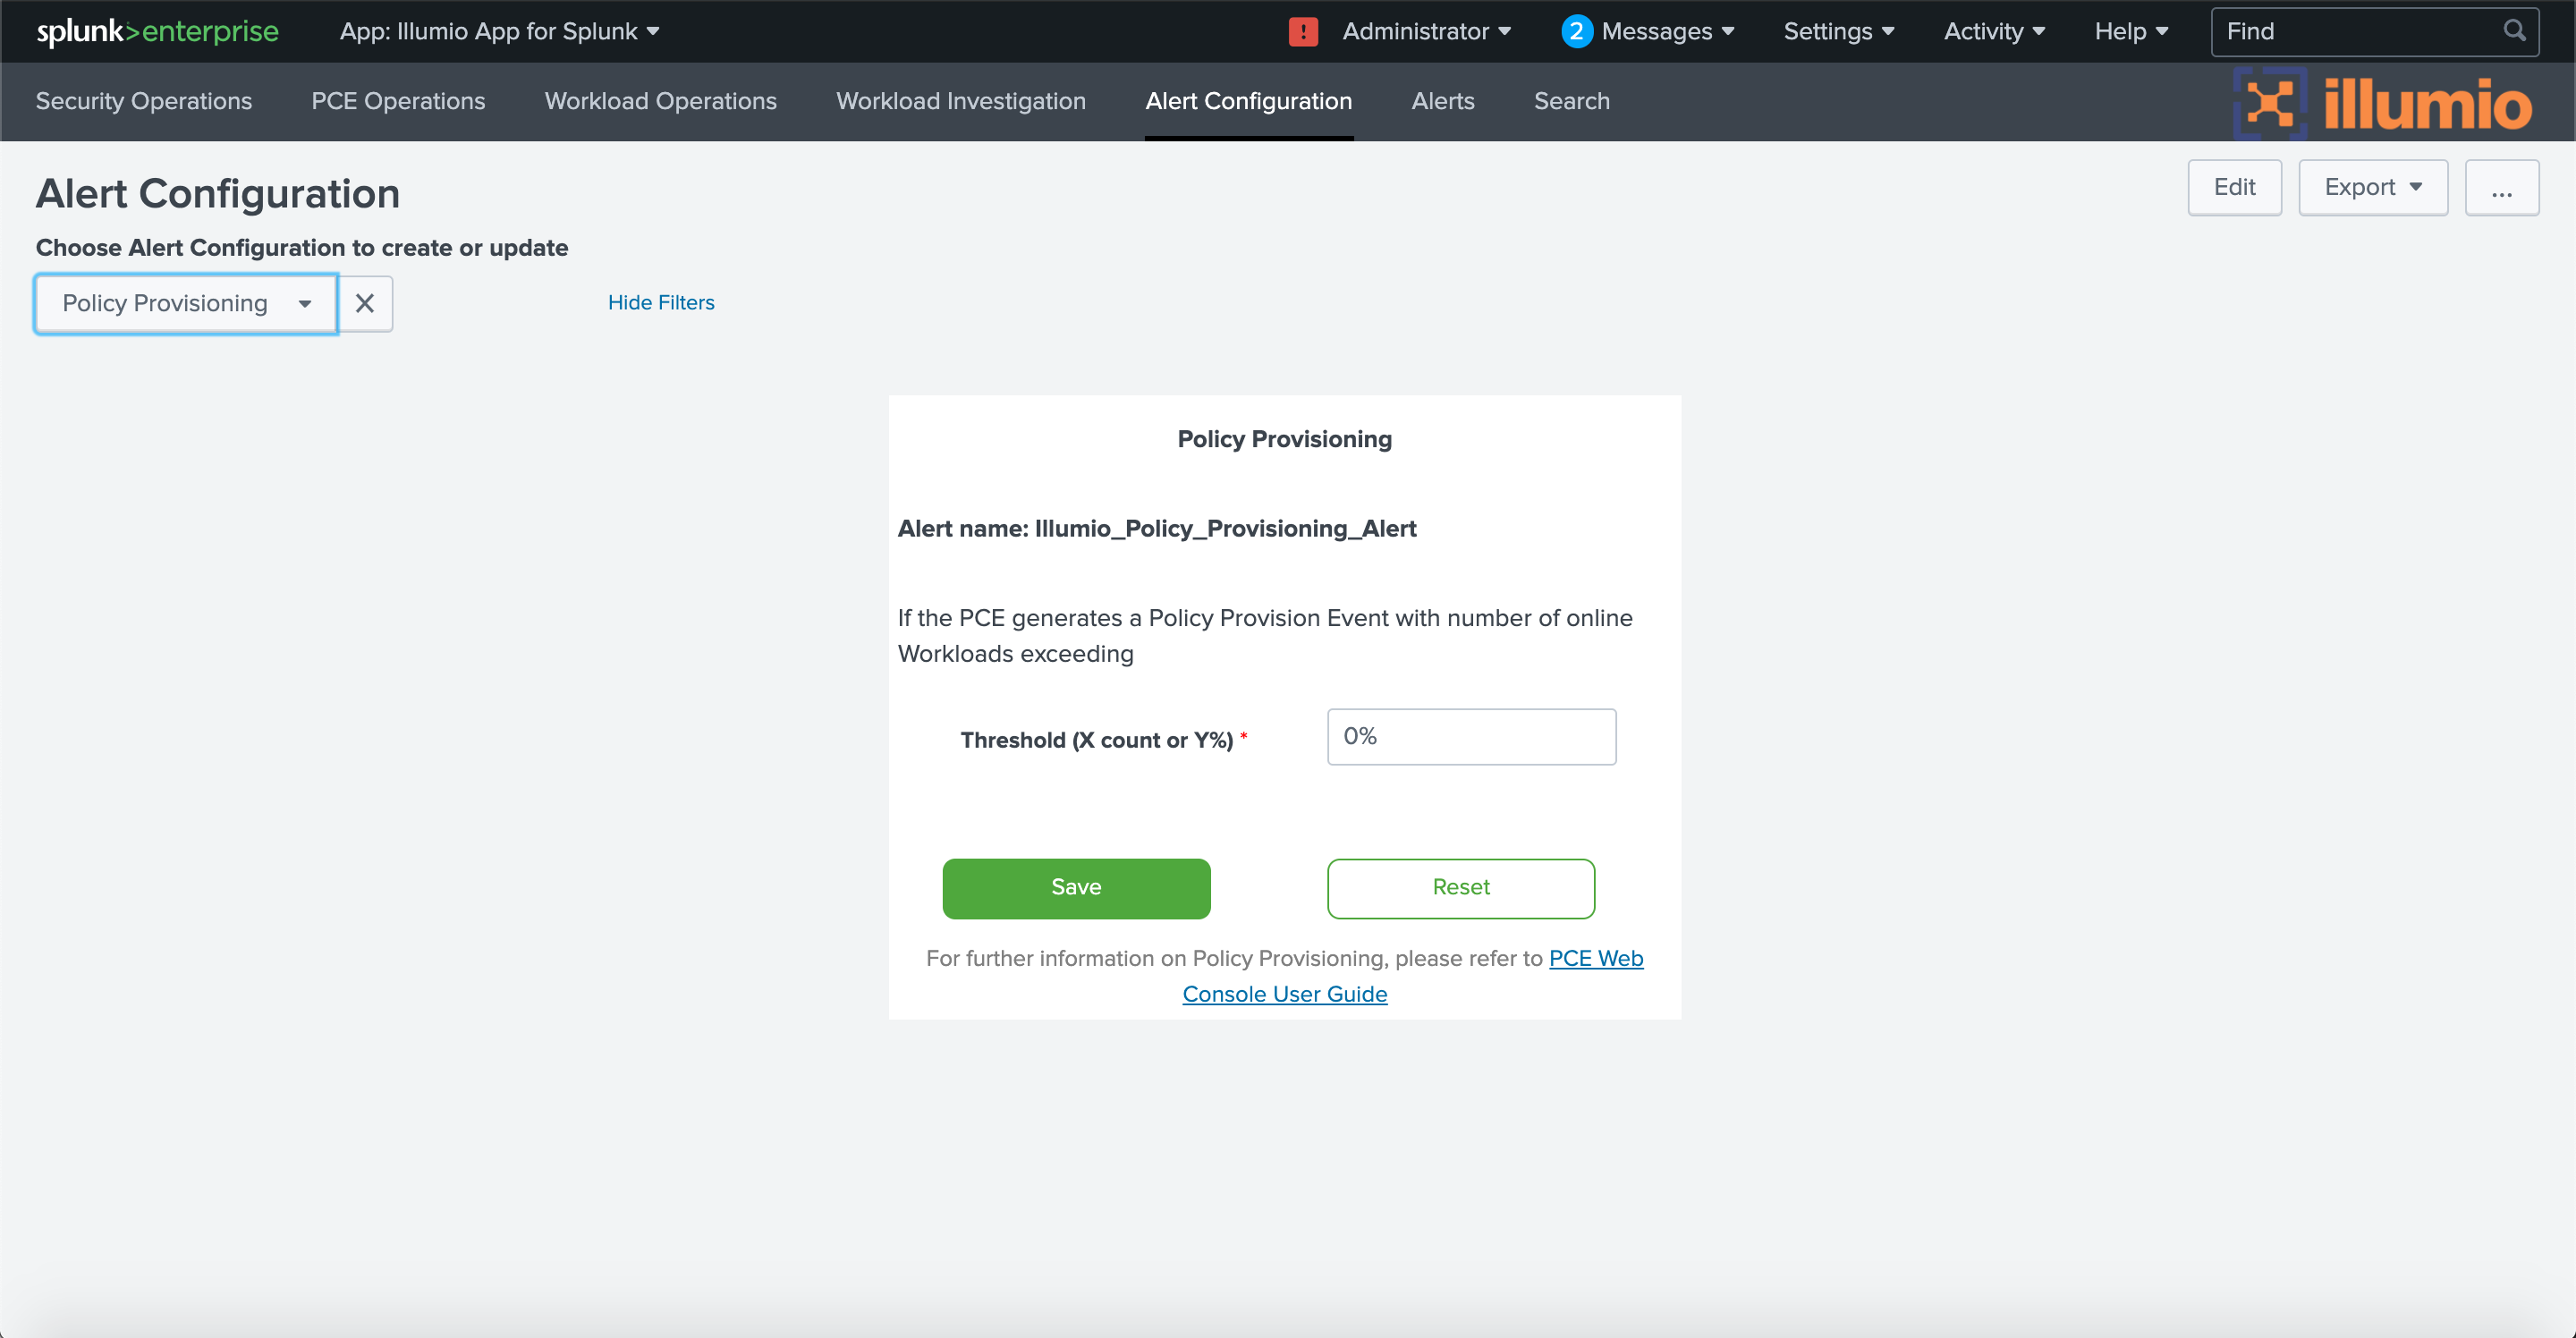
In PCE 19.1.0 and later, you can configure alerts to be triggered when new policies are provisioned. For example, you might want to know if a new policy is being provisioned to a large number of workloads.
To configure alerts about provisioning of new policies, choose Policy Provisioning from the drop-down, and then set the minimum number of workloads that must receive the provisioning. The number can be specified as an absolute number, such as 100, or a percentage, such as 10% of the workloads. To trigger the alert no matter how many workloads are involved, set the threshold to 0.
 |
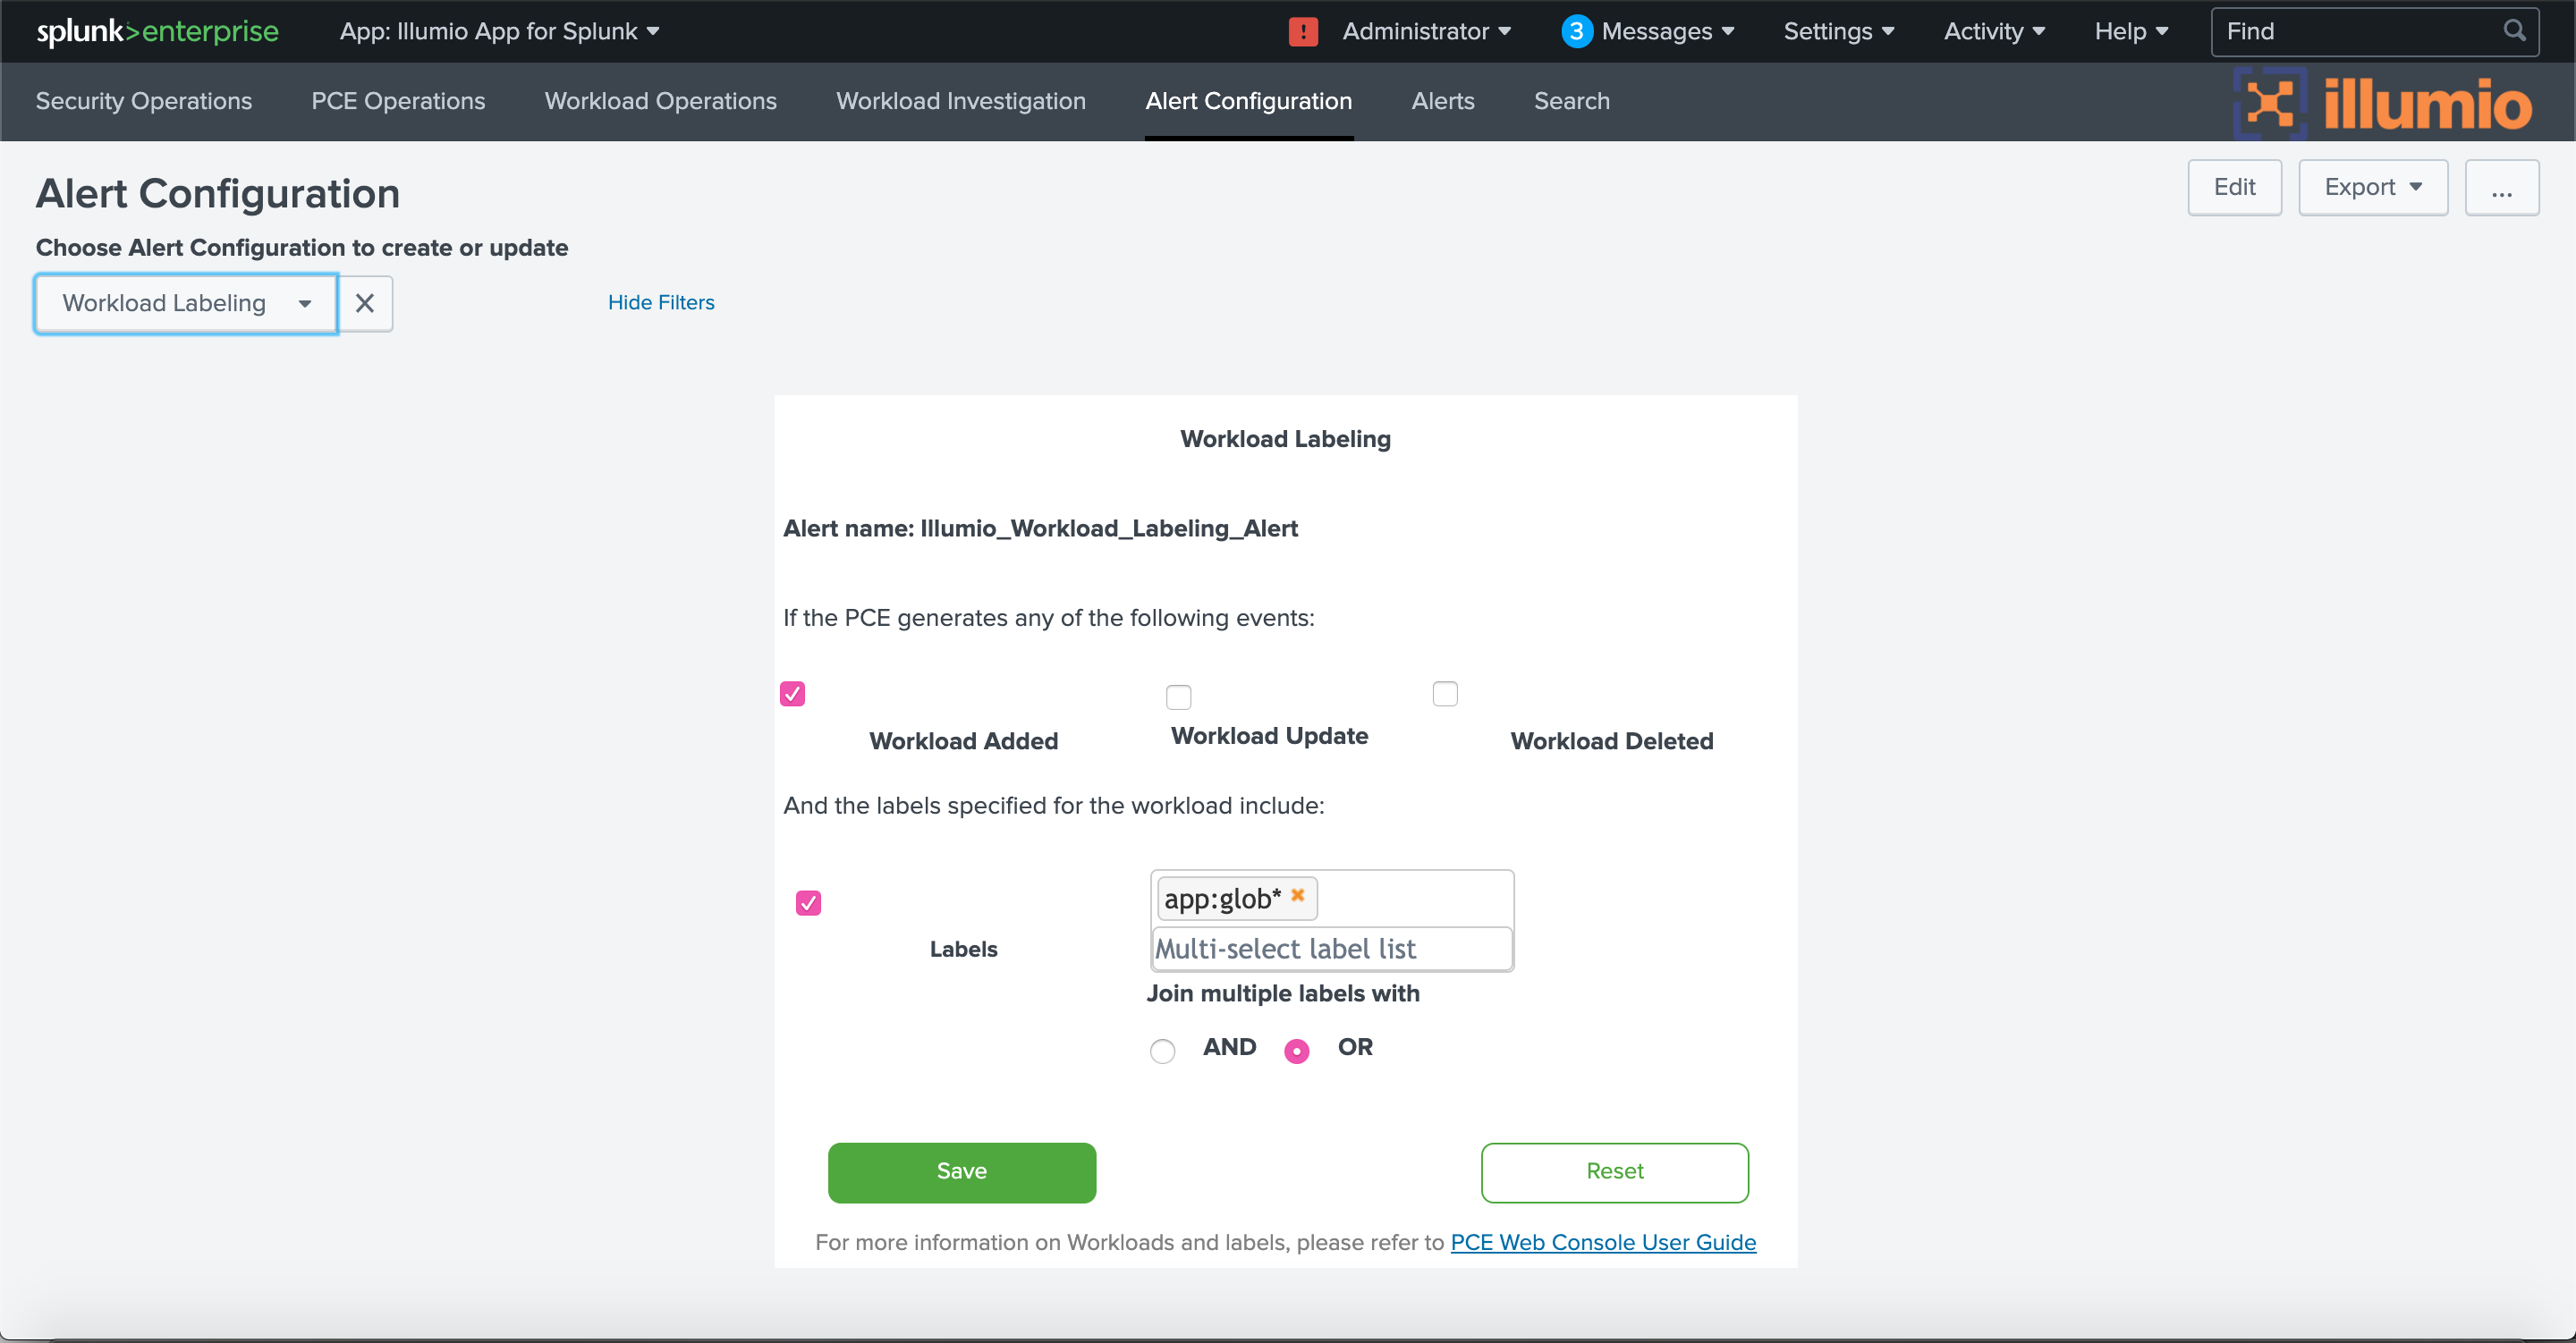
You can configure alerts about changes to workload labels. For example, it might be a reason for concern if a workload label is changed in a way that reduces the workload’s security posture, such as changing from “Production Top Secret” to “Internal Testing.”
To configure alerts about changes to workload labels, choose Workload Labeling from the drop-down, and then choose which type of change to include (add, update, or delete label) and which labels the workload must have. Choose the AND operator if a workload must have all the selected labels. Choose the OR operator to match any one label from the selected list.
 |
Post-Installation Required Settings
After installing and configuring the Illumio App for Splunk, adjust the following settings.
Accelerate the Data Model
The Illumio App for Splunk ships with the Illumio data model acceleration disabled, as required for Splunk app certification. After you install the Illumio App for Splunk, you need to enable data model acceleration, which is used for data visualization in the dashboards. See Data Model and Data Model Acceleration.
Update Search Macros for Custom Index
If you choose a non-default index, you need to update the search macros to use the custom index. See Index, Source, and Source Types.
Accelerate Data Model
The Illumio App for Splunk ships with the Illumio data model acceleration disabled, as required for Splunk App Certification. After installation, you must enable the acceleration of the data model, which is used for visualizations in the dashboards.
Update Search Macros for Custom Index
If you choose a non-default index, you must update the search macros to use the custom index. Use the steps in Splunk Index, Source, and Source Types.
Upgrade the Illumio App for Splunk and Illumio Technology Add-On for Splunk
You can upgrade the Illumio App for Splunk and the Illumio Technology Add-On for Splunk using the CLI or UI.
Upgrade through the CLI:
Download the tarball of the Illumio App for Splunk or Illumio Technology Add-On for Splunk from Splunkbase.
Stop the Splunk server.
Run the following command:
$SPLUNK_HOME/bin/splunk install app APP_NAME.tgz –update 1 –auth username:password
Start the Splunk Server.
If you are upgrading to Splunk 3.0 from a previous version of the app, rebuild the data model after you install the app. See Data Model and Data Model Acceleration.
If you are upgrading to Splunk 3.0 from a previous version of the app, remove any customizations you have made to the app in the local directory.
Upgrade through the Splunk UI:
Click Manage Apps.
Locate the Illumio App for Splunk and Illumio Technology Add-On for Splunk in the list. If a newer version is available, an "Update to" entry displays.
Click the link of the newer version under the version column.
If you are upgrading to Splunk 3.0 from a previous version of the app, rebuild the data model after you install the app. See Data Model and Data Model Acceleration.
If you are upgrading to Splunk 3.0 from a previous version of the app, remove any customizations you have made to the app in the local directory.
Upgrade using installation files:
Click Manage Apps.
Click Install App from File.
In the dialog, upload the SPL file that corresponds to the newer version of the app.
Select the Upgrade App checkbox.
Click Upload.
Restart Splunk after uploading both the TA and app.
If you are upgrading to Splunk 3.0 from a previous version of the app, rebuild the data model after you install the app. See Data Model and Data Model Acceleration.
If you are upgrading to Splunk 3.0 from a previous version of the app, remove any customizations you have made to the app in the local directory.
About Alerting Actions and the Adaptive Response Framework
Quarantine Workloads Using Splunk Core Alert Actions
If Splunk Enterprise Security Suite (ESS) is not installed in your Splunk infrastructure, the Illumio App for Splunk offers a way to monitor and take action on the events reported by analytics on Illumio PCE logs.
To achieve this, the Illumio Add-On for Splunk leverages the custom alert action to quarantine the workload. These actions are available on the drilldowns from the main dashboards.
Quarantine Workloads Using Enterprise Security Suite
Splunk provides the Splunk Enterprise Security Suite (ESS), which leverages Splunk’s Adaptive Response Framework and allows administrators to monitor and manage threats and incidents directly from Splunk apps. It has rich dashboards that help monitor incidents and take actions on these incidents.
Splunk Enterprise Security Suite is extendable by adding a compatible Module App (Adaptive Response Add-ons) for a particular domain or technology. The Suite detects configurations in these Adaptive Response Add-ons and helps monitor and take actions on the incidents reported by these Add-ons.
The Illumio Add-On for Splunk (TA-Illumio) is one such module for Splunk Enterprise Security Suite. It leverages the Splunk Adaptive Response Framework and empowers system administrators to monitor and take actions on incidents reported by analytics on Illumio PCE events or logs from the Splunk Enterprise Security Suite dashboards.
When using the Splunk Enterprise Security (ES) suite, the Illumio Splunk TA can be installed on a single ES Search Head (SH), or on both an ES SH and an associated ES Search Head Cluster (SHC). This allows the Adaptive Response to be invoked from any installed TA location. The Illumio data is stored on the indexers only, and not on the search head nodes, so the data is not duplicated. If the TA is installed only on a single ES SH, the data is normalized for the associated SHC.
The Incident Review dashboard:
 |
As a part of the Adaptive Response Framework, Splunk has enhanced this Incident Review dashboard in the Enterprise Security Suite app, which provides the option to take actions on these notable events.
To view the notable event details, expand the left arrow for that notable event. To execute alert actions manually for each of the notable events, click Run Adaptive Response Actions for the notable event and select the specific Alert Action.
 |
When you click Run Adaptive Response Actions for a notable event, a menu appears that lists all of the standard and custom actions. This list is created by reading the alert_actions.conf files of all the installed apps on the Splunk instance. Users can select multiple actions on this popup menu and run them for that notable event.
 |
 |
 |
When these actions are run, each selected corresponding action is invoked from alert_actions.conf.
Quarantine Workloads from the Illumio Splunk App
If you have both the admin role and the Illumio_quarantine_workload role, you can quarantine workloads from the Illumio Splunk App by clicking the Quarantine button, which appears on the following dashboards:
Port Scan (on the Security Operations dashboard)
Firewall Tampering (on the Security Operations dashboard)
If the Quarantine button is greyed out, then you do not have adequate permissions to quarantine workloads. See Access to Quarantine Workload Action.
 |
Provide Access to the Quarantine Workload Action
By default, users do not have access to the Quarantine Workload action either in the Splunk App or in Adaptive Response Action.
To enable a Splunk user to take quarantine actions on Workloads, grant the user the Illumio_quarantine_workload role and the admin role. Only local users can be granted this role. SAML users cannot, because their roles are controlled by an external system.
Click Settings > Access Control.
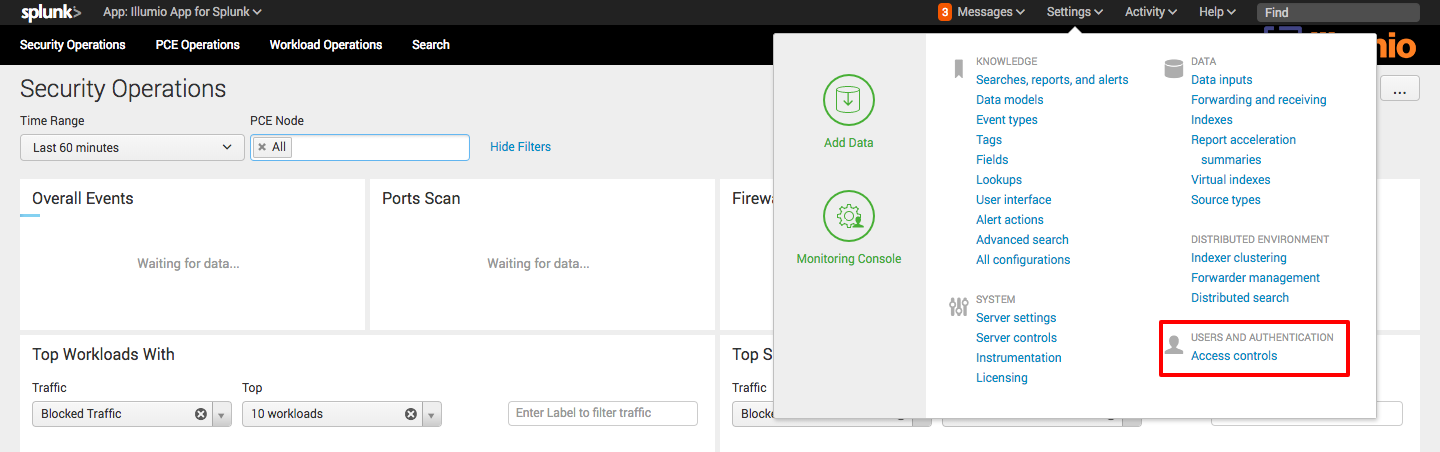
Click Users.

Click the username to which the role needs to be granted.
In the Role section of the edit screen, grant the required roles.
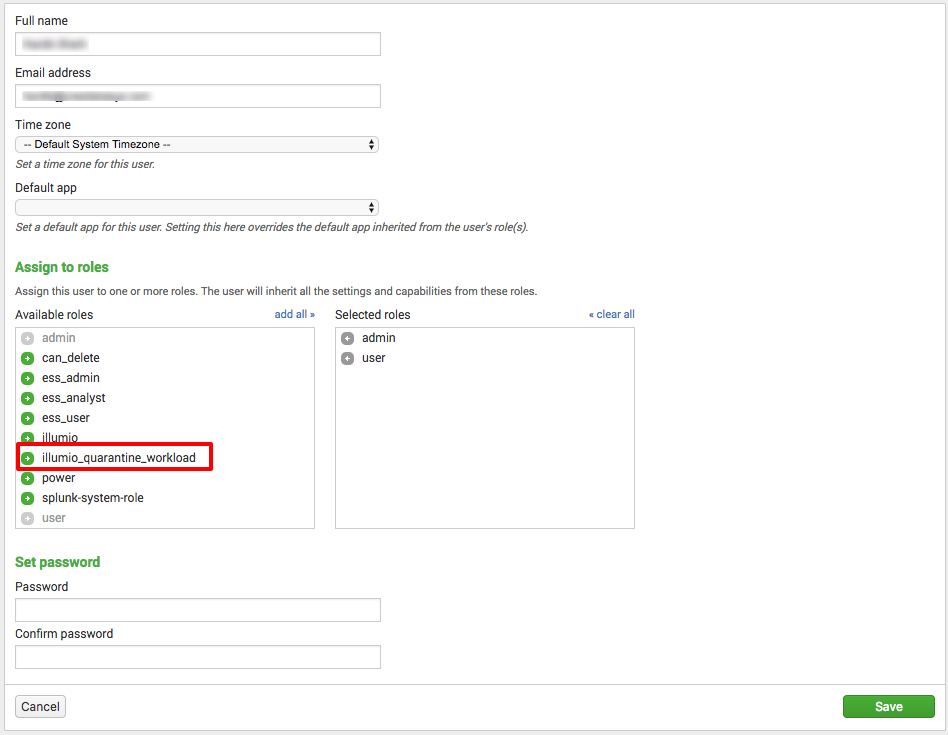
Click Save.
Example Splunk Queries
This section provides sample queries to help you get started writing your own Splunk queries using Illumio data.
Workload Report Query
This is a fairly complicated query, but you can use it to generate a workload reports that shows the labels associated with each workload. You can export the results to a .csv file for reporting.
`illumio_get_index`
sourcetype="illumio:pce:metadata"
(illumio_type="illumio:pce:workload") | search
"agent.href"="*" fqdn="*" | rex field=href
"orgs\/\d+\/workloads\/(?<workload_uuid>\S+)" | fields
labels{}.href uuid hostname os_id public_ip agent.config.mode
agent.config.log_traffic agent.status.status workload_uuid | mvexpand
labels{}.href | rename labels{}.href as href | lookup
illumio_workload_mapping_lookup href workload_uuid OUTPUTNEW type label | eval
{type}_label=label | stats values(*) as * by workload_uuid | table hostname,
public_ip, os_id, agent.config.mode, agent.config.log_traffic,
agent.status.status, role_label, app_label, env_label, loc_label
Top Events Query
`illumio_get_index` sourcetype="illumio:pce" | top event_type
Top Outgoing Connections Query
sourcetype="illumio:pce:collector" | search dir=O | top dst_ip
Top Incoming Connections Query
sourcetype="illumio:pce:collector" | search dir=I | top src_ip
Most Active Machines
sourcetype="illumio:pce:collector" | search dir=I | top dst_ip
Top Source Ports
sourcetype="illumio:pce:collector" | top dest_port
Top Machines with Connections in a Given Network
This example query returns the top machines with connections in 10.0.0.0/8:
sourcetype="illumio:pce:collector" | search dst_ip=10.0.0.0/8 | top dst_ip
Geolocate Destination IPs
The following query plots destination IPs on a map:
sourcetype="illumio:pce:collector"  | search dst_ip!=10.0.0.0/8 | iplocation
dst_ip | geostats count latfield=lat longfield=lon
Troubleshooting
This section provides tips to diagnose and fix common issues.
Data Collection Not Working
After installing the application, all dashboards should start populating data. If you don’t see data in the dashboards, use the following steps for troubleshooting:
If you specified a non-default index in the Data Input, confirm that you have modified the
`illumio_get_index`macro with indexes selected while creating Data Inputs (Modular inputs) and that you have modified the Advanced search for either the default index or your custom index. See Index, Source, and Source Types.Run the following query to verify that data is being indexed into Splunk:
search `illumio_get_index` | stats count by sourcetypeVerify that
SPLUNK_HOMEis pointing to the correct Splunk directory.Look for errors in the
ta-illumio.logfile. This file is in the$SPLUNK_HOME/var/log/TA-Illumio/folder.Check to see whether the selected time range covers the time when the traffic flow summaries were generated.
If data model acceleration is disabled, graphs will not display. Enable data model acceleration. See Accelerate Data Model.
Can’t Use Same Port in New Data Input (Modular Input)
Symptom: After deleting an existing configured data input (modular input), you can’t create a new modular input on the same port.
Cause: The port number is still in the Data Input TCP ports list.
Fix: Remove the port from the Data Input “TCP” ports list before you try to use the same port again. This enables you to reuse the port which was configured in the previous data input (modular input).
Data Not Available Immediately After Configuring Data Inputs (Modular Inputs)
Symptom: Upon successful creation of data inputs (modular inputs), 5 minutes elapse before data starts indexing.
Cause: 5 minutes is the default time interval configured.
Fix: No action is required. This is expected behavior.
Authentication Failure on Data Input (Modular Input) page
Check the network connectivity in between applications to ensure that there are no connectivity issues.
Ensure that the API Key and API Secret stored in the setup page are in sync with the API key generated by the Illumio PCE. As required by App certification, these secrets are stored in a secure key store. If the data input (modular input) is modified, they will need to be entered again, because they cannot be read back from the secure key store.
If the Illumio application is deployed on a non-trusted CA or using a self-signed certificate, you need to provide the certificate directory path. You also need to provide the correct certificate validation trust chain to the certificate.
Quarantine Button Grayed Out or Does Not Work As Expected
Cause: For a user to be able to use the Quarantine button, the Splunk user needs to have both the admin role and the illumio_quarantine_workload role. If the button is green but does not work as expected, it is likely because of a missing admin role. To investigate the cause, check the ta-illumio.log file for error messages.
Fix: To grant the required roles, use the steps in Access to Quarantine Workload Action.
Invalid Certificate File Error on Data Input (Modular Input) Page
Cause: The PCE may present an SSL certificate issued by different authorities such as a primary CA, a secondary CA, a local CA authority or even a self-signed certificate. For correct SSL operation, the Splunk server must be able to fully trust the PCE’s certificate and verify the certificate’s trust chain.
Fix: When a local CA Authority issued SSL certificate or a self-signed SSL certificate is used with the PCE, you need to upload the CA Certificate bundle onto the Splunk Server and provide the full path to the directory that contains the certificate in the data input.
If using a local CA Authority or a certificate issued by a secondary CA, the Splunk server CA trust chain must be updated to verify the certificate presented by the PCE.
For example, on Linux, use the update-ca-trust tool. Copy the certificate chain to /etc/pki/ca-trust/source/anchors/ and then run the following commands:
update-ca-trust force-enable
update-ca-trust extract
update-ca-trust check
See Splunk documentation for further information.
PCE labels Are Not Updated in the Security Operations Dashboard
Symptom: If there are new labels, or workloads are added to the PCE, the new labels and workloads will not be visible right away.
Cause: The default interval to sync workloads and labels from the PCE is set to a minimum of 60 minutes. This period is configurable through the data input. The newly added labels or workloads on the PCE should be available in the Splunk App after an interval of 60 minutes.
Fix: To force a resync of labels to the PCE, you can disable and enable the TA. This forces the TA to make API calls to the PCE. This operation should be used with caution because of the additional API calls to the PCE.
Security Operations Shows “Search is waiting for input”
Symptom: When upgrading an older version of the app, the Security Operations panels do not display graphs. Instead, they display "Search is waiting for input ...".
Cause: Old dashboard files are stored locally on the Splunk server.
Fix:
Delete the
$SPLUNK_HOME/etc/apps/IllumioAppforSplunk/localfolder.Restart Splunk.
Path for the Custom Certificate: Invalid Certificate File
Symptom: An error is generated in the Policy Compute Engine (PCE) ta-illumio.log file when attempting to add Illumio Data Inputs. Saving any information for the Data Inputs is not allowed.
Error from the /opt/splunk/var/log/TA-Illumio/ta-illumio.log file:
2018-10-24 16:33:48,844 - Illumio_MODINPUT - ERROR - Path for the custom certificate:
Invalid certificate file
A Splunk error, due to PCE certificate trust, is also displayed:
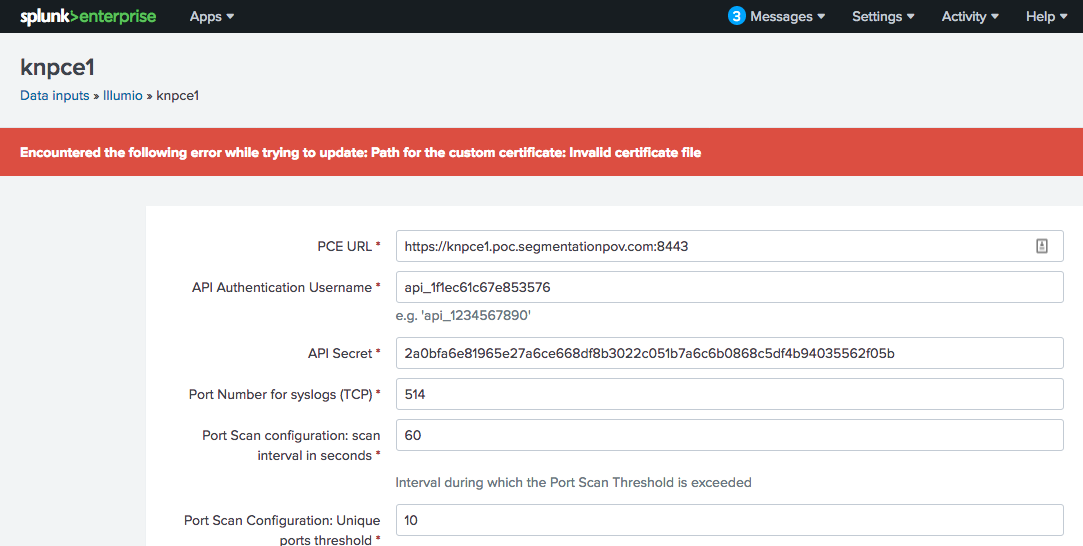 |
Cause: This error is an indication that a PCE certificate was not trusted, even though the certificate has already been added to the local system certificate store.
Fix: Adding Illumio Data Inputs allows the Illumio App for Splunk to connect to a configured PCE to extract data for PCE health and workloads information. When the Illumio App for Splunk attempts a connection to the PCE, it can fail due to a certificate trust even when a local browser trusted the PCE certificate, since it was already added to the local system certificate store. Splunk uses a Python library that is local to the Splunk application, so it carries its own local certificate authority file that it trusts.
There are two ways to add a secure trust to the PCE:
Add both intermediate and root certificate authority to the local Python
cacert.pemfile:In Windows:
C:\Program Files\Splunk\Python-2.7\Lib\site-packages\requests\cacert.pemIn Linux:
/opt/splunk/lib/python2.7/site-packages/requests/cacert.pem
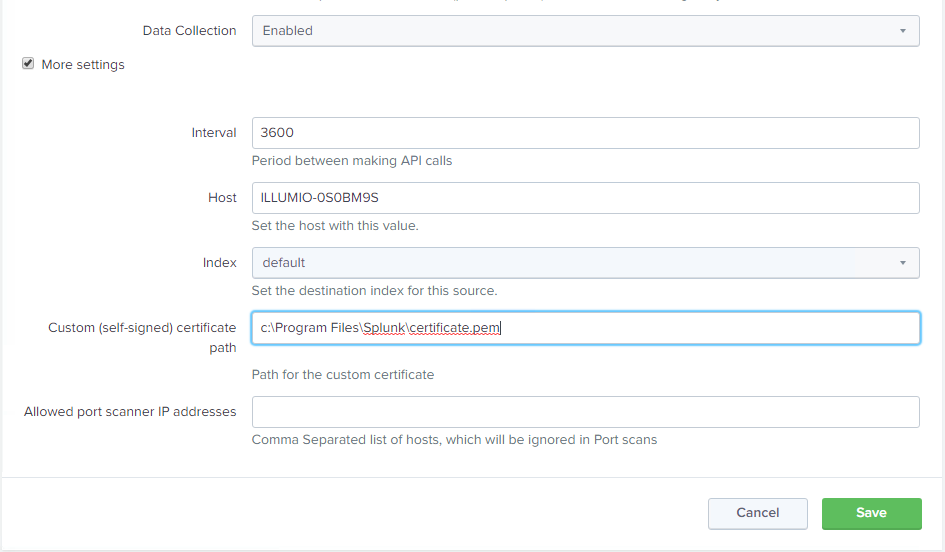
You can also create a certificate file that includes the PCE server certificate, intermediate certificate, and root CA certificate in that order, and then place the file in the Splunk home directory. The certificate should be in PEM format. Use the following steps:
Use a text editor to cut and paste the certificate chain and avoid extraneous characters. The Splunk home directory is as follows:
Windows Splunk home directory:
C:\Program Files\Splunk\Linux Splunk home directory:
/opt/splunk/
Export the certificates using any browser, and then cut and paste them together. The following is an example of what should be in a certificate file:
-----BEGIN CERTIFICATE----- < Server Certificate base64 encoded >
-----END CERTIFICATE-----
-----BEGIN CERTIFICATE-----
< Intermediate Certificate base64 encoded >
-----END CERTIFICATE-----
-----BEGIN CERTIFICATE-----
< Root CA Certificate base64 encoded >
-----END CERTIFICATE-----
To set the path in the Illumio Data Inputs, navigate to Settings > Data Inputs > Illumio, select the input, check the More settings checkbox, and provide the path to the certificate in the Custom (self-signed) certificate path field.
Authentication Failed: Invalid PCE URL or API Key Id or API Secret
Symptom: When applying data inputs in Splunk for the Illumio App for Splunk, you receive the following error from the Splunk UI: “Authentication Failed: Invalid PEC URL or API key id or API Secret.”
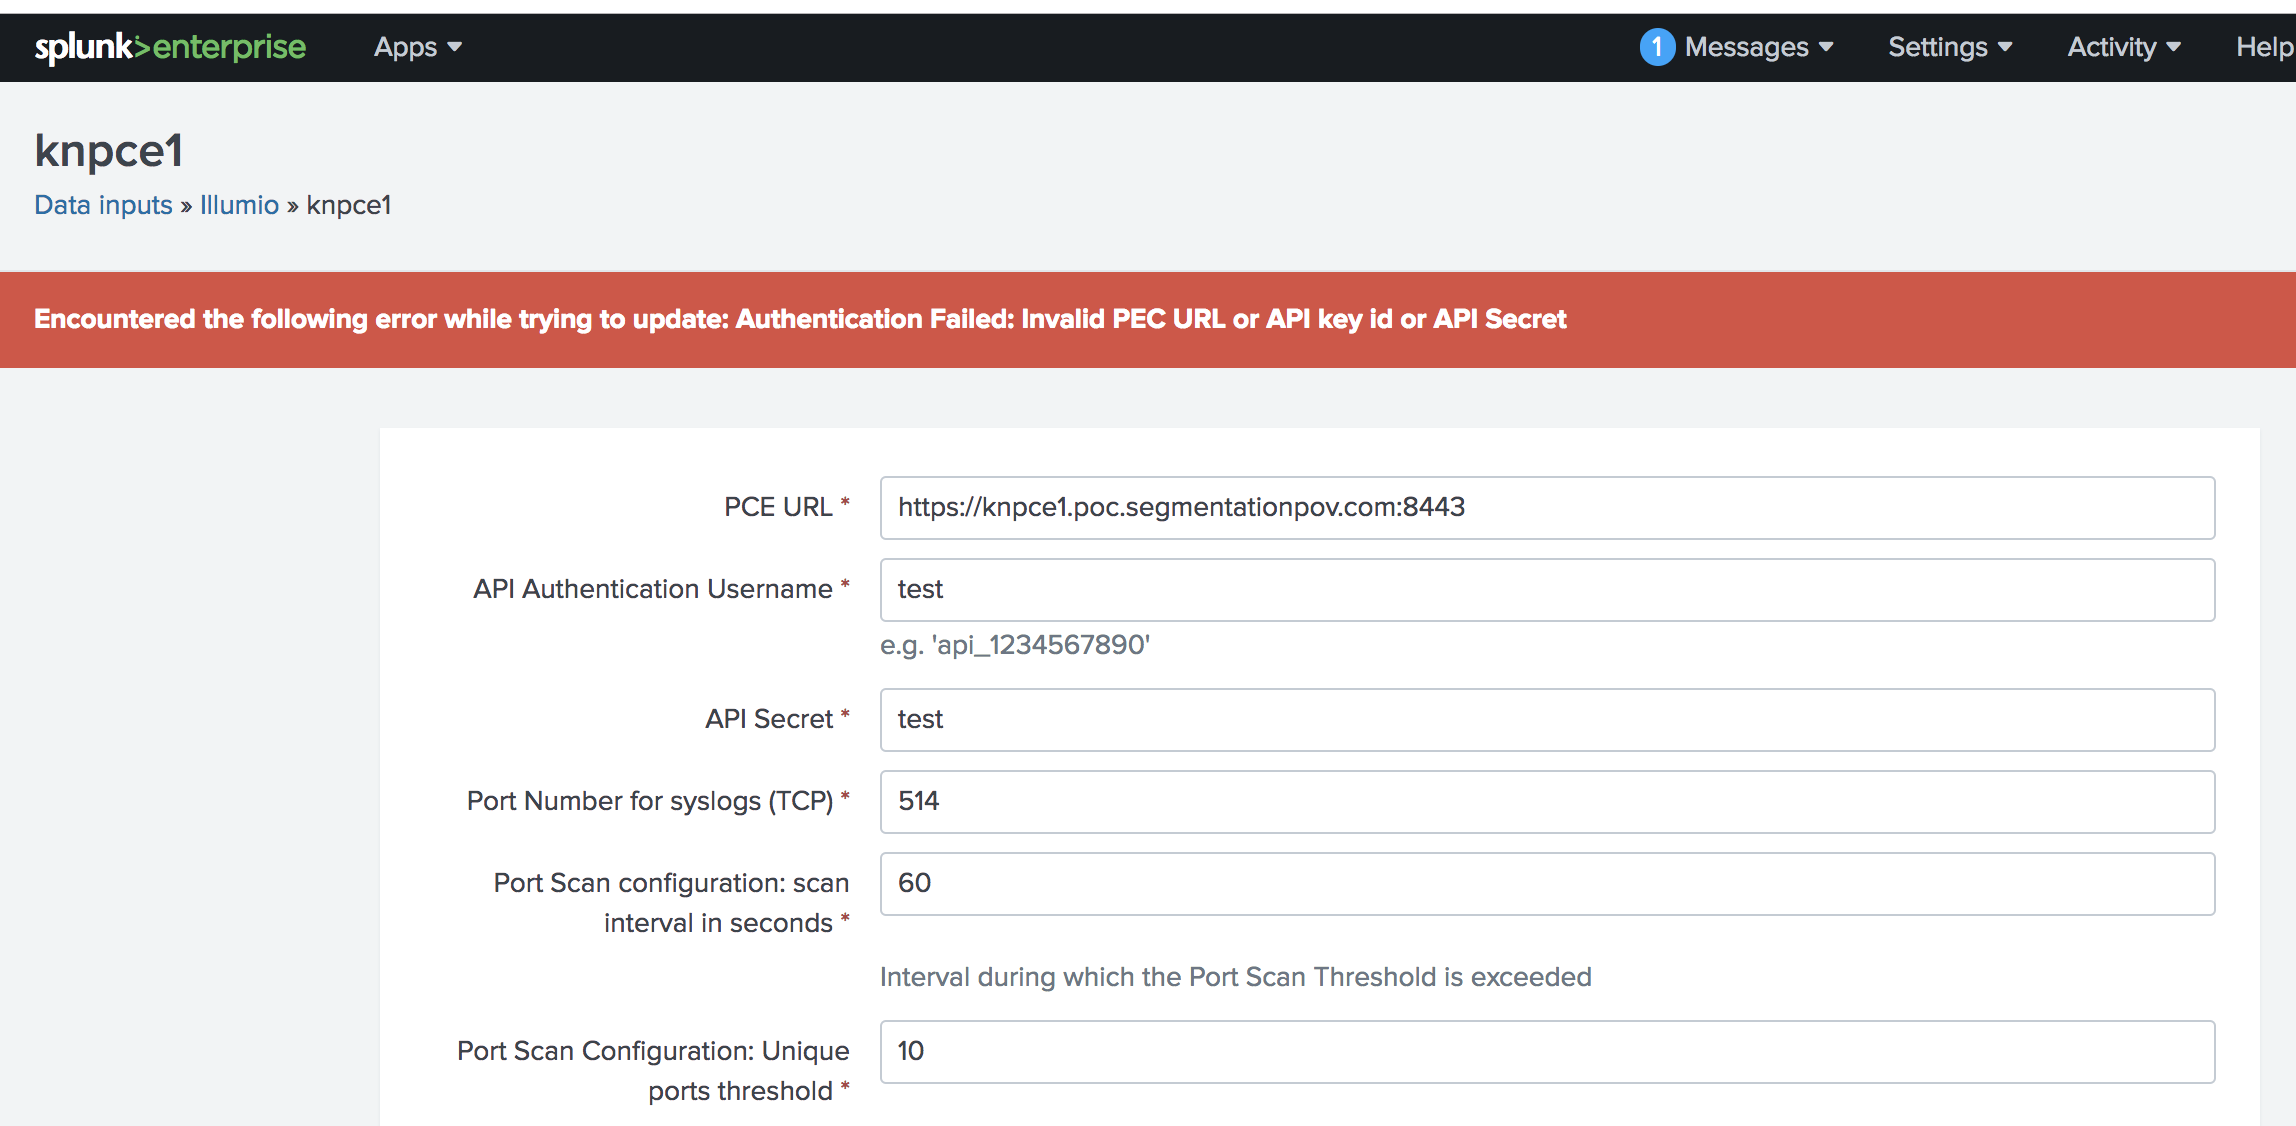 |
The error also appears in the /opt/splunk/var/log/TA-Illumio/ta-illumio.log file.
Cause: This error is caused by an authentication issue to the Policy Compute Engine (PCE). When this occurs, data inputs will not be saved until a valid API response is received from the PCE with the correct API Authentication username and API secret.
Fix: To validate an authentication failure, look at the PCE core node haproxy logs, which will show a 401 auth failure HTTP response (highlighted in yellow in the example below):
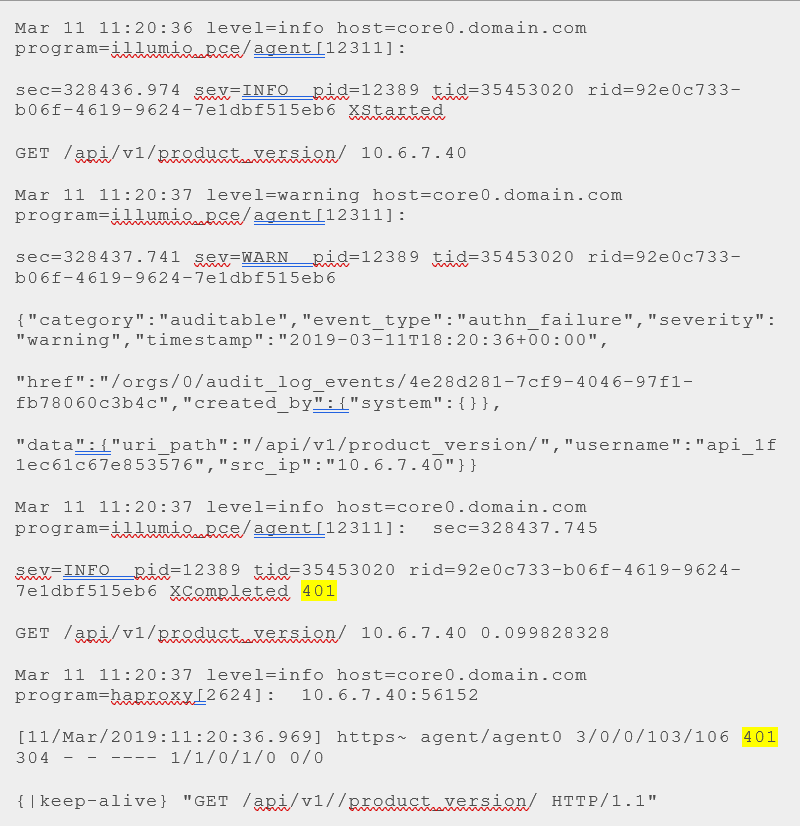
To see whether the API username/secret is correct, use the cURL command below and validate it with the logs from PCE core nodes:
Copy and paste the curl command below with the correct API username/secret:
- - - Begin copy (change api username/secret) - - -
curl \
-u \
api_1f1ec61c67e853576:2a0bfa6e81965e27a6ce668df8b3022c051b7a6c6b
0868c5df4b94035562f05b
\-H Content-Type:application/json \
-X GET \
'https://pcecore0.domain.com:8443/api/v1//product_version/' \
| python -mjson.tool
- - - End copy - - -


Successful curl request logs from PCE core nodes with 200 http response code:

Mar 11 11:45:44 level=info host=core0.domain.com
program=illumio_pce/agent[23340]:  sec=329944.610 sev=INFO

pid=23408 tid=24064620 rid=063accb6-7036-46f0-96a1-8726f14436ea
XStarted GET /api/v1/product_version/ 10.6.7.40

Mar 11 11:45:44 level=info host=core0.domain.com
program=illumio_pce/agent[23340]:  sec=329944.734 sev=INFO

pid=23408 tid=24064620 rid=063accb6-7036-46f0-96a1-8726f14436ea
XCompleted 200 GET /api/v1/product_version/ 10.6.7.40
0.124496975

Mar 11 11:45:44 level=info host=core0.domain.com
program=haproxy[2624]:  10.6.7.40:56446
11/Mar/2019:11:45:43.966]
https~ agent/agent0 643/0/0/126/769 200 442 - - ---- 2/2/0/1/0
0/0 {115|keep-alive} "GET /api/v1//product_version/ HTTP/1.1"
On the Splunk server, a successful request will allow the data inputs to be saved without any errors in the PCE web console or the /opt/splunk/var/log/TA-Illumio/ta-illumio.log file. Tail the ta-illumio.log when configuring the data inputs to see the latest logs. Enabling and disabling the data inputs will trigger the request to the PCE, which is a good way to test it.
The data input information should be saved in the location below without the API username/password:
/opt/splunk/etc/apps/IllumioAppforSplunk/local/inputs.conf

[illumio://knpce1]
api_key_id =
api_secret =
cnt_port_scan = 10
enable_data_collection = Enabled
interval = 3600
pce_url = https://pce.domain.com:8443
port_number = 514
self_signed_cert_path = /opt/splunk/custom_certificate.cer
time_interval_port = 60
disabled = 0
Sankey Diagram Is Not Displayed in the Traffic Explorer Dashboard
You need to install the Sankey Diagram App to be able to visualize the diagram in the Communications Map Between Labeled Workloads panel.
Label Filters Are Not Populated
The App, Env, and Loc label filters are not populated.
Try to run the "Illumio_Workload_Mapping" saved search via expanding time range.
Make sure that the interval configuration for inputs is less than 24 hours.
Failed to Start KV Store Process Error Occurs
Use the following steps to resolve this issue:
Open the CLI of the search head and go to the Splunk bin directory or cd to
/opt/splunk/bin and type ./splunkfor all of the following commands.To see the status of the KV store, enter the following command:
# splunk show kvstore-status -auth <user_name>:<password>.Use the following command to check the FQDN of your server:
# hostname - fqdnCopy the FQDN.
Create a new SSL certificate in the
/opt/splunk/etc/authdirectory and run the following command to create an SSL certificate for this server using the FQDN that you copied:(Run this command if the search head is in a distributed environment and not in a cluster environment.)
# splunk createssl server-cert 3072 -d /opt/splunk/etc/auth -n server -c <FQDN>You will see that one new .pem file has been generated.
Restart Splunk to load the certificate.
Check the status of kvstore again using the following command:
#./splunk show kvstore-status -auth <user_name>:<password>The status should show as ready.
After you perform these steps, when you log back into Splunk, the error messages will no longer display and your app will most likely be working again.
Known Limitations
In case of multiple input configurations, the port scan will be done based on the last configured input’s port scanner threshold value for all the inputs.
Because of certification requirements, the TA only supports TCP for syslog.
Because of certification requirements, data model acceleration is disabled by default. Without data model acceleration, some visualizations will not work. You can enable data model acceleration using the steps in Accelerate the Data Model.
Editing data input (modular input) while it is disabled can lead to exposing the user's Key ID and secret.
Compatibility Matrix
PCE Versions | Splunk Version | Illumio App for Splunk Version | Illumio Technology Add-On Version |
|---|---|---|---|
18.3, 19.1, 19.3, 20.1, 21.2, 21.5 | 7.3, 8.0, 8.1, 8.2, 9.0, 9.1 | 3.2.0 | 3.2.0 |
Special configuration is needed with version 18.2.0. Contact Illumio Support.
The Illumio App for Splunk 3.x is compatible with Python 2 and Python 3. Python 3 is available starting in Splunk 8.0.
Using the AWS CloudFormation Template
Use the following AWS CloudFormation template to set up the AWS S3 bucket objects.
{
  "AWSTemplateFormatVersion": "2010-09-09",
  "Description": "Flow log bucket",
  "Parameters": {
    "Bucketname": {
      "Type": "String"
    },
    "Externalid": {
      "Type": "String",
      "Default": "528298"
    }
  },
  "Resources": {
    "FlowbucketAwsS3Bucket": {
      "Type": "AWS::S3::Bucket",
      "Properties": {
        "BucketName": {
          "Ref": "Bucketname"
        }
      }
    },
    "IllumioFlowLogsAwsIamRole": {
      "Type": "AWS::IAM::Role",
      "Properties": {
        "RoleName": "illumio-flow-logs",
        "AssumeRolePolicyDocument": {
          "Version": "2012-10-17",
          "Statement": {
            "Effect": "Allow",
            "Principal": {
              "AWS": "857003445768"
            },
            "Action": [
              "sts:AssumeRole"
            ],
            "Condition": {
              "StringEquals": {
                "Sts:ExternalId": {
                  "Ref": "Externalid"
                }
              }
            }
          }
        },
        "Policies": [
          {
            "PolicyName": "can-see-bucket",
            "PolicyDocument": {
              "Version": "2012-10-17",
              "Statement": {
                "Effect": "Allow",
                "Sid": "illumioCanSeeBucket",
                "Action": [
                  "s3:ListBucket",
                  "s3:ListBucketVersions"
                ],
                "Resource": {
                  "Fn::Join": [
                    "",
                    [
                      "arn:aws:s3:::",
                      {
                        "Ref": "Bucketname"
                      }
                    ]
                  ]
                }
              }
            }
          },
          {
            "PolicyName": "can-use-bucket",
            "PolicyDocument": {
              "Version": "2012-10-17",
              "Statement": {
                "Effect": "Allow",
                "Sid": "illumioCanPutAndGet",
                "Action": [
                  "s3:PutObject",
                  "s3:GetObject"
                ],
                "Resource": {
                  "Fn::Join": [
                    "",
                    [
                      "arn:aws:s3:::",
                      {
                        "Ref": "Bucketname"
                      },
                      "/*"
                    ]
                  ]
                }
              }
            }
          }
        ]
      }
    }
  }
}
Use the following procedure:
Save the template to a .JSON file, such as illumio-flow-logs-template.json.
From the AWS Console > CloudFormation Services page, select Stacks, and note the current region because the AWS S3 bucket will be created in that region.
Select Create Stack, and then select With new resources (standard).
Select template is ready, upload the .JSON file that you created, and click Next.
Enter a name for the stack, such as illumio-flow-logs-s3-bucket-and-role.
Enter a bucket name. This name must be unique among all of the other S3 buckets in that region for all AWS customers. If it is not, the stack creation will fail with the "Bucketname already exists" error message.
Enter an external ID. See the following article for information about how and why to use an external Id: How to Use External ID When Granting Access to Your AWS Resources.
Keep the default options for Configure stack options, and click Next.
Review your configuration, check the acknowledgment, and click Submit.
The bucket will be created along with a role called illumio-flow-logs with the appropriate permissions for the provided Illumio AWS account. You must also create a role for your SIEM to read objects from the bucket. For examples, see Configure S3 permission.
Legal Notice
Copyright © 2026 Illumio 920 De Guigne Drive, Sunnyvale, CA 94085. All rights reserved.
The content in this documentation is provided for informational purposes only and is provided "as is," without warranty of any kind, expressed or implied, of Illumio. The content in this documentation is subject to change without notice.
Resources
Contact Information