Illumio Insights Overviews and Use Cases
Resource Traffic
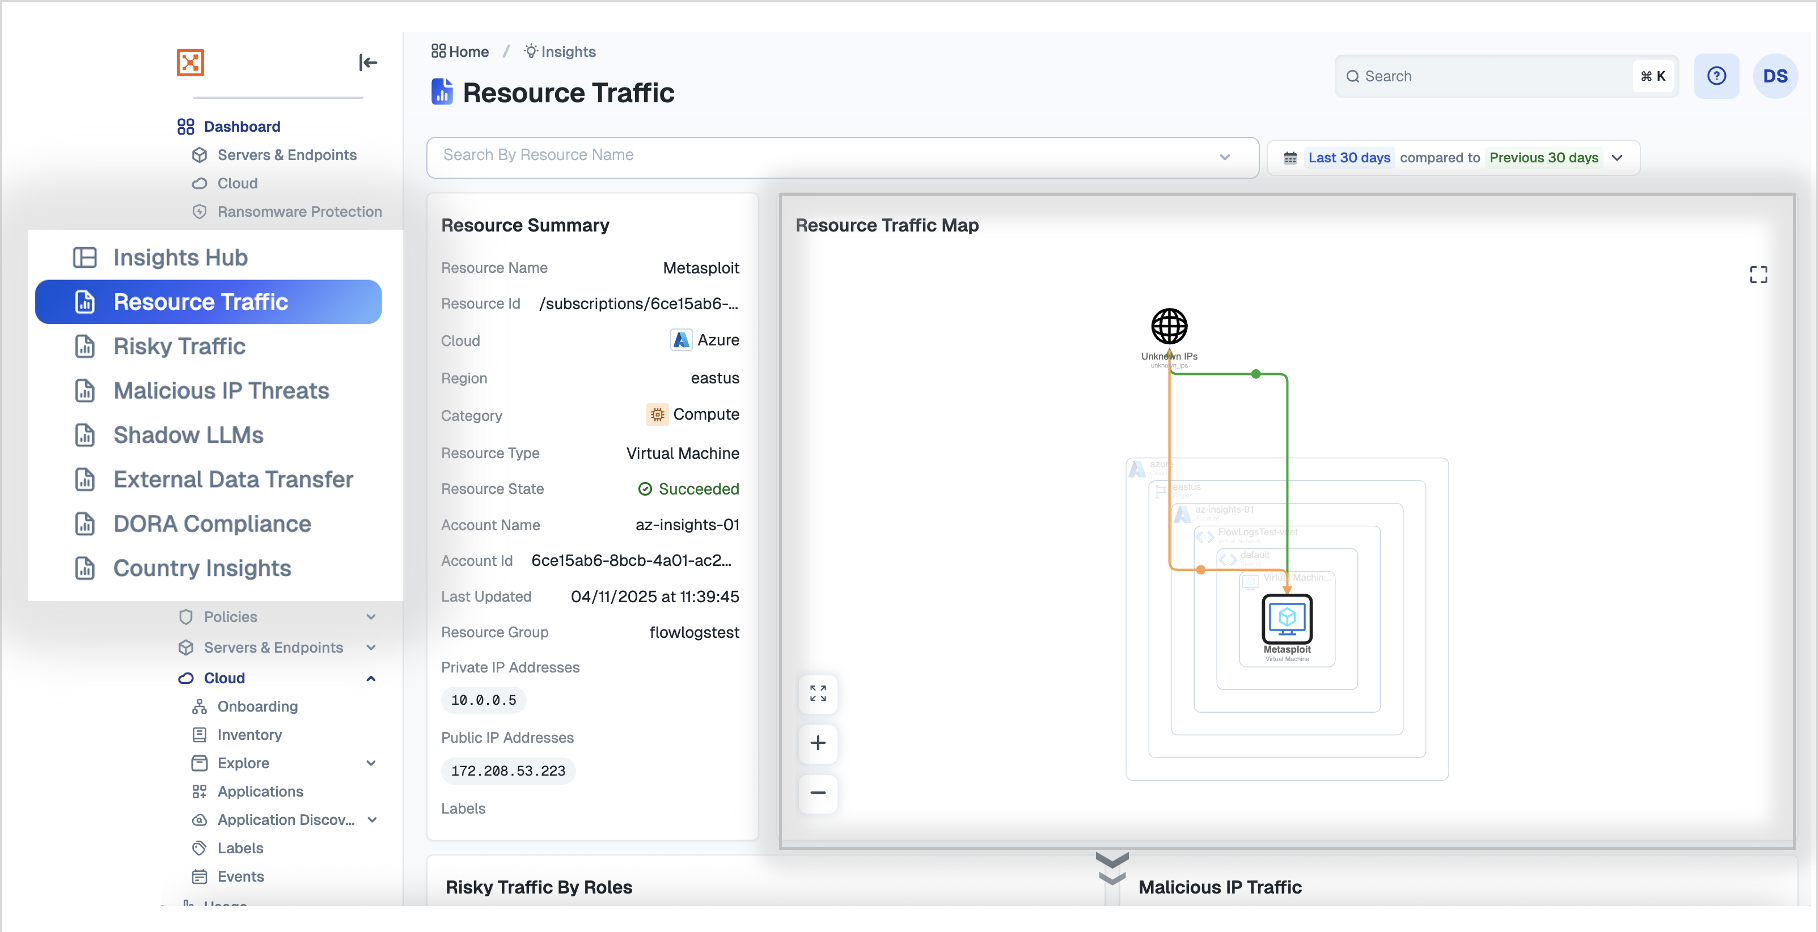
The Resource Traffic dashboard allows you to examine a single resource in detail. You can access all related metadata, resources connected to it, and see in real time what it’s directly interacting with—visualized through the Resource Traffic Map. Other widgets on this page help you identify if it has been engaging with malicious IPs, attempting external data transfers, or using potentially risky protocols.
Risky Traffic
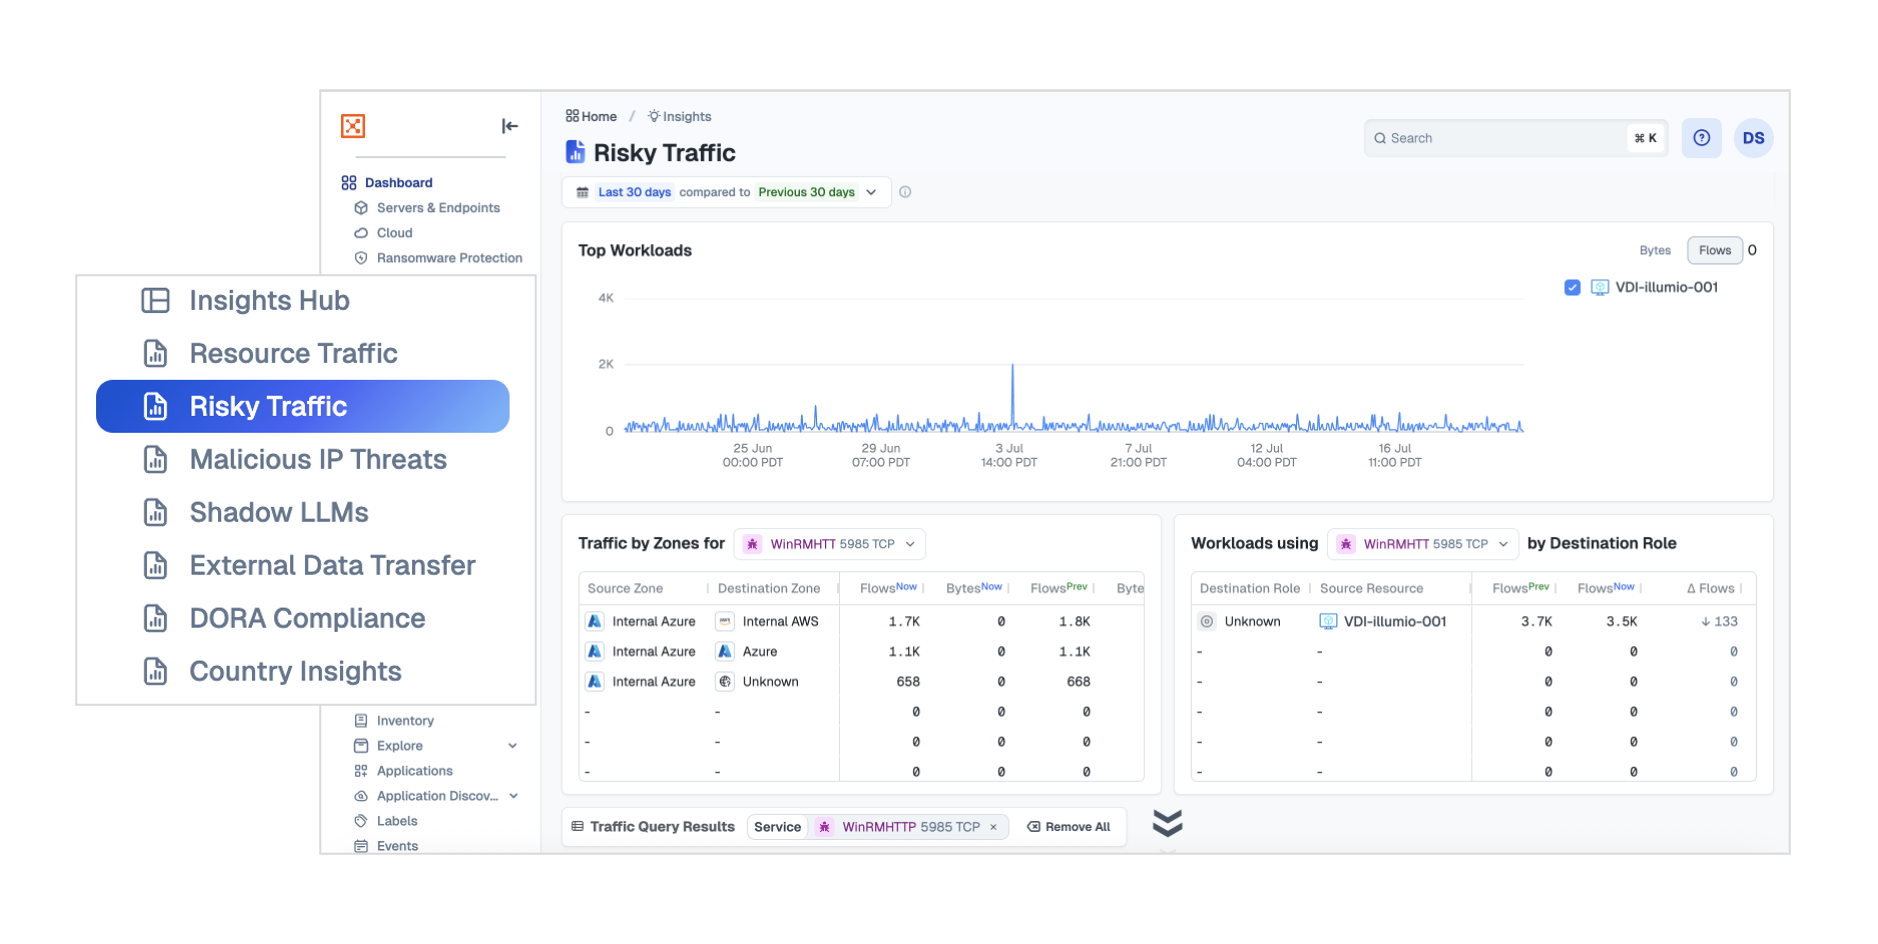
The Risky Traffic dashboard focuses investigation on the use of potentially dangerous ports and protocols in your environment—these are services that attackers are known to exploit for lateral movement.
When you select any protocol from the “Risky Services Traffic” widget, it updates all other widgets on the page to show data related to that protocol. From there, you can review specific types of workloads that participated in this traffic, review activity patterns, see zone and account traversal, and more.
Malicious IP Threats
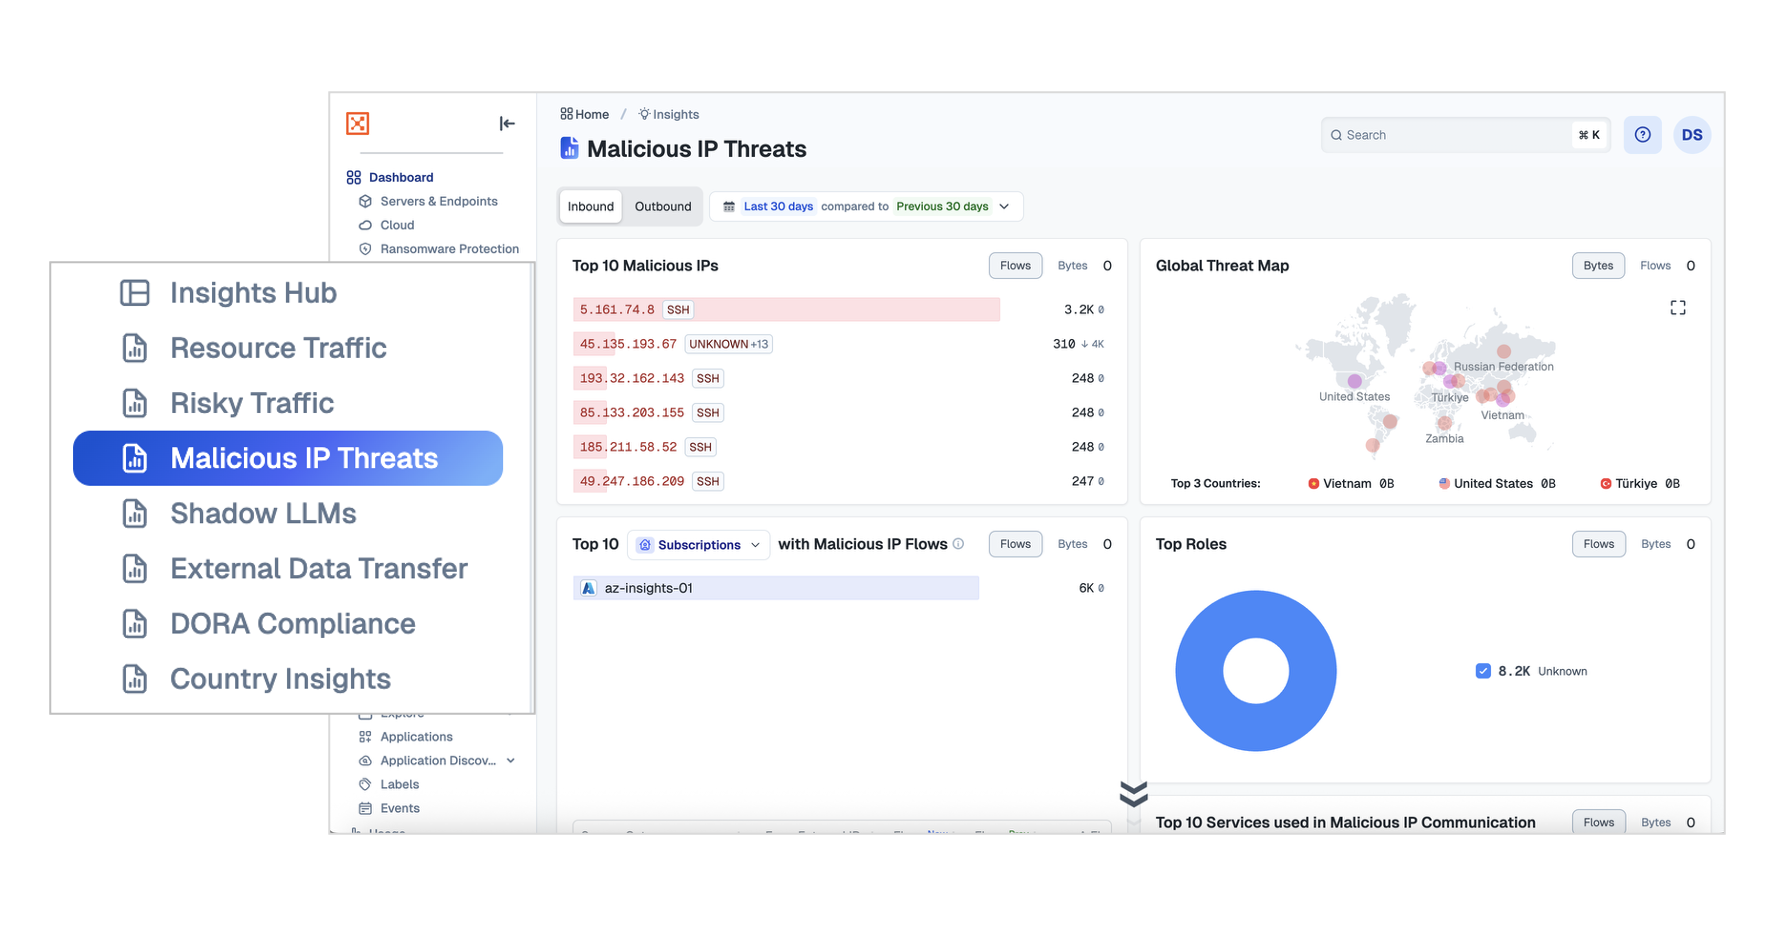
The Malicious IP Threats dashboard shows activity between known malicious IPs and your environment. It displays the top talkers, the locations of these malicious IPs worldwide, as well as specific accounts, workloads, and protocols that are being targeted.
Shadow LLMs
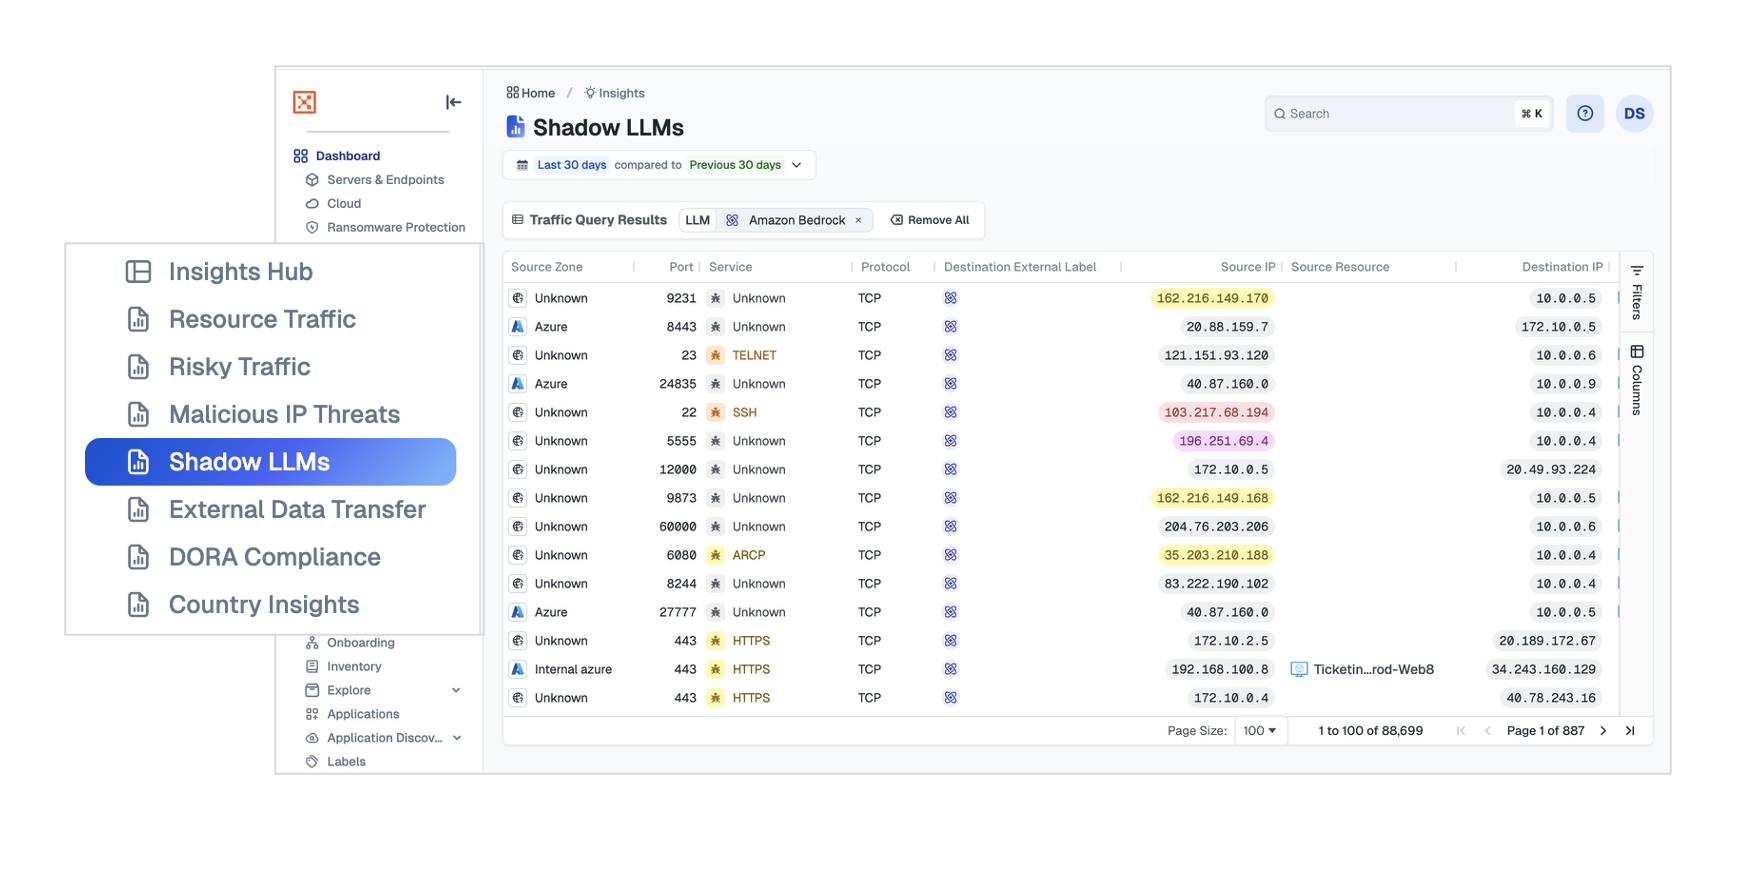
Use the Shadow LLMs dashboard to see which publicly accessible LLM services your resources are accessing and exchanging data with. You can view the specific LLMs being used, the accounts associated with this activity, and the resources involved in the access.
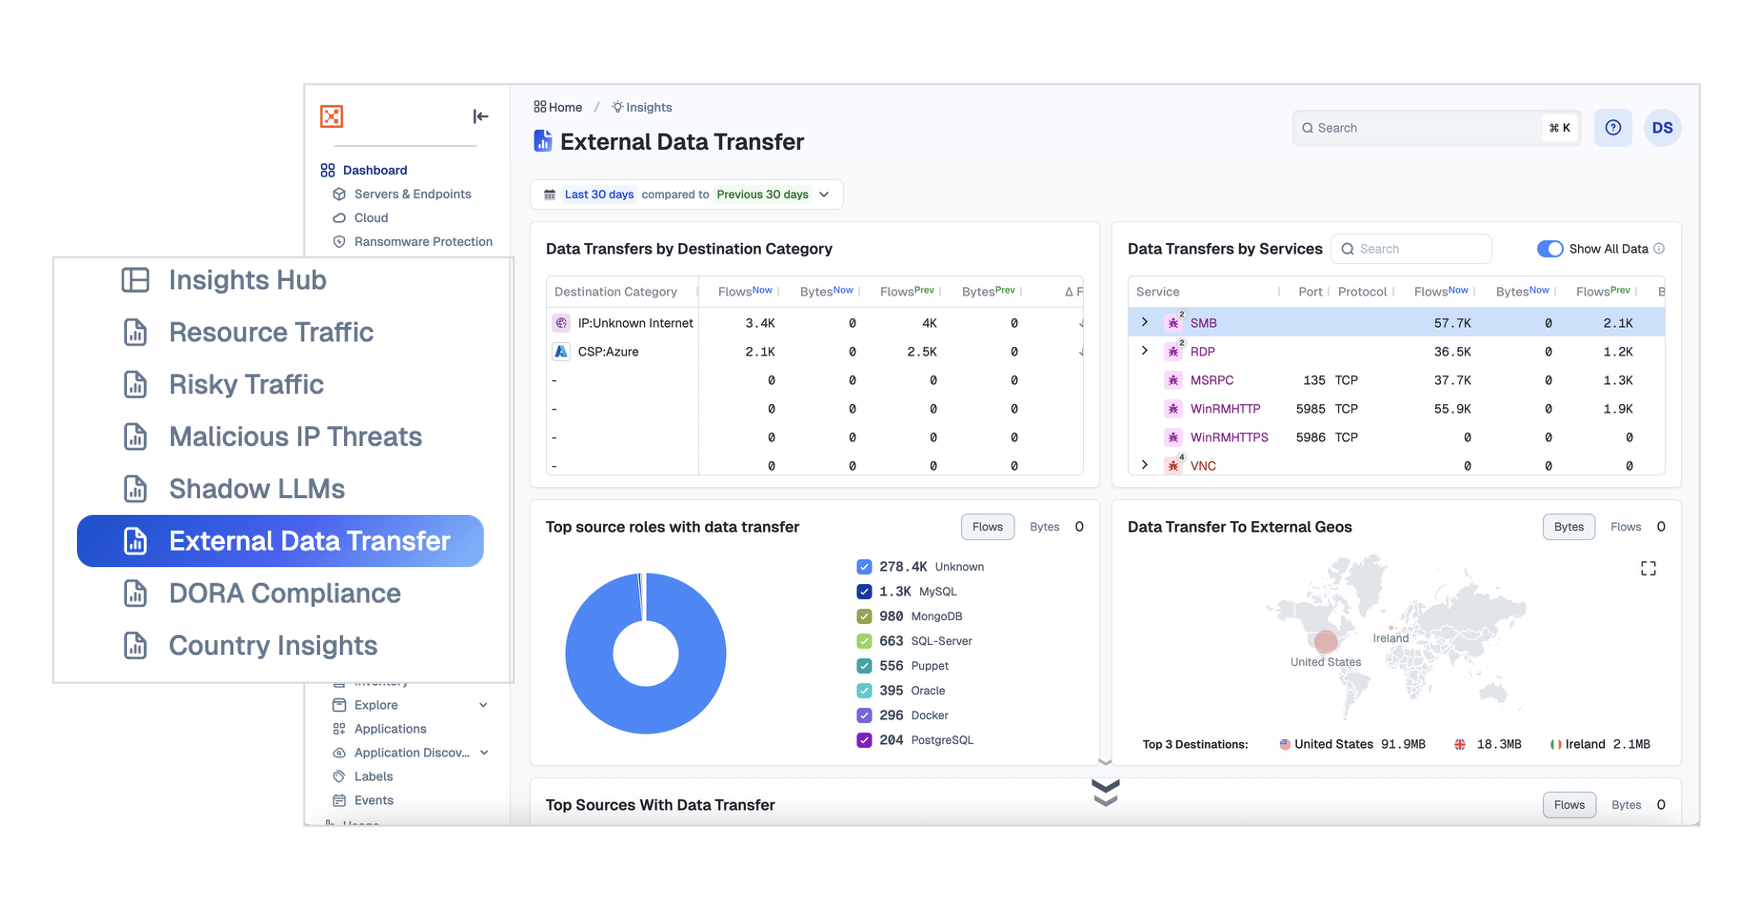
External Data Transfer
The External Data Transfer dashboard highlights data leaving your environment for destinations on the internet. You can see where your data is being sent, which protocols are used for the transfer, and details about specific workloads and workload types involved.
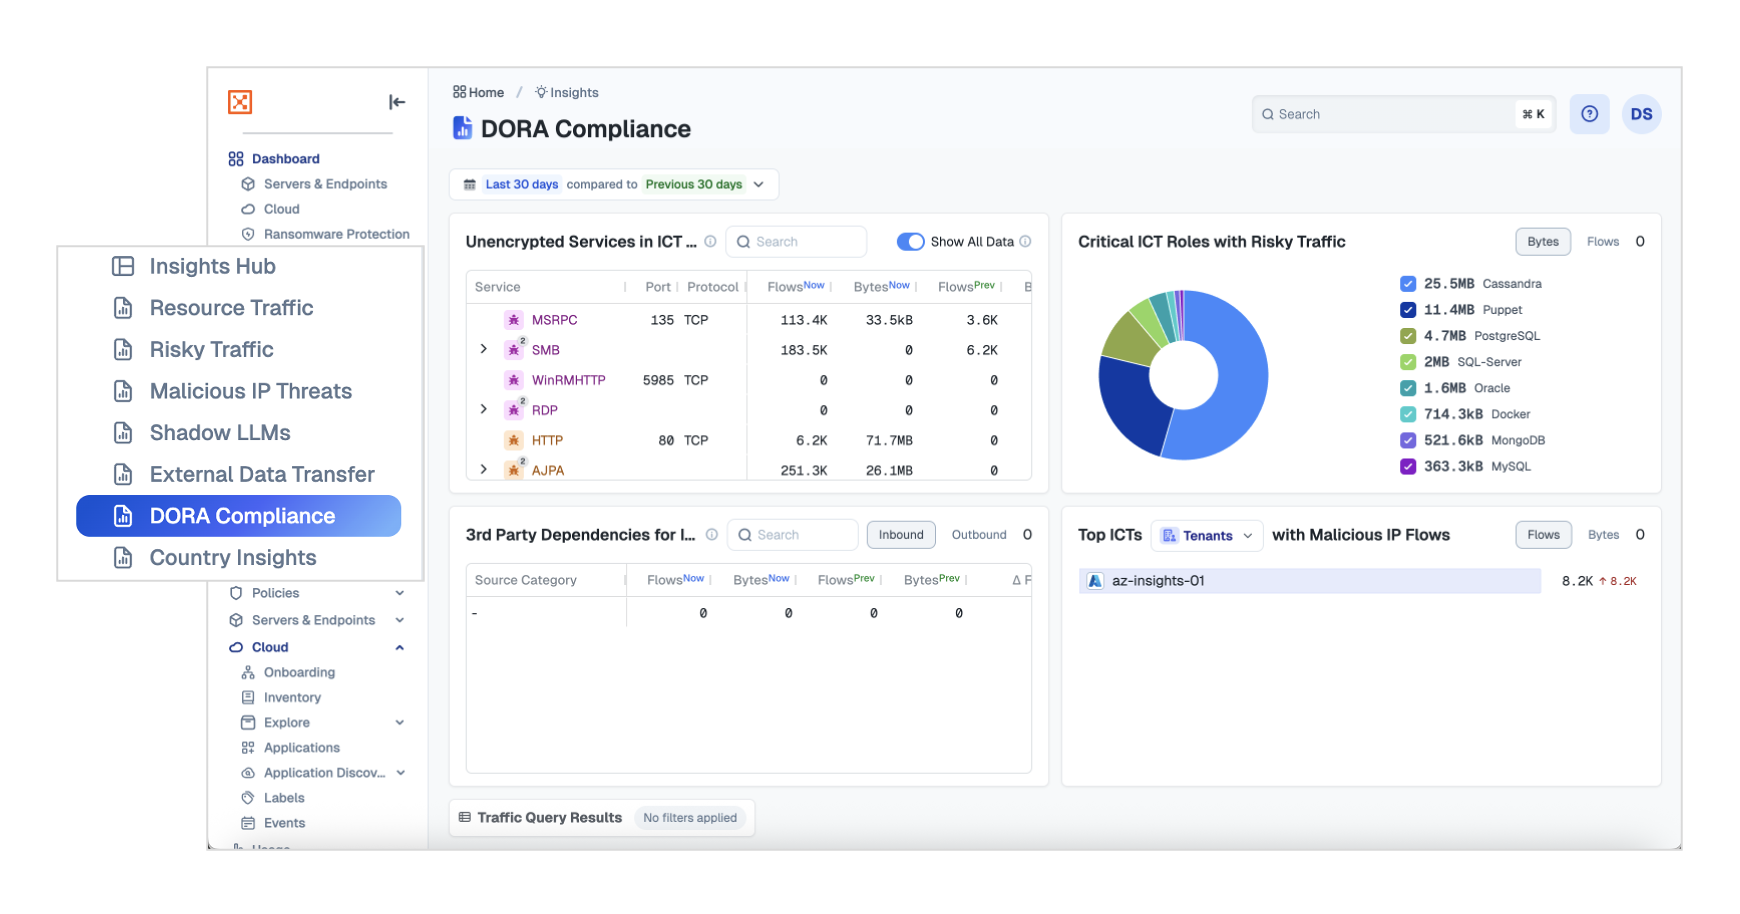
DORA Compliance
One of the main requirements of the EU’s Digital Operational Resilience Act (DORA) is monitoring risks related to franchise-critical Information and Communication Technology (ICT) systems. The DORA Compliance dashboard combines important widgets from other Insights dashboards into a single view to assist with monitoring, detection, response, and reporting needs of DORA.
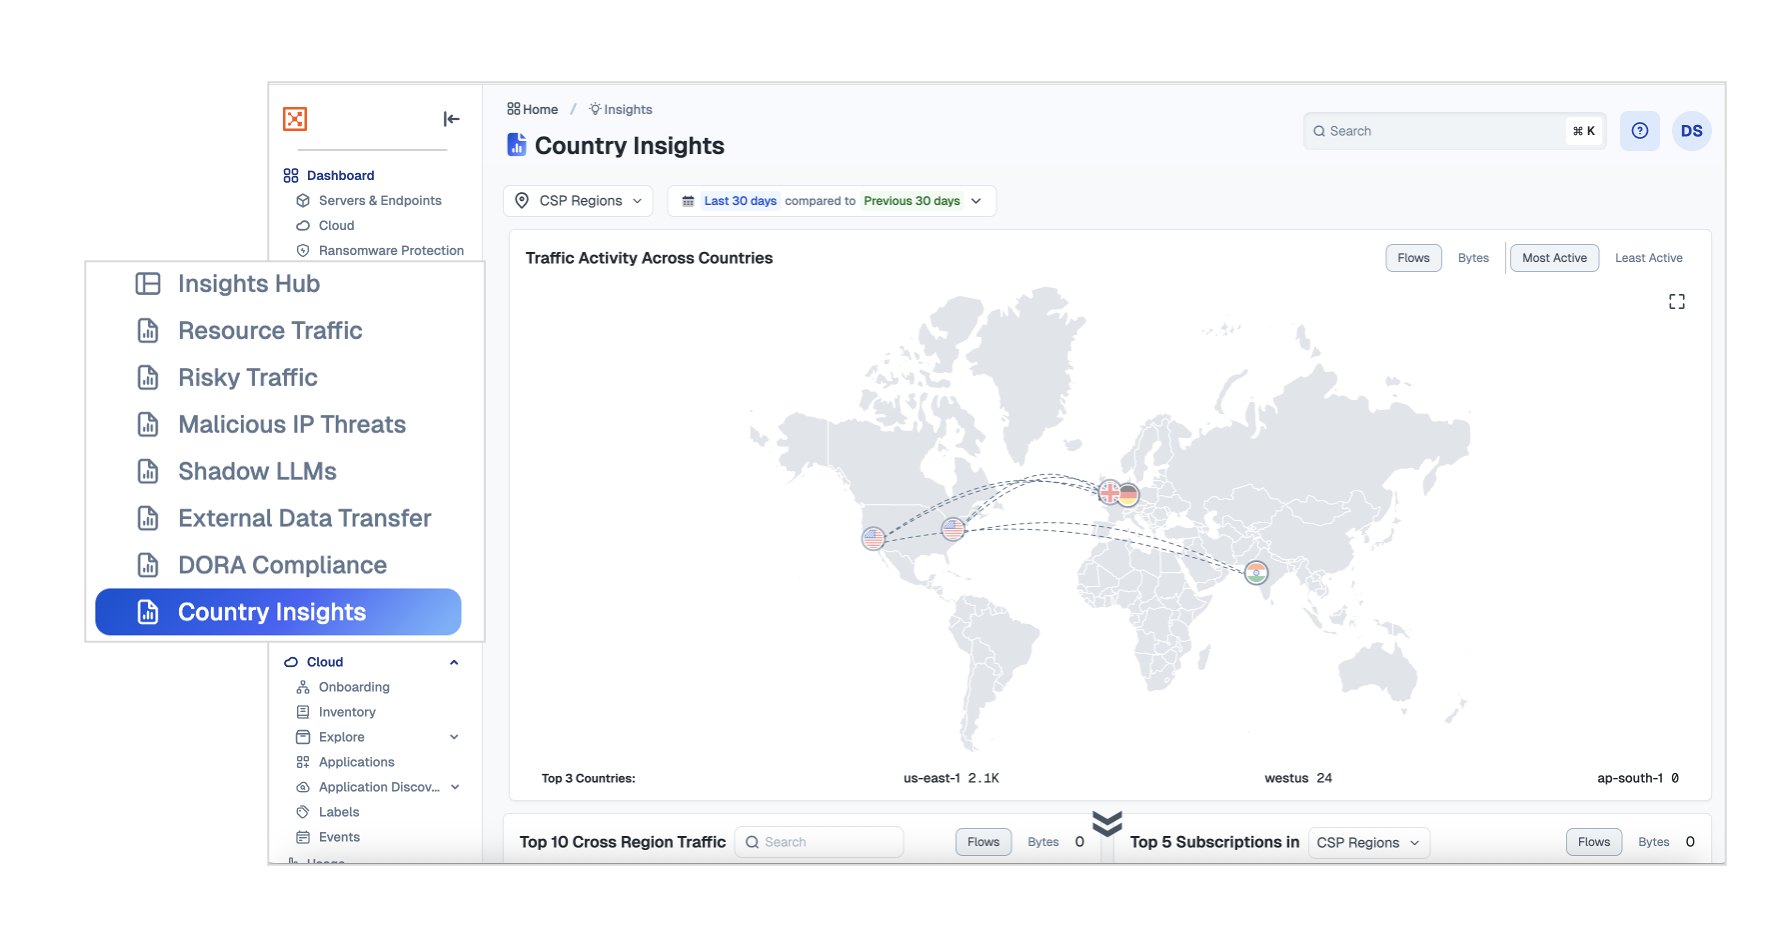
Country Insights
Use Country Insights to monitor global traffic and spot suspicious patterns in unexpected regions. Filter traffic by Cloud Service Provider (CSP) regions—such as Northern Europe AWS data centers—to analyze traffic origins and detect risky connections.
Insights Use Cases
Now that you’re familiar with what’s available in Insights, here are some common use cases to help you explore further.
Investigate the use of unauthorized ports and protocols.
Explore possible lateral movement by a threat actor.
Inspect activity related to known malicious IPs.
Identify use of public LLMs.
Check for possible data exfiltration.